Fig. 5.
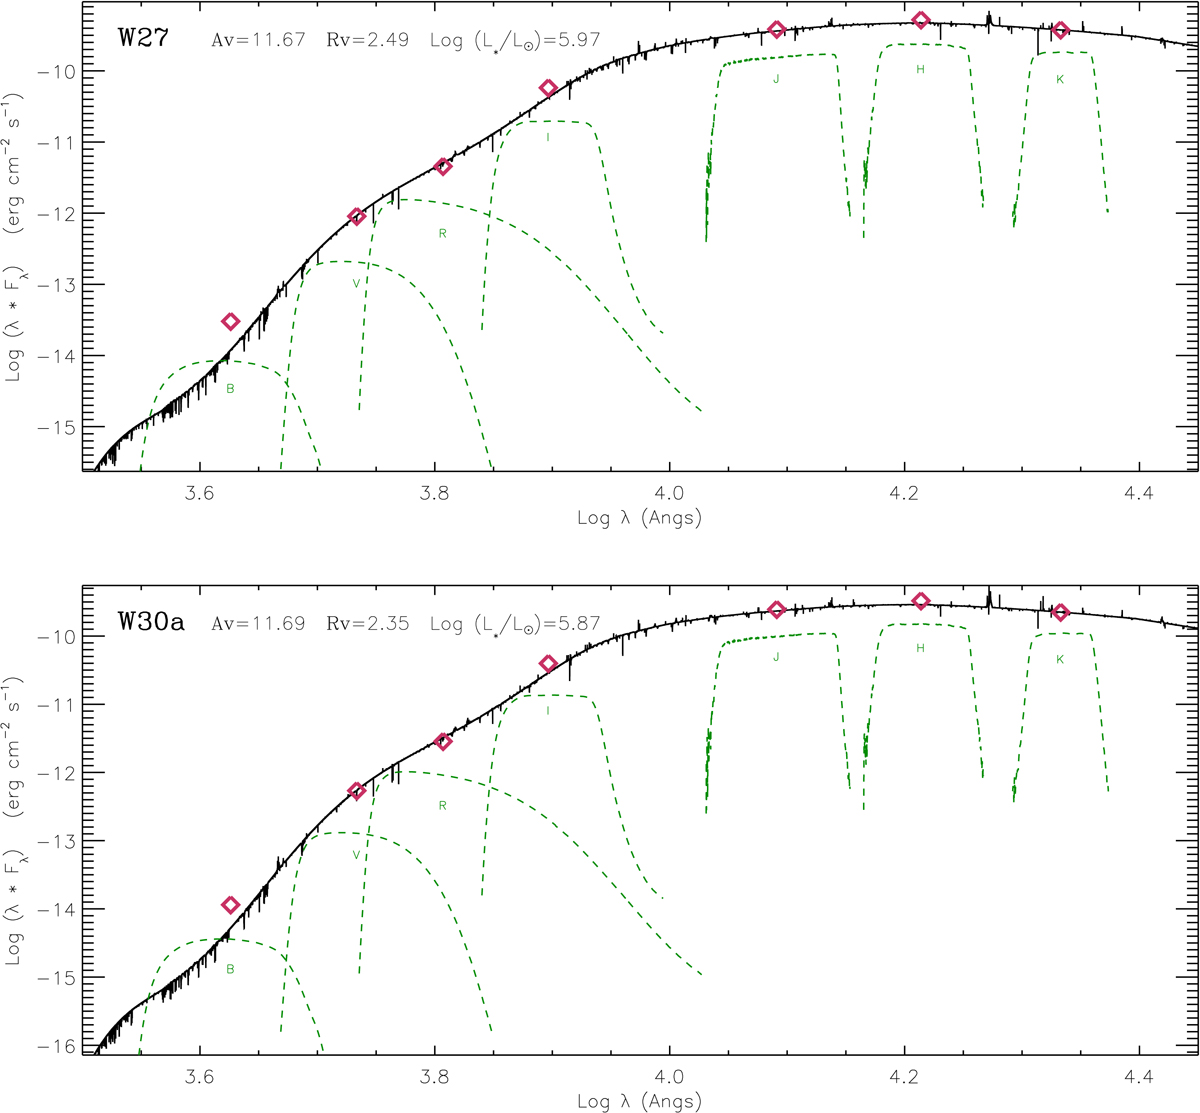
Comparison of the synthetic spectral energy distributions of Wd1-27 and -30a derived from model-atmosphere analysis to observations (Sect. 4). The band-passes of the filters are delineated by green dashed lines, photometry with red diamonds and the (reddened) synthetic spectra by the solid black line. Errors on photometric data are smaller than the symbol sizes. Reddening parameters and resultant bolometric luminosity are also indicated.
Current usage metrics show cumulative count of Article Views (full-text article views including HTML views, PDF and ePub downloads, according to the available data) and Abstracts Views on Vision4Press platform.
Data correspond to usage on the plateform after 2015. The current usage metrics is available 48-96 hours after online publication and is updated daily on week days.
Initial download of the metrics may take a while.