| Issue |
A&A
Volume 622, February 2019
|
|
|---|---|---|
| Article Number | A87 | |
| Number of page(s) | 15 | |
| Section | Extragalactic astronomy | |
| DOI | https://doi.org/10.1051/0004-6361/201833911 | |
| Published online | 31 January 2019 | |
Dust properties in the cold and hot gas phases of the ATLAS3D early-type galaxies as revealed by AKARI
1
Graduate School of Science, Nagoya University, Chikusa-ku, Nagoya 464-8602, Japan
e-mail: This email address is being protected from spambots. You need JavaScript enabled to view it.
2
Sub-department of Astrophysics, Department of Physics, University of Oxford, Denys Wilkinson Building, Keble Road, Oxford OX1 3RH, UK
3
Yonsei Frontier Lab and Department of Astronomy, Yonsei University, 50 Yonsei-ro, Seodaemon-gu, Seoul 03722, Republic of Korea
4
Department of Physics, School of Science, Tokyo Institute of Technology, 2-12-1 Ohokayama, Meguro Tokyo 152-8551, Japan
5
Institute of Space and Astronautical Science, Japan Aerospace Exploration Agency, 3-1-1 Yoshinodai, Chuo-ku, Sagamihara, Kanagawa 252-5210, Japan
Received:
20
July
2018
Accepted:
21
December
2018
Abstract
Context. The properties of the dust in the cold and hot gas phases of early-type galaxies (ETGs) are key to understanding ETG evolution.
Aims. We aim to conduct a systematic study of the dust in a large sample of local ETGs, focusing on relations between the dust and the molecular, atomic, and X-ray gas of the galaxies, as well as their environment.
Methods. We estimated the dust temperatures and masses of the 260 ETGs from the ATLAS3D survey, using fits to their spectral energy distributions primarily constructed from AKARI measurements. We also used literature measurements of the cold (CO and H I) and X-ray gas phases.
Results. Our ETGs show no correlation between their dust and stellar masses, suggesting inefficient dust production by stars and/or dust destruction in X-ray gas. The global dust-to-gas mass ratios of ETGs are generally lower than those of late-type galaxies, likely due to dust-poor H I envelopes in ETGs. They are also higher in Virgo Cluster ETGs than in group and field ETGs, but the same ratios measured in the central parts of the galaxies only are independent of galaxy environment. Slow-rotating ETGs have systematically lower dust masses than fast-rotating ETGs. The dust masses and X-ray luminosities are correlated in fast-rotating ETGs, whose star formation rates are also correlated with the X-ray luminosities.
Conclusions. The correlation between dust and X-rays in fast-rotating ETGs appears to be caused by residual star formation, while slow-rotating ETGs are likely well evolved, and have therefore exhausted their dust. These results appear consistent with the postulated evolution of ETGs, whereby fast-rotating ETGs form by mergers of late-type galaxies and associated bulge growth, while slow-rotating ETGs form by (dry) mergers of fast-rotating ETGs. Central cold dense gas appears to be resilient against ram pressure stripping, suggesting that Virgo Cluster ETGs may not suffer strong related suppression of star formation.
Key words: galaxies: elliptical and lenticular, cD / galaxies: ISM / galaxies: photometry / dust, extinction / infrared: galaxies
© ESO 2019
1. Introduction
Early-type galaxies (ETGs), consisting of elliptical and lenticular galaxies, are thought to be in a late stage of galaxy evolution. They are dominated by old stellar populations that produce little dust and are often filled with X-ray-emitting plasma (e.g. Forman et al. 1979) that can destroy dust by sputtering on a timescale of 106–107 yr (Draine & Salpeter 1979). These ETGs therefore provide severe conditions for dust survival, but many ETGs have nevertheless been shown to possess a cold interstellar medium (ISM; e.g. Knapp et al. 1985, 1989; Wardle & Knapp 1986; Knapp & Rupen 1996). The far-infrared (FIR) emission from dust in ETGs was first observed by the Infrared Astronomical Satellite (IRAS; Knapp et al. 1989), which revealed that about half of all ETGs observed contain cold dust. Because most of the IRAS detections were close to its detection limit, Bregman et al. (1998) carefully evaluated the background contamination in the IRAS maps and found that 12% of the ETGs were detected in dust emission above the 98% confidence level. Following IRAS, more sensitive and detailed observations were performed by the Infrared Space Observatory (ISO), Spitzer, AKARI, and Herschel, whereby pervasive dust in ETGs was found with a detection rate of ∼50% (e.g. Temi et al. 2004, 2007; Kaneda et al. 2011; Smith et al. 2012).
Cold gas is also detected in many ETGs (e.g. Knapp et al. 1985; Wardle & Knapp 1986; Combes et al. 2007). Young et al. (2011) performed a census of the molecular gas in the 260 local ETGs of the ATLAS3D survey (Cappellari et al. 2011a), revealing prevalent molecular gas and a detection rate of 22%. Using AKARI, Kokusho et al. (2017) recently measured the FIR emission from dust in the ATLAS3D ETGs, confirming that the dust and molecular gas are well correlated in CO-detected objects. This suggests that the dust and molecular gas in ETGs are physically connected, just as in late-type galaxies (LTGs). Davis et al. (2015) measured the dust, atomic, and molecular gas masses of 17 ETGs showing dust lanes in optical images, revealing that most are gas-rich compared to LTGs and that the dust-to-gas mass ratio varies widely from galaxy to galaxy. As metal enrichment is likely to have proceeded well in ETGs, this indicates that most dust-lane ETGs have probably acquired their gas through gas-rich (minor) mergers. Indeed many authors have argued that ETGs amass their cold ISM through external paths, such as galaxy mergers and gas accretion from the intergalactic medium (e.g. Knapp et al. 1989; Sarzi et al. 2006; Davis et al. 2011; Lagos et al. 2014). Dust growth in interstellar space is also postulated as an internal channel for dust production in ETGs (Martini et al. 2013; Hirashita et al. 2015).
Galaxy environment is an important factor that may determine the properties and origins of the cold ISM in ETGs. For example, the H I detection rate drops significantly for ETGs in the Virgo Cluster, where H I gas in galaxies appears to be stripped away by the hot intracluster medium (ICM; e.g. di Serego Alighieri et al. 2007). Within the framework of the ATLAS3D project, Davis et al. (2011) demonstrated that about half of the sample ETGs in the field have kinematically misaligned gas and stars, indicating that they likely acquired their cold ISM through external paths. On the other hand, ETGs in the Virgo Cluster almost always have kinematically aligned gas and stars, suggesting cold ISM of internal origin. A combination of the two effects likely explains this field-cluster dichotomy. First, it is often argued that when galaxies are virialised in a galaxy cluster, the high velocity dispersion across cluster galaxies reduces the galaxy merger rate (e.g. van Dokkum et al. 1999). Second, any minor merger is in any case likely to be dry, as small galaxies should be ram pressure-stripped of their gas upon crossing the cluster (Davis et al. 2011).
Whether dust in ETG interstellar space is replenished through internal or external paths, dust should suffer heating and destruction by the diffuse X-ray plasma prevalent in ETGs (e.g. Forman et al. 1985). This diffuse X-ray plasma is generally attributed to stellar mass loss, heated to the kinematic temperature determined by the galaxy stellar velocity dispersion through collisions with the ambient gas (e.g. Canizares et al. 1987). Gravitational heating by the galaxy potential and supernova explosions also likely contribute to the heating (e.g. Mathews & Loewenstein 1986). As the dust destruction rate should be proportional to the density of the X-ray plasma, dust emission is expected to be anti-correlated with the X-ray emission in ETGs. Temi et al. (2007) and Smith et al. (2012) examined the relation between dust and X-rays in ETGs but found no correlation. Hence the nature of the dust destruction process(es) in ETGs is still unclear; or dust replenishment by internal and/or external sources must compensate the dust destruction. A possible caveat of the above studies, however, is that their X-ray measurements may include X-ray emission from point sources (such as low-mass X-ray binaries and AGNs; e.g. Boroson et al. 2011) in addition to the diffuse plasma. A more careful analysis of the X-ray emission is therefore needed to precisely evaluate the state of the dust in the diffuse X-ray plasma of ETGs.
As suggested above, the physical state of the dust in the cold and hot gas phases of ETGs may imprint clues about the history of their cold ISM, itself the fuel for residual star formation (e.g. Combes et al. 2007; Davis et al. 2014). Hence it is crucial to understand the properties of the dust in these various gas phases to reveal the evolution of ETGs. In this paper, we therefore perform a systematic study of the dust in the ATLAS3D ETGs for which atomic (H I), molecular (CO), and ionised (X-ray) gas measurements are available. We describe the data in Sect. 2 and present the derived dust parameters in Sect. 3. We discuss the dust properties of our ETGs by combining our results with literature data in Sect. 4, and we summarise our results in Sect. 5.
2. Sample and data
2.1. ATLAS3D survey
To understand the formation and evolution histories of ETGs, the ATLAS3D survey (Cappellari et al. 2011a) performed a systematic study of a volume-limited sample of 260 nearby (MK < −21.5 and D < 42 Mpc) morphologically selected ETGs. Molecular gas (Combes et al. 2007; Crocker et al. 2011; Young et al. 2011; Alatalo et al. 2013) and atomic gas (Serra et al. 2012) observations are available in addition to systematic optical integral-field spectroscopy with the SAURON instrument (Bacon et al. 2001). Following the kinematic classification first introduced by Emsellem et al. (2007) and Cappellari et al. (2007); Emsellem et al. (2011) separated the ATLAS3D sample galaxies into fast- (86%) and slow-rotating ETGs (14%). This kinematic classification is less affected by inclination and more robust than the standard morphological classification into elliptical and lenticular galaxies, and Emsellem et al. (2011) found that 66% of the ellipticals in the ATLAS3D sample are in fact fast-rotating. We therefore adopt this kinematic classification in the present study.
2.2. AKARI all-sky survey
Using the AKARI all-sky maps (Murakami et al. 2007; Doi et al. 2015; Ishihara et al., in prep.), Kokusho et al. (2017) systematically measured the 9, 18, 65, 90, and 140 μm band fluxes of the ATLAS3D ETGs. They performed aperture photometry within a circular aperture of radius  , where Re and DPSF are respectively the effective radius of the galaxy in the optical B band (Cappellari et al. 2011a) and the full width at half maximum of the AKARI point spread function (PSF) in the relevant band (Ishihara et al. 2010; Takita et al. 2015). Combining the AKARI measurements with Wide-field Infrared Survey Explorer (WISE; Cutri et al. 2013) and Two Micron All Sky Survey (2MASS; Skrutskie et al. 2006; Griffith et al. 2015) data, Kokusho et al. (2017) decomposed the resulting spectral energy distributions (SEDs) into polycyclic aromatic hydrocarbon (PAH), warm dust, and cold dust emission. For the dust emission, Kokusho et al. (2017) used a two-temperature modified blackbody model with fixed emissivity power-law index β = 2. For the 68 galaxies robustly detected (i.e. with a signal-to-noise ratio S/N > 3) in two or three of the three AKARI FIR bands (65, 90, and 140 μm), the dust temperatures were constrained by the fits, while for the remaining galaxies robustly detected in only one or no FIR bands, the dust temperatures were fixed to the means of the best-fit temperatures of the 68 galaxies detected in two or three FIR bands. In total, the SED fits of 231 galaxies are accepted at the 90% confidence level. We calculate their dust masses in Sect. 3.2.
2.3. X-ray data
To evaluate the diffuse X-ray emission of ETGs, it is essential to exclude contamination by X-ray point sources (e.g. Boroson et al. 2011). Several studies have estimated the diffuse X-ray emission of the ATLAS3D ETGs using Chandra and its unprecedented angular resolution (Sarzi et al. 2013; Kim & Fabbiano 2015; Su et al. 2015; Goulding et al. 2016), enabling them to mask out X-ray point sources and derive accurate diffuse X-ray fluxes. Here, we adopt the X-ray measurements of Su et al. (2015), who measured the diffuse X-ray emission from the 42 ATLAS3D ETGs observed with Chandra for no less than 15 ks. They used a circular aperture of radius Raper = 2Re, identical to our IR photometry apertures except for our inclusion of the AKARI PSF extents.
3. Results
3.1. Far-infrared detection rates
Kokusho et al. (2017) detected FIR dust emission in 45% of the ATLAS3D galaxies, where a FIR detection is defined as a robust detection in at least one of the three AKARI FIR bands. The FIR detection rate is 27% and 52% for the ATLAS3D elliptical and lenticular galaxies, respectively, showing that lenticulars are more likely to contain cold dust. This is consistent with previous studies, where the dust detection rate is two to three times higher in lenticulars than in ellipticals (e.g. Knapp et al. 1989; Smith et al. 2012; di Serego Alighieri et al. 2013). On the other hand, the FIR detection rate is 42% and 46% for the ATLAS3D fast- and slow-rotating ETGs, respectively. The same trend is found from Herschel observations of local ETGs, where respectively 43% and 45% of fast- and slow-rotating ETGs are robustly detected in the 250 μm band (Smith et al. 2012). However the number of fast- and slow-rotating ETGs in these studies is very different, with respectively 224 versus 36 in our sample and 51 versus 11 in Smith et al. (2012). The above trend should therefore be confirmed with a larger number of slow-rotating ETGs.
3.2. Dust temperatures and masses
We estimate the dust masses of our sample ETGs using the SED fits of Kokusho et al. (2017). Their dust model is described by
 (1)
(1)
and
 (2)
(2)
where Fν is the flux density in each band, κν the dust mass absorption coefficient parametrised as κν ∝ ν2, Md the dust mass, Td the dust temperature, Bν(Td) the Planck function, and D the distance to the galaxy. We adopt κ140 μm = 13.9 cm2 g−1 (Draine 2003) and the distances listed in Cappellari et al. (2011a). The derived dust temperatures and masses are listed in Table A.1.
The top panels of Fig. 1 show the histograms of the warm and cold dust temperatures (Twarm and Tcold) for the 68 galaxies robustly detected in two or three of the three AKARI FIR bands. There is a wide range of Twarm (50–127 K). Warm dust emission in ETGs generally originates from circumstellar dust around old stars (e.g. Temi et al. 2009), but warm interstellar dust heated by star formation activity and/or AGNs has also been identified (e.g. Amblard et al. 2014). The wide range of Twarm may thus indicate that the dust heating mechanism varies from galaxy to galaxy. A Kolmogorov–Smirnov (K–S) test indicates that for both Twarm and Tcold, the distributions of fast- and slow-rotating ETGs are not statistically different. The mean value of Tcold for the same 68 ETGs is 26 ± 1 K higher than the typical value for LTGs (≲20 K), a trend also reported by Smith et al. (2012) and di Serego Alighieri et al. (2013), who suggest that ETGs possess intense stellar radiation fields due to their dense central populations of old stars.
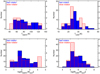 |
Fig. 1. Top: histograms of the warm and cold dust temperatures for the 68 ATLAS3D ETGs robustly detected in two or three of the three AKARI FIR bands. Blue (left vertical axes) and red (right vertical axes) represent fast- and slow-rotating galaxies, respectively. Bottom: as for the top panels, but for the warm and cold dust masses of the 111 ATLAS3D ETGs robustly detected in at least one AKARI FIR band. |
The bottom panels of Fig. 1 show the histograms of the warm and cold dust masses (Mwarm and Mcold) for the 111 galaxies robustly detected in at least one AKARI FIR band. Mwarm and Mcold are estimated to be in the range 100.5–104.2 M⊙ and 104.5–107.8 M⊙, respectively, showing that the dust mass in FIR-detected ETGs is dominated by the cold dust component, likely found in the interstellar space of ETGs (e.g. Goudfrooij & de Jong 1995; Temi et al. 2007; Kokusho et al. 2017). The range of Mcold is in agreement with that of previous studies. For example, Smith et al. (2012) derived a Mcold range of 105.0–M7.1 M⊙ for local ETGs, while Agius et al. (2015) reported that their nearby ETGs have a Mcold range of 104.1–107.9 M⊙. Again, the differences between the Mwarm and Mcold distributions of fast- versus slow-rotating ETGs are not statistically significant.
3.3. Dust and stellar masses
Figure 2 shows the total dust masses (Mdust), defined as the sums of Mwarm and Mcold, plotted against the stellar masses (M⋆), obtained from optical photometry and dynamically measured mass-to-light ratios in the ATLAS3D survey (Cappellari et al. 2013b). The galaxies not detected in any AKARI FIR band are shown as 3σ upper limits, where σ is the uncertainty estimated from the SED fit of each galaxy (Kokusho et al. 2017). The grey lines show Mdust predicted when the dust replenishment by stellar mass loss exactly balances the destruction of dust grains by sputtering in an X-ray plasma. To estimate these, we adopted a stellar mass loss rate Ṁ = 2.1 × 10⁻¹²(LK/LK,⊙)M⊙ yr−1 (Knapp et al. 1992), a typical K-band stellar mass-to-light ratio M⋆/LK = 1.21 M⊙/LK, ⊙ (Cappellari et al. 2013b), and a dust destruction timescale in an X-ray plasma of 106 and 107 yr, respectively, for the two lines shown in Fig. 2, the latter estimated by assuming a typical dust grain size of 0.1 μm and a gas density of 10−1 and 10−2 cm−3 (Draine & Salpeter 1979).
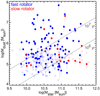 |
Fig. 2. Total dust masses vs. stellar masses. Solid circles indicate galaxies robustly detected in at least one AKARI FIR band. Downward open triangles indicate 3σ upper limits on dust mass for the galaxies not robustly detected in any AKARI FIR band. Blue and red symbols represent fast- and slow-rotating galaxies, respectively. The grey lines show the dust masses expected from the balance between dust production from stellar mass loss and dust destruction from sputtering in an X-ray plasma, for the two dust-destruction timescales indicated (see Sect. 3.3). |
Figure 2 demonstrates that there is no correlation between Mdust and M⋆ (linear correlation coefficient R = 0.09 and probability of deriving the observed R if the null hypothesis is true p = 0.35 for FIR-detected ETGs), indicating that stellar injection is not a significant source of dust in ETGs, as suggested by previous studies (e.g. Goudfrooij & de Jong 1995; Smith et al. 2012). We also performed a correlation analysis including the Mdust upper limits using the generalised Kendall’s τ test implemented in the Astronomy SURVival Analysys (ASURV) package (Isobe et al. 1986), finding p = 0.09. The above result therefore still holds when including non-FIR-detected ETGs. The figure also shows that some ETGs are well above the expected Mdust shown by the grey lines, similarly suggesting that these galaxies contain a large amount of dust that cannot be explained only by stars. These results call for a dust supply from external sources and/or efficient dust growth in the interstellar space of ETGs (e.g. Davis et al. 2011; Hirashita et al. 2015).
The mean value of Mdust/M⋆ is 10−4.12 ± 0.04 and 10−4.56 ± 0.09 for fast- and slow-rotating ETGs, respectively, while it is ∼10−3–10−2 for LTGs (e.g. Cortese et al. 2012), systematically larger than for ETGs and suggesting that ETGs in general are relatively poor in dust. Smith et al. (2012) showed that the dust content of galaxies becomes smaller toward earlier types along the Hubble sequence, but our results further suggest that fast-rotating ETGs are richer in dust than slow-rotating ETGs. This result is in agreement with the fact that fast-rotating ETGs tend to possess relatively more massive cold ISM and associated ongoing star formation (e.g. Young et al. 2011; Davis et al. 2014; Kokusho et al. 2017).
4. Discussion
4.1. Dust and cold gas
The left panel of Fig. 3 shows the global dust-to-gas mass ratios (Mdust/Mgas) plotted against the global cold gas masses (Mgas), defined as the sums of the molecular gas masses (MH2) and the global neutral hydrogen gas masses (MH I), where MH2 was estimated for all ATLAS3D ETGs by Young et al. (2011), who used a Galactic CO-to-H2 conversion factor (Dickman et al. 1986; Strong et al. 1988, 2004), and MH I was estimated for 166 ATLAS3D ETGs at a declination above 10° by Serra et al. (2012; except for four objects near the Virgo Cluster centre). The black dotted line shows the relation of our Galaxy (Mdust/Mgas = 0.0073; Draine et al. 2007) and the grey shaded region shows a factor-two spread around it, where most LTGs are found (Draine et al. 2007). This figure clearly shows that while the scatter is significant, the global dust-to-gas mass ratios of the ATLAS3D ETGs are generally lower than those of LTGs, suggesting that the cold dense ISM of ETGs is generally poor in dust.
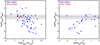 |
Fig. 3. Left: global dust-to-gas mass ratios vs. global cold gas masses (Mgas ≡ MH2 + MH I). Solid circles show galaxies robustly detected in at least one AKARI FIR band and in at least one of H2 and H I (but observed in both), while downward open triangles show 3σ total upper limits on dust mass for galaxies not robustly detected in any AKARI FIR band. Triangles pointing toward the upper-left show global cold gas upper limits (i.e. the sums of the 3σ upper limits on the global H I and H2 masses) and are formally all global dust-to-gas mass ratio lower limits. Triangles pointing toward the bottom-right show H2 masses only and are formally all global dust-to-gas mass ratio upper limits and global cold gas mass lower limits. Right: global dust-to-gas mass ratios vs. global H2-to-H I mass ratios. Solid circles show galaxies robustly detected in at least one AKARI FIR band and in both H2 and H I, while 3σ H2 (resp. H I) upper limits are shown as left-pointing (resp. right-pointing) open triangles. Triangles pointing toward the bottom-left (resp. bottom-right) show 3σ H2 (resp. H I) upper limits for galaxies not robustly detected in any AKARI FIR band and are formally all global dust-to-gas mass ratio upper limits. In both panels, blue and red symbols represent respectively fast- and slow-rotating galaxies, and the black dotted line and grey-shaded regions show respectively the relation of our Galaxy (Draine et al. 2007) and a factor-two spread around it. |
The right panel of Fig. 3 shows the relation between the global Mdust/Mgas and the global MH2/MH I for the ATLAS3D ETGs detected in at least one of H2 and H I. This clearly shows that galaxies with low global MH2/MH I also have low global Mdust/Mgas. However, molecular gas is generally concentrated in the central regions of ETGs (e.g. Alatalo et al. 2013), while H I gas tends to be extended beyond the stellar body (e.g. Oosterloo et al. 2010), meaning that one possible explanation of the trend observed is that an appreciable amount of dust is present beyond the IR photometric aperture we used. To test this possibility, we compared our AKARI aperture sizes with the H I extents of the 24 ATLAS3D ETGs whose H I morphology is defined as large disk in Serra et al. (2012), finding that the H I gas is more extended than our largest AKARI aperture in 23 out of these 24 ETGs. For each of these galaxies, we thus enlarged our aperture to cover the entire H I extent, and re-measured the FIR flux in the 90 μm band, the AKARI FIR band most sensitive to cold dust emission (Kokusho et al. 2017). Re-estimating Mdust with these new 90 μm fluxes, the trend in the right panel of Fig. 3 does not change, that is, galaxies with low global MH2/MH I still have low global Mdust/Mgas. This indicates that the H I envelopes of ETGs are likely to be intrinsically poor in dust. Such dust-deficient H I envelopes are found in LTGs (e.g. Ferguson et al. 1998), but our data suggest that they are also likely to be present in ETGs.
Of course, it is known that dust tightly correlates with molecular gas (the median value of Mdust/MH2 is 0.0075 for FIR- and CO-detected ETGs; see, e.g., Kokusho et al. 2017 for the ATLAS3D ETGs), indicating that dust and molecular gas are likely to coexist. The H I envelopes of ETGs may therefore be poor not only in dust, but also in molecular gas (i.e. ETG dust is related to H2 only and not H I). Conversely, when dust is closely associated with dense molecular clouds, the molecular gas may shield the dust from the hot X-ray plasma and thus prevent its destruction via sputtering (e.g. de Jong et al. 1990). This could explain why many ETGs still possess a lot of dust (see Sect. 3.3).
The left panel of Fig. 4 shows the relation between the central (as opposed to global) Mdust/Mgas and the central Mgas, where we adopted the MH I measurements of Young et al. (2014) from the central regions of the galaxies only (≈35″ × 45″) rather than total measurements. This figure reveals that most of our ETGs have a central Mdust/Mgas similar to those of LTGs, suggesting that their cold dense ISM is also similar to that of LTGs. As metallicity is an important factor governing star formation (via gas cooling), this result could naturally explain why ETGs have star formation efficiencies similar to those of LTGs (Shapiro et al. 2010; Kokusho et al. 2017).
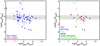 |
Fig. 4. As in the left panel of Fig. 3, but for the central dust-to-gas mass ratios vs. central cold gas masses, where the H I measurements are from the central regions of the galaxies only (≈35″ × 45″; Young et al. 2014). Data points are colour-coded according to the galaxies’ specific stellar angular momenta (fast- and slow-rotators; left) and CO morphologies (Alatalo et al. 2013; right). |
Nevertheless, the left panel of Fig. 4 also shows a few ETGs with central Mdust/Mgas significantly higher or lower than those of LTGs. Davis et al. (2015) argued that external gas accretion may cause the large Mdust/Mgas scatter, as ETGs are expected to generally have relatively high Mdust/Mgas due to secular metal enrichment. The gas accretion histories of the ATLAS3D ETGs were studied by Alatalo et al. (2013) through their CO distributions. They classified the CO morphologies of the 40 galaxies with interferometric (i.e. spatially-resolved) data into six categories: mildly disrupted, strongly disrupted, disc, bar+ring, ring, and spiral, suggesting that galaxies with disrupted CO probably acquired their molecular gas externally. We therefore colour-coded our ETGs by their CO morphology in the right panel of Fig. 4. Interestingly, this figure shows that the three galaxies with the lowest central Mdust/Mgas all have mildly disrupted CO, suggesting that more pristine external gas (e.g. from a lower mass accreted galaxy) may have diluted their Mdust/Mgas. Conversely, the three galaxies with the highest central Mdust/Mgas all have a CO ring (and the next two a CO disc), known to form naturally through secular processes (e.g. bar-driven; Buta & Combes 1996) with no necessity for external gas accretion. Metal enrichment could thus have proceeded naturally in those galaxies with a CO ring and/or disc. This scenario should however be verified by more sensitive, detailed, and numerous spatially resolved CO observations of ETGs.
4.2. Dust and diffuse X-ray plasma
The left panel of Fig. 5 shows the total dust masses (Mdust) plotted against the diffuse X-ray plasma total luminosities (LX) for the 42 ATLAS3D ETGs observed with Chandra by Su et al. (2015). We normalised both quantities by M⋆ as the diffuse X-ray plasma is supposed to be sustained by the gravitational potentials of the galaxies (and therefore LX should scale with M⋆; e.g. Forman et al. 1985). Slow-rotating ETGs tend to show lower Mdust/M⋆ than fast-rotating ETGs, especially at higher LX/M⋆. In contrast, fast-rotating ETGs show a clear correlation between Mdust/M⋆ and LX/M⋆ (R = 0.63 and p < 0.01 for FIR-detected fast-rotating ETGs). We again performed a correlation analysis including the Mdust/M⋆ upper limits using the generalised Kendall’s τ test (Isobe et al. 1986), finding p < 0.01. The above result therefore still holds when including non-FIR-detected fast-rotating ETGs. No correlation was found between Mdust and LX in the previous work of Smith et al. (2012) on nearby ETGs, where they normalised both quantities by the optical B-band luminosities and used LX measured either from Röntgen Satellite (ROSAT; O’Sullivan et al. 2001) or Chandra (nuclei; Pellegrini 2010). However, B band does not trace stellar masses as well as K band, and their X-ray luminosities are possibly contaminated by low-mass X-ray binaries and/or AGNs, which may hide a relation between Mdust and LX and explain the negative result.
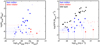 |
Fig. 5. Left: total dust masses vs. diffuse X-ray plasma luminosities, both normalised by the stellar masses, for the galaxies observed with Chandra by Su et al. (2015). Right: SFRs vs. diffuse X-ray plasma luminosities. The symbols are as in Fig. 2, but the black stars in the right panel show robustly detected late-type galaxies (Mineo et al. 2012). |
The right panel of Fig. 5 shows the relation between star formation rate (SFR) and LX for ATLAS3D ETGs, where the SFRs were derived from PAH emission by Kokusho et al. (2017). Also shown are the 21 LTGs for which Mineo et al. (2012) measured the diffuse X-ray plasma emission in the same manner as Su et al. (2015) for the ATLAS3D ETGs. The LTG SFRs were derived from a combination of UV and FIR emission (Mineo et al. 2012). The figure shows that our sample ETGs have systematically lower SFRs than LTGs, likely due to their smaller cold gas fractions, while they have star formation efficiencies similar to those of LTGs (see Sect. 4.1; e.g. Shapiro et al. 2010; Kokusho et al. 2017). The figure shows a tight correlation between the SFRs and LX in LTGs, where supernova remnants are likely the dominant X-ray source (Mineo et al. 2012). However, fast-rotating ETGs also show a correlation (R = 0.58 and p = 0.02 for FIR-detected fast-rotating ETGs), suggesting that their star formation activity also contributes to the X-rays. We again performed a correlation analysis including the SFR upper limits using the generalised Kendall’s τ test, finding p < 0.01. The above result therefore still holds when including non-FIR-detected fast-rotating ETGs. Assuming that Mdust traces the cold dense ISM, Mdust/M⋆ may then be indirectly related to LX/M⋆ via residual star formation activity.
Early-type galaxies are thought to have a bottom-heavy stellar initial mass function (e.g. van Dokkum & Conroy 2010; Cappellari et al. 2012; Kokusho et al. 2017), meaning that supernova explosions perhaps do not dominate their X-ray emission. Another possibility is young stellar objects (YSOs), that emit X-rays through magnetic reconnection in their stellar magnetospheres and circumstellar discs (e.g. Feigelson & Montmerle 1999). Using a median LX = 1029.4 erg s−1 from the Chamaeleon I cloud YSOs (Feigelson et al. 1993), and the area of the star-forming regions determined by Davis et al. (2014), we can estimate the number density of YSOs in the nine ETGs for which both X-ray and CO interferometric observations are available. Assuming spherical star-forming regions, the median value of the YSO number densities is estimated to be ≈3 pc−3, comparable to that of star-forming clouds in our Galaxy (≈1 pc−3; Heiderman et al. 2010). Hence the Mdust/M⋆ – LX/M⋆ correlation in fast-rotating ETGs can be produced by their current star formation activity, whether the X-rays originate from supernova explosions or YSOs or both.
Our results support the current preferred evolutionary scenario for ETGs (e.g. Cappellari et al. 2013a; Penoyre et al. 2017), whereby fast-rotating ETGs are thought to have evolved from LTGs through major or minor mergers that trigger intense star formation and associated bulge growth. Star formation is still ongoing in some of these galaxies, producing the Mdust/M⋆–LX/M⋆ correlation shown in Fig. 5. The diffuse X-ray plasma may have just started to grow through secular (gas heating by stellar motions and the gravitational potentials) or merger-induced (e.g. Monreal-Ibero et al. 2006) processes. Slow-rotating ETGs are thought to have evolved from fast-rotating ETGs via several (dry) major mergers, and to have grown their diffuse X-ray plasma for a long time (thus destroying their cold ISM). This scenario should however be verified by more sensitive and numerous observations of dust and X-rays in slow-rotating ETGs.
4.3. Galaxy environment and the cold ISM
The ICM of galaxy clusters is thought to strip the cold ISM of member galaxies through ram pressure and to prevent external cold gas accretion. In addition, when galaxies are virialised within clusters, strong galaxy interactions are less likely due to the high-velocity dispersion across galaxies (e.g. van Dokkum et al. 1999). Galaxy groups are an environment intermediate between field and clusters, and most galaxy groups are known to possess an X-ray emitting intra-group medium (IGM; e.g. O’Sullivan et al. 2017), that can heat and/or destroy the cold ISM of galaxies. In addition, as the velocity dispersion across galaxies in groups is smaller than that in clusters, galaxy mergers are more likely to occur in groups than in clusters (e.g. Alonso et al. 2012). To investigate such environmental effects on the cold ISM of ETGs, the top panels of Fig. 6 show the Mdust/M⋆ and global Mgas/M⋆ plotted against the local volume densities of our sample galaxies, measured in a sphere centred on each galaxy and containing the ten nearest galaxy neighbours (both ETGs and LTGs; ρ10, Cappellari et al. 2011b). The solid line (log(ρ10/Mpc3) = − 0.4) divides Virgo Cluster ETGs from group and field ETGs. Although there is much scatter, the figures show that Mdust/M⋆ is independent of galaxy environment while the global Mgas/M⋆ tends to be lower in Virgo Cluster ETGs than in group and field ETGs, supporting a scenario whereby the diffuse H I envelopes are more easily ram pressure-stripped than the dust (e.g. Cortese et al. 2012).
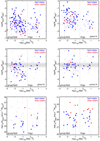 |
Fig. 6. Top-left: total dust-to-stellar mass ratios vs. local galaxy densities ρ10 (Cappellari et al. 2011b). The symbols are as in Fig. 2. Top-right: as in the top-left panel, but for the global gas-to-stellar mass ratios. Solid circles show galaxies detected in at least one of H2 and H I (but observed in both). Downward open triangles show global cold gas mass upper limits (i.e. the sums of the 3σ upper limits on the global H I and H2 masses). Upward triangles show H2 masses only and are formally all global gas-to-stellar mass ratio lower limits. Middle-left: global dust-to-gas mass ratios vs. ρ10. Solid circles show galaxies robustly detected in at least one AKARI FIR band and in at least one of H2 and H I (but observed in both). Downward open triangles show 3σ total dust mass upper limits for galaxies not robustly detected in any AKARI FIR band. Galaxies observed and detected in H2 only are also shown as downward triangles and are formally all global dust-to-gas mass ratio upper limits and global cold gas mass lower limits. Upward triangles show global cold gas mass upper limits and are formally all global dust-to-gas mass ratio lower limits. Middle-right: as in the middle-left panel, but for the central dust-to-gas mass ratios. Bottom-left: X-ray luminosity-to-dust mass ratios vs. ρ10. Solid circles show galaxies robustly detected in at least one AKARI FIR band. Upward open triangles show 3σ total dust mass upper limits for galaxies not robustly detected in any AKARI FIR band and are formally all X-ray luminosity-to-dust mass ratio lower limits. Bottom-right: as in the bottom-left panel, but for the X-ray luminosity-to-stellar mass ratios. In all panels, the solid line at log(ρ10/Mpc3) = − 0.4 divides Virgo Cluster galaxies from group and field galaxies. The horizontal lines and grey-shaded regions in the middle panels are as in Fig. 3. |
The middle panels of Fig. 6 show the global and central Mdust/Mgas plotted against ρ10, showing that the global Mdust/Mgas is higher in Virgo Cluster ETGs than in group and field ETGs while the central Mdust/Mgas is independent of galaxy environment. To better quantify this trend, we performed a K–S test on the global and central Mdust/Mgas, comparing Virgo Cluster ETGs and group and field ETGs and using only those objects detected in both dust and gas. The probability that the two samples are drawn from the same population (pKS) is 0.05 and 0.89 for the global and central Mdust/Mgas, respectively, again suggesting that the difference between Virgo Cluster ETGs and group and field ETGs is more significant for the global Mdust/Mgas than the central Mdust/Mgas. This indicates again that the central cold dense gas is more resilient against ram pressure stripping than the diffuse H I envelopes, as suggested by Young et al. (2011) to explain the CO observations of the ATLAS3D ETGs. Figure 6 also shows that the ETGs with the lowest Mdust/Mgas are in groups or the field, where removal of the cold ISM of galaxies rarely occurs and the Mdust/Mgas may be diluted by external gas accretion (see Sect. 4.1).
Since the cold dense ISM (H2) is more important than the diffuse atomic gas (H I) for star formation, the above result suggests that fast-rotating Virgo Cluster ETGs should form stars analogously to group and field ETGs. As shown in the bottom panels of Fig. 6, the LX/Mdust of fast-rotating ETGs (a proxy for the star formation efficiency) indeed does not correlate with ρ10, nor does LX/M⋆ (a proxy for the specific SFR), suggesting that cluster environments do not efficiently suppress star formation in ETGs.
The bottom-right panel of Fig. 6 also shows that slow-rotating ETGs generally have higher LX/M⋆ than fast-rotating ETGs. However, as slow-rotating ETGs tend to have little current star formation (e.g. Shapiro et al. 2010; Kokusho et al. 2017), their X-ray luminosities are probably poor tracers of their SFRs and instead likely reflect their substantial diffuse X-ray plasma.
To investigate potential environmental effects of groups on the cold ISM of ETGs, we divide our sample ETGs at log(ρ10/Mpc3)< − 0.4 into group or field ETGs using the galaxy group catalogue of Garcia (1993), which is complete to an apparent B-band magnitude of 14 and a recession velocity of 5500 km s−1. We find that 164 ETGs (out of 202) meet these criteria, and 107 of those belong to a galaxy group. Figure 7 is akin to Fig. 6, but for group and field ETGs only. The top panels show that group ETGs tend to have lower Mdust/M⋆ and Mgas/M⋆ than field ETGs, although the statistical significance of this is weak in both cases according to a K–S test using FIR- and gas-detected ETGs (pKS > 0.1). For Mdust/M⋆, we also perform Gehan’s generalised Wilcoxon test implemented in the ASURV package (Feigelson & Nelson 1985; Isobe et al. 1986), including non-FIR-detected ETGs. We find a marginal difference between group and field ETGs (pGW = 0.03), again suggesting that group ETGs provide a slightly harsher environment for dust, possibly due to denser X-ray plasma. However, it is difficult to support that suggestion from the bottom panels of Fig. 7, as the number of X-ray detected field ETGs is very small. This trend should therefore be verified with more sensitive and numerous observations of both dust and X-rays.
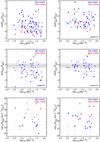 |
Fig. 7. As in Fig. 6, but for galaxies at log(ρ10/Mpc3) < − 0.4 only. Solid symbols show galaxies belonging to a group (Garcia 1993), while open symbols show those in the field. The optically brightest galaxies identified by Garcia (1993) are indicated with additional larger open circles. |
As Gehan’s generalised Wilcoxon test cannot handle upper and lower limits simultaneously, we cannot perform an analogous test for Mgas/M⋆, the global Mdust/Mgas or the central Mdust/Mgas.
In each galaxy group, Garcia (1993) also identified the optically brightest galaxy, likely to be located near the centre of its group. We indicate these with additional larger open circles in Fig. 7. The top panels show that the optically brightest group ETGs tend to have lower Mdust/M⋆ and Mgas/M⋆ than other group ETGs, suggesting that X-ray-emitting IGM is denser in group cores than at larger radii (as expected; e.g. Ebeling et al. 1994), and therefore heating and/or destruction of cold ISM may proceed more efficiently in galaxies located there. However, although the number of galaxies available is rather small, the bottom-right panel of Fig. 7 shows that the optically brightest ETGs have LX/M⋆ similar to those of other group ETGs. Again, the above trend requires verification with more sensitive and numerous dust and X-ray observations.
5. Conclusion
We have systematically investigated the properties of the dust in the cold and hot gas phases of the 260 ETGs from the ATLAS3D survey, primarily relying on AKARI measurements. We found that dust is prevalent in ETGs, with a detection rate of ∼45% in the FIR, roughly the same for fast- and slow-rotating ETGs. Using SED fits from our previous study, we derived the dust temperatures and masses of each ETG. Our sample ETGs tend to have higher cold dust temperatures Tcold than those of LTGs, in agreement with the suggestion that ETGs possess intense stellar radiation fields due to their dense populations of old stars. We found no correlation between the total dust masses Mdust and total stellar masses M⋆, implying that stellar mass loss is not a significant source of dust in ETGs. Fast-rotating ETGs have higher global dust-to-stellar mass ratios Mdust/M⋆ than slow-rotating ETGs, consistent with the fact that molecular gas and current star formation are preferentially associated with the former.
The global dust-to-gas mass ratios Mdust/Mgas of our sample ETGs tend to be smaller than those of LTGs, which we have argued is due to extended but dust-poor H I envelopes. When the H I masses MH I are estimated for the central regions of the ETGs only, however, our ETGs show central Mdust/Mgas similar to those of LTGs, suggesting that their central cold dense ISM has metallicities similar to those of LTGs. This result may naturally explain why ETGs have star formation efficiencies similar to those of LTGs. We also found some evidence that ETGs with disrupted CO morphologies have lower central Mdust/Mgas, suggesting that external gas accretion may dilute the Mdust/Mgas of some ETGs.
Adopting X-ray luminosities LX that comprise the diffuse X-ray gas only, we find that slow-rotating ETGs have lower Mdust/M⋆ than fast-rotating ETGs, especially at higher LX/M⋆. In contrast, fast-rotating ETGs show a correlation between Mdust/M⋆ and LX/M⋆, which may be caused by recent star formation activity through supernova explosions and/or YSOs. These results support currently favoured scenarios of ETG evolution: fast-rotating ETGs still harbour star formation, while slow-rotating ETGs have X-ray plasma-dominated ISM due to gas heating through mergers and/or secular processes (e.g. stellar motions and gravitational potentials).
We have also studied the effect of environment on the cold ISM of ETGs. Virgo Cluster ETGs have higher global Mdust/Mgas than group and field ETGs, suggesting that ram pressure stripping more easily affects the diffuse H I envelopes than the dust. Mdust/Mgas has no dependence on local galaxy density when the central Mdust/Mgas is used instead, nor does the LX/Mdust of fast-rotating ETGs. These results indicate that the central cold dense gas, essential for star formation in ETGs, is relatively resilient against ram pressure stripping. It is therefore possible that star formation in cluster ETGs is not easily suppressed.
Acknowledgments
We thank the referee for carefully reading our manuscript and giving us helpful comments. This research is based on observations with AKARI, a JAXA project with the participation of ESA.
References
- Agius, N. K., di Serego Alighieri, S., Viaene, S., et al. 2015, MNRAS, 451, 3815 [NASA ADS] [CrossRef] [Google Scholar]
- Alatalo, K., Davis, T. A., Bureau, M., et al. 2013, MNRAS, 432, 1796 [NASA ADS] [CrossRef] [Google Scholar]
- Alonso, S., Mesa, V., Padilla, N., & Lambas, D. G. 2012, A&A, 539, A46 [NASA ADS] [CrossRef] [EDP Sciences] [Google Scholar]
- Amblard, A., Riguccini, L., Temi, P., et al. 2014, ApJ, 783, 135 [NASA ADS] [CrossRef] [Google Scholar]
- Bacon, R., Copin, Y., Monnet, G., et al. 2001, MNRAS, 326, 23 [NASA ADS] [CrossRef] [Google Scholar]
- Boroson, B., Kim, D.-W., & Fabbiano, G. 2011, ApJ, 729, 12 [NASA ADS] [CrossRef] [Google Scholar]
- Bregman, J. N., Snider, B. A., Grego, L., & Cox, C. V. 1998, ApJ, 499, 670 [NASA ADS] [CrossRef] [Google Scholar]
- Buta, R., & Combes, F. 1996, Fundam. Cosmic Phys., 17, 95 [NASA ADS] [Google Scholar]
- Canizares, C. R., Fabbiano, G., & Trinchieri, G. 1987, ApJ, 312, 503 [NASA ADS] [CrossRef] [Google Scholar]
- Cappellari, M., Emsellem, E., Bacon, R., et al. 2007, MNRAS, 379, 418 [NASA ADS] [CrossRef] [Google Scholar]
- Cappellari, M., Emsellem, E., Krajnović, D., et al. 2011a, MNRAS, 413, 813 [NASA ADS] [CrossRef] [Google Scholar]
- Cappellari, M., Emsellem, E., Krajnović, D., et al. 2011b, MNRAS, 416, 1680 [NASA ADS] [CrossRef] [Google Scholar]
- Cappellari, M., McDermid, R. M., Alatalo, K., et al. 2012, Nature, 484, 485 [NASA ADS] [CrossRef] [Google Scholar]
- Cappellari, M., McDermid, R. M., Alatalo, K., et al. 2013a, MNRAS, 432, 1862 [NASA ADS] [CrossRef] [Google Scholar]
- Cappellari, M., Scott, N., Alatalo, K., et al. 2013b, MNRAS, 432, 1709 [NASA ADS] [CrossRef] [Google Scholar]
- Combes, F., Young, L. M., & Bureau, M. 2007, MNRAS, 377, 1795 [NASA ADS] [CrossRef] [Google Scholar]
- Cortese, L., Ciesla, L., Boselli, A., et al. 2012, A&A, 540, A52 [NASA ADS] [CrossRef] [EDP Sciences] [Google Scholar]
- Crocker, A. F., Bureau, M., Young, L. M., & Combes, F. 2011, MNRAS, 410, 1197 [NASA ADS] [CrossRef] [Google Scholar]
- Cutri, R. M., Wright, E. L., Conrow, T., et al. 2013, Explanatory Supplement to the AllWISE Data Release Products, Tech. Rep. [Google Scholar]
- Davis, T. A., Alatalo, K., Sarzi, M., et al. 2011, MNRAS, 417, 882 [NASA ADS] [CrossRef] [Google Scholar]
- Davis, T. A., Young, L. M., Crocker, A. F., et al. 2014, MNRAS, 444, 3427 [NASA ADS] [CrossRef] [Google Scholar]
- Davis, T. A., Rowlands, K., Allison, J. R., et al. 2015, MNRAS, 449, 3503 [NASA ADS] [CrossRef] [Google Scholar]
- de Jong, T., Norgaard-Nielsen, H. U., Jorgensen, H. E., & Hansen, L. 1990, A&A, 232, 317 [NASA ADS] [Google Scholar]
- di Serego Alighieri, S., Gavazzi, G., Giovanardi, C., et al. 2007, A&A, 474, 851 [NASA ADS] [CrossRef] [EDP Sciences] [Google Scholar]
- di Serego Alighieri, S., Bianchi, S., Pappalardo, C., et al. 2013, A&A, 552, A8 [NASA ADS] [CrossRef] [EDP Sciences] [Google Scholar]
- Dickman, R. L., Snell, R. L., & Schloerb, F. P. 1986, ApJ, 309, 326 [NASA ADS] [CrossRef] [Google Scholar]
- Doi, Y., Takita, S., Ootsubo, T., et al. 2015, PASJ, 67, 50 [NASA ADS] [Google Scholar]
- Draine, B. T. 2003, ARA&A, 41, 241 [NASA ADS] [CrossRef] [Google Scholar]
- Draine, B. T., & Salpeter, E. E. 1979, ApJ, 231, 77 [NASA ADS] [CrossRef] [Google Scholar]
- Draine, B. T., Dale, D. A., Bendo, G., et al. 2007, ApJ, 663, 866 [NASA ADS] [CrossRef] [Google Scholar]
- Ebeling, H., Voges, W., & Boehringer, H. 1994, ApJ, 436, 44 [NASA ADS] [CrossRef] [Google Scholar]
- Emsellem, E., Cappellari, M., Krajnović, D., et al. 2007, MNRAS, 379, 401 [NASA ADS] [CrossRef] [Google Scholar]
- Emsellem, E., Cappellari, M., Krajnović, D., et al. 2011, MNRAS, 414, 888 [NASA ADS] [CrossRef] [Google Scholar]
- Feigelson, E. D., & Montmerle, T. 1999, ARA&A, 37, 363 [NASA ADS] [CrossRef] [Google Scholar]
- Feigelson, E. D., & Nelson, P. I. 1985, ApJ, 293, 192 [NASA ADS] [CrossRef] [Google Scholar]
- Feigelson, E. D., Casanova, S., Montmerle, T., & Guibert, J. 1993, ApJ, 416, 623 [NASA ADS] [CrossRef] [Google Scholar]
- Ferguson, A. M. N., Gallagher, J. S., & Wyse, R. F. G. 1998, AJ, 116, 673 [NASA ADS] [CrossRef] [Google Scholar]
- Forman, W., Schwarz, J., Jones, C., Liller, W., & Fabian, A. C. 1979, ApJ, 234, L27 [NASA ADS] [CrossRef] [Google Scholar]
- Forman, W., Jones, C., & Tucker, W. 1985, ApJ, 293, 102 [NASA ADS] [CrossRef] [Google Scholar]
- Garcia, A. M. 1993, A&AS, 100, 47 [NASA ADS] [Google Scholar]
- Goudfrooij, P., & de Jong, T. 1995, A&A, 298, 784 [NASA ADS] [Google Scholar]
- Goulding, A. D., Greene, J. E., Ma, C.-P., et al. 2016, ApJ, 826, 167 [NASA ADS] [CrossRef] [Google Scholar]
- Griffith, R. L., Wright, J. T., Maldonado, J., et al. 2015, ApJS, 217, 25 [NASA ADS] [CrossRef] [Google Scholar]
- Heiderman, A., Evans, II., N. J., Allen, L. E., Huard, T., & Heyer, M. 2010, ApJ, 723, 1019 [NASA ADS] [CrossRef] [Google Scholar]
- Hirashita, H., Nozawa, T., Villaume, A., & Srinivasan, S. 2015, MNRAS, 454, 1620 [NASA ADS] [CrossRef] [Google Scholar]
- Ishihara, D., Onaka, T., Kataza, H., et al. 2010, A&A, 514, A1 [NASA ADS] [CrossRef] [EDP Sciences] [Google Scholar]
- Isobe, T., Feigelson, E. D., & Nelson, P. I. 1986, ApJ, 306, 490 [NASA ADS] [CrossRef] [Google Scholar]
- Kaneda, H., Ishihara, D., Onaka, T., et al. 2011, PASJ, 63, 601 [NASA ADS] [CrossRef] [Google Scholar]
- Kim, D.-W., & Fabbiano, G. 2015, ApJ, 812, 127 [NASA ADS] [CrossRef] [Google Scholar]
- Knapp, G. R., & Rupen, M. P. 1996, ApJ, 460, 271 [NASA ADS] [CrossRef] [Google Scholar]
- Knapp, G. R., Turner, E. L., & Cunniffe, P. E. 1985, AJ, 90, 454 [NASA ADS] [CrossRef] [Google Scholar]
- Knapp, G. R., Guhathakurta, P., Kim, D.-W., & Jura, M. A. 1989, ApJS, 70, 329 [NASA ADS] [CrossRef] [Google Scholar]
- Knapp, G. R., Gunn, J. E., & Wynn-Williams, C. G. 1992, ApJ, 399, 76 [NASA ADS] [CrossRef] [Google Scholar]
- Kokusho, T., Kaneda, H., Bureau, M., et al. 2017, A&A, 605, A74 [NASA ADS] [CrossRef] [EDP Sciences] [Google Scholar]
- Lagos, C. d. P., Davis, T. A., Lacey, C. G., et al. 2014, MNRAS, 443, 1002 [NASA ADS] [CrossRef] [Google Scholar]
- Martini, P., Dicken, D., & Storchi-Bergmann, T. 2013, ApJ, 766, 121 [NASA ADS] [CrossRef] [Google Scholar]
- Mathews, W. G., & Loewenstein, M. 1986, ApJ, 306, L7 [NASA ADS] [CrossRef] [Google Scholar]
- Mineo, S., Gilfanov, M., & Sunyaev, R. 2012, MNRAS, 426, 1870 [NASA ADS] [CrossRef] [Google Scholar]
- Monreal-Ibero, A., Arribas, S., & Colina, L. 2006, ApJ, 637, 138 [NASA ADS] [CrossRef] [Google Scholar]
- Murakami, H., Baba, H., Barthel, P., et al. 2007, PASJ, 59, S369 [NASA ADS] [CrossRef] [MathSciNet] [Google Scholar]
- Oosterloo, T., Morganti, R., Crocker, A., et al. 2010, MNRAS, 409, 500 [Google Scholar]
- O’Sullivan, E., Forbes, D. A., & Ponman, T. J. 2001, MNRAS, 328, 461 [NASA ADS] [CrossRef] [Google Scholar]
- O’Sullivan, E., Ponman, T. J., Kolokythas, K., et al. 2017, MNRAS, 472, 1482 [NASA ADS] [CrossRef] [Google Scholar]
- Pellegrini, S. 2010, ApJ, 717, 640 [NASA ADS] [CrossRef] [Google Scholar]
- Penoyre, Z., Moster, B. P., Sijacki, D., & Genel, S. 2017, MNRAS, 468, 3883 [NASA ADS] [CrossRef] [Google Scholar]
- Sarzi, M., Falcón-Barroso, J., Davies, R. L., et al. 2006, MNRAS, 366, 1151 [NASA ADS] [CrossRef] [Google Scholar]
- Sarzi, M., Alatalo, K., Blitz, L., et al. 2013, MNRAS, 432, 1845 [NASA ADS] [CrossRef] [Google Scholar]
- Serra, P., Oosterloo, T., Morganti, R., et al. 2012, MNRAS, 422, 1835 [NASA ADS] [CrossRef] [Google Scholar]
- Shapiro, K. L., Falcón-Barroso, J., van de Ven, G., et al. 2010, MNRAS, 402, 2140 [NASA ADS] [CrossRef] [Google Scholar]
- Skrutskie, M. F., Cutri, R. M., Stiening, R., et al. 2006, AJ, 131, 1163 [NASA ADS] [CrossRef] [Google Scholar]
- Smith, M. W. L., Gomez, H. L., Eales, S. A., et al. 2012, ApJ, 748, 123 [NASA ADS] [CrossRef] [Google Scholar]
- Strong, A. W., Bloemen, J. B. G. M., Dame, T. M., et al. 1988, A&A, 207, 1 [NASA ADS] [Google Scholar]
- Strong, A. W., Moskalenko, I. V., Reimer, O., Digel, S., & Diehl, R. 2004, A&A, 422, L47 [NASA ADS] [CrossRef] [EDP Sciences] [Google Scholar]
- Su, Y., Irwin, J. A., White, III., R. E., & Cooper, M. C. 2015, ApJ, 806, 156 [NASA ADS] [CrossRef] [Google Scholar]
- Takita, S., Doi, Y., Ootsubo, T., et al. 2015, PASJ, 67, 51 [NASA ADS] [CrossRef] [Google Scholar]
- Temi, P., Brighenti, F., Mathews, W. G., & Bregman, J. D. 2004, ApJS, 151, 237 [NASA ADS] [CrossRef] [Google Scholar]
- Temi, P., Brighenti, F., & Mathews, W. G. 2007, ApJ, 660, 1215 [NASA ADS] [CrossRef] [Google Scholar]
- Temi, P., Brighenti, F., & Mathews, W. G. 2009, ApJ, 695, 1 [NASA ADS] [CrossRef] [Google Scholar]
- van Dokkum, P. G., & Conroy, C. 2010, Nature, 468, 940 [NASA ADS] [CrossRef] [Google Scholar]
- van Dokkum, P. G., Franx, M., Fabricant, D., Kelson, D. D., & Illingworth, G. D. 1999, ApJ, 520, L95 [NASA ADS] [CrossRef] [Google Scholar]
- Wardle, M., & Knapp, G. R. 1986, AJ, 91, 23 [NASA ADS] [CrossRef] [Google Scholar]
- Young, L. M., Bureau, M., Davis, T. A., et al. 2011, MNRAS, 414, 940 [NASA ADS] [CrossRef] [Google Scholar]
- Young, L. M., Scott, N., Serra, P., et al. 2014, MNRAS, 444, 3408 [NASA ADS] [CrossRef] [Google Scholar]
Appendix A: Combined measurements for the ATLAS3D galaxies
Combined measurements for the ATLAS3D galaxies.
All Tables
All Figures
|
Fig. 1. Top: histograms of the warm and cold dust temperatures for the 68 ATLAS3D ETGs robustly detected in two or three of the three AKARI FIR bands. Blue (left vertical axes) and red (right vertical axes) represent fast- and slow-rotating galaxies, respectively. Bottom: as for the top panels, but for the warm and cold dust masses of the 111 ATLAS3D ETGs robustly detected in at least one AKARI FIR band. |
| In the text | |
|
Fig. 2. Total dust masses vs. stellar masses. Solid circles indicate galaxies robustly detected in at least one AKARI FIR band. Downward open triangles indicate 3σ upper limits on dust mass for the galaxies not robustly detected in any AKARI FIR band. Blue and red symbols represent fast- and slow-rotating galaxies, respectively. The grey lines show the dust masses expected from the balance between dust production from stellar mass loss and dust destruction from sputtering in an X-ray plasma, for the two dust-destruction timescales indicated (see Sect. 3.3). |
| In the text | |
|
Fig. 3. Left: global dust-to-gas mass ratios vs. global cold gas masses (Mgas ≡ MH2 + MH I). Solid circles show galaxies robustly detected in at least one AKARI FIR band and in at least one of H2 and H I (but observed in both), while downward open triangles show 3σ total upper limits on dust mass for galaxies not robustly detected in any AKARI FIR band. Triangles pointing toward the upper-left show global cold gas upper limits (i.e. the sums of the 3σ upper limits on the global H I and H2 masses) and are formally all global dust-to-gas mass ratio lower limits. Triangles pointing toward the bottom-right show H2 masses only and are formally all global dust-to-gas mass ratio upper limits and global cold gas mass lower limits. Right: global dust-to-gas mass ratios vs. global H2-to-H I mass ratios. Solid circles show galaxies robustly detected in at least one AKARI FIR band and in both H2 and H I, while 3σ H2 (resp. H I) upper limits are shown as left-pointing (resp. right-pointing) open triangles. Triangles pointing toward the bottom-left (resp. bottom-right) show 3σ H2 (resp. H I) upper limits for galaxies not robustly detected in any AKARI FIR band and are formally all global dust-to-gas mass ratio upper limits. In both panels, blue and red symbols represent respectively fast- and slow-rotating galaxies, and the black dotted line and grey-shaded regions show respectively the relation of our Galaxy (Draine et al. 2007) and a factor-two spread around it. |
| In the text | |
|
Fig. 4. As in the left panel of Fig. 3, but for the central dust-to-gas mass ratios vs. central cold gas masses, where the H I measurements are from the central regions of the galaxies only (≈35″ × 45″; Young et al. 2014). Data points are colour-coded according to the galaxies’ specific stellar angular momenta (fast- and slow-rotators; left) and CO morphologies (Alatalo et al. 2013; right). |
| In the text | |
|
Fig. 5. Left: total dust masses vs. diffuse X-ray plasma luminosities, both normalised by the stellar masses, for the galaxies observed with Chandra by Su et al. (2015). Right: SFRs vs. diffuse X-ray plasma luminosities. The symbols are as in Fig. 2, but the black stars in the right panel show robustly detected late-type galaxies (Mineo et al. 2012). |
| In the text | |
|
Fig. 6. Top-left: total dust-to-stellar mass ratios vs. local galaxy densities ρ10 (Cappellari et al. 2011b). The symbols are as in Fig. 2. Top-right: as in the top-left panel, but for the global gas-to-stellar mass ratios. Solid circles show galaxies detected in at least one of H2 and H I (but observed in both). Downward open triangles show global cold gas mass upper limits (i.e. the sums of the 3σ upper limits on the global H I and H2 masses). Upward triangles show H2 masses only and are formally all global gas-to-stellar mass ratio lower limits. Middle-left: global dust-to-gas mass ratios vs. ρ10. Solid circles show galaxies robustly detected in at least one AKARI FIR band and in at least one of H2 and H I (but observed in both). Downward open triangles show 3σ total dust mass upper limits for galaxies not robustly detected in any AKARI FIR band. Galaxies observed and detected in H2 only are also shown as downward triangles and are formally all global dust-to-gas mass ratio upper limits and global cold gas mass lower limits. Upward triangles show global cold gas mass upper limits and are formally all global dust-to-gas mass ratio lower limits. Middle-right: as in the middle-left panel, but for the central dust-to-gas mass ratios. Bottom-left: X-ray luminosity-to-dust mass ratios vs. ρ10. Solid circles show galaxies robustly detected in at least one AKARI FIR band. Upward open triangles show 3σ total dust mass upper limits for galaxies not robustly detected in any AKARI FIR band and are formally all X-ray luminosity-to-dust mass ratio lower limits. Bottom-right: as in the bottom-left panel, but for the X-ray luminosity-to-stellar mass ratios. In all panels, the solid line at log(ρ10/Mpc3) = − 0.4 divides Virgo Cluster galaxies from group and field galaxies. The horizontal lines and grey-shaded regions in the middle panels are as in Fig. 3. |
| In the text | |
|
Fig. 7. As in Fig. 6, but for galaxies at log(ρ10/Mpc3) < − 0.4 only. Solid symbols show galaxies belonging to a group (Garcia 1993), while open symbols show those in the field. The optically brightest galaxies identified by Garcia (1993) are indicated with additional larger open circles. |
| In the text | |
Current usage metrics show cumulative count of Article Views (full-text article views including HTML views, PDF and ePub downloads, according to the available data) and Abstracts Views on Vision4Press platform.
Data correspond to usage on the plateform after 2015. The current usage metrics is available 48-96 hours after online publication and is updated daily on week days.
Initial download of the metrics may take a while.