Fig. 2.
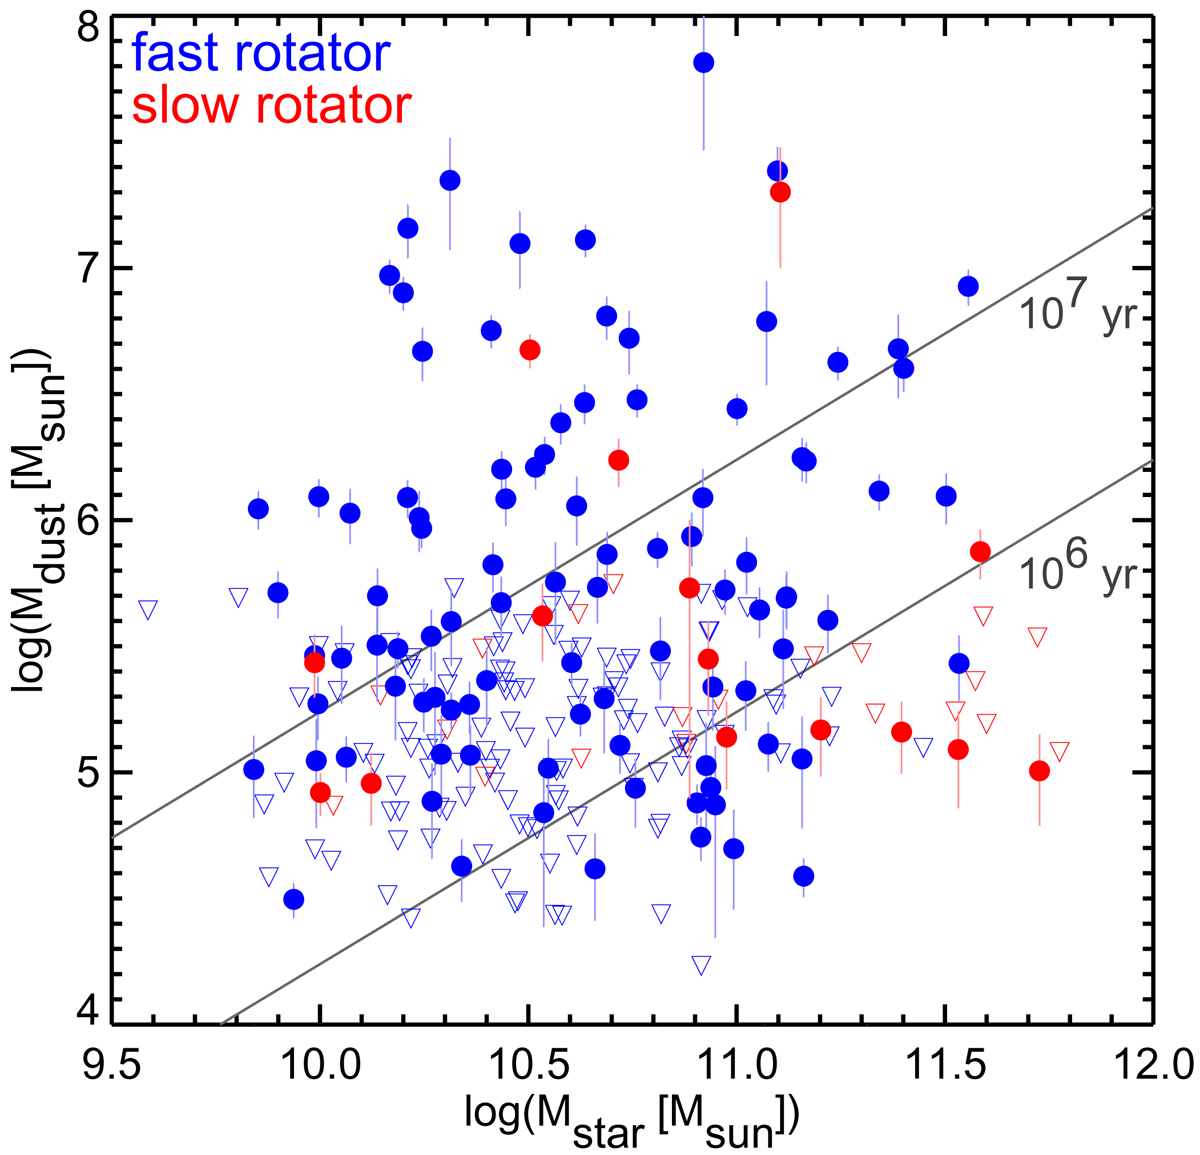
Total dust masses vs. stellar masses. Solid circles indicate galaxies robustly detected in at least one AKARI FIR band. Downward open triangles indicate 3σ upper limits on dust mass for the galaxies not robustly detected in any AKARI FIR band. Blue and red symbols represent fast- and slow-rotating galaxies, respectively. The grey lines show the dust masses expected from the balance between dust production from stellar mass loss and dust destruction from sputtering in an X-ray plasma, for the two dust-destruction timescales indicated (see Sect. 3.3).
Current usage metrics show cumulative count of Article Views (full-text article views including HTML views, PDF and ePub downloads, according to the available data) and Abstracts Views on Vision4Press platform.
Data correspond to usage on the plateform after 2015. The current usage metrics is available 48-96 hours after online publication and is updated daily on week days.
Initial download of the metrics may take a while.