Fig. 6.
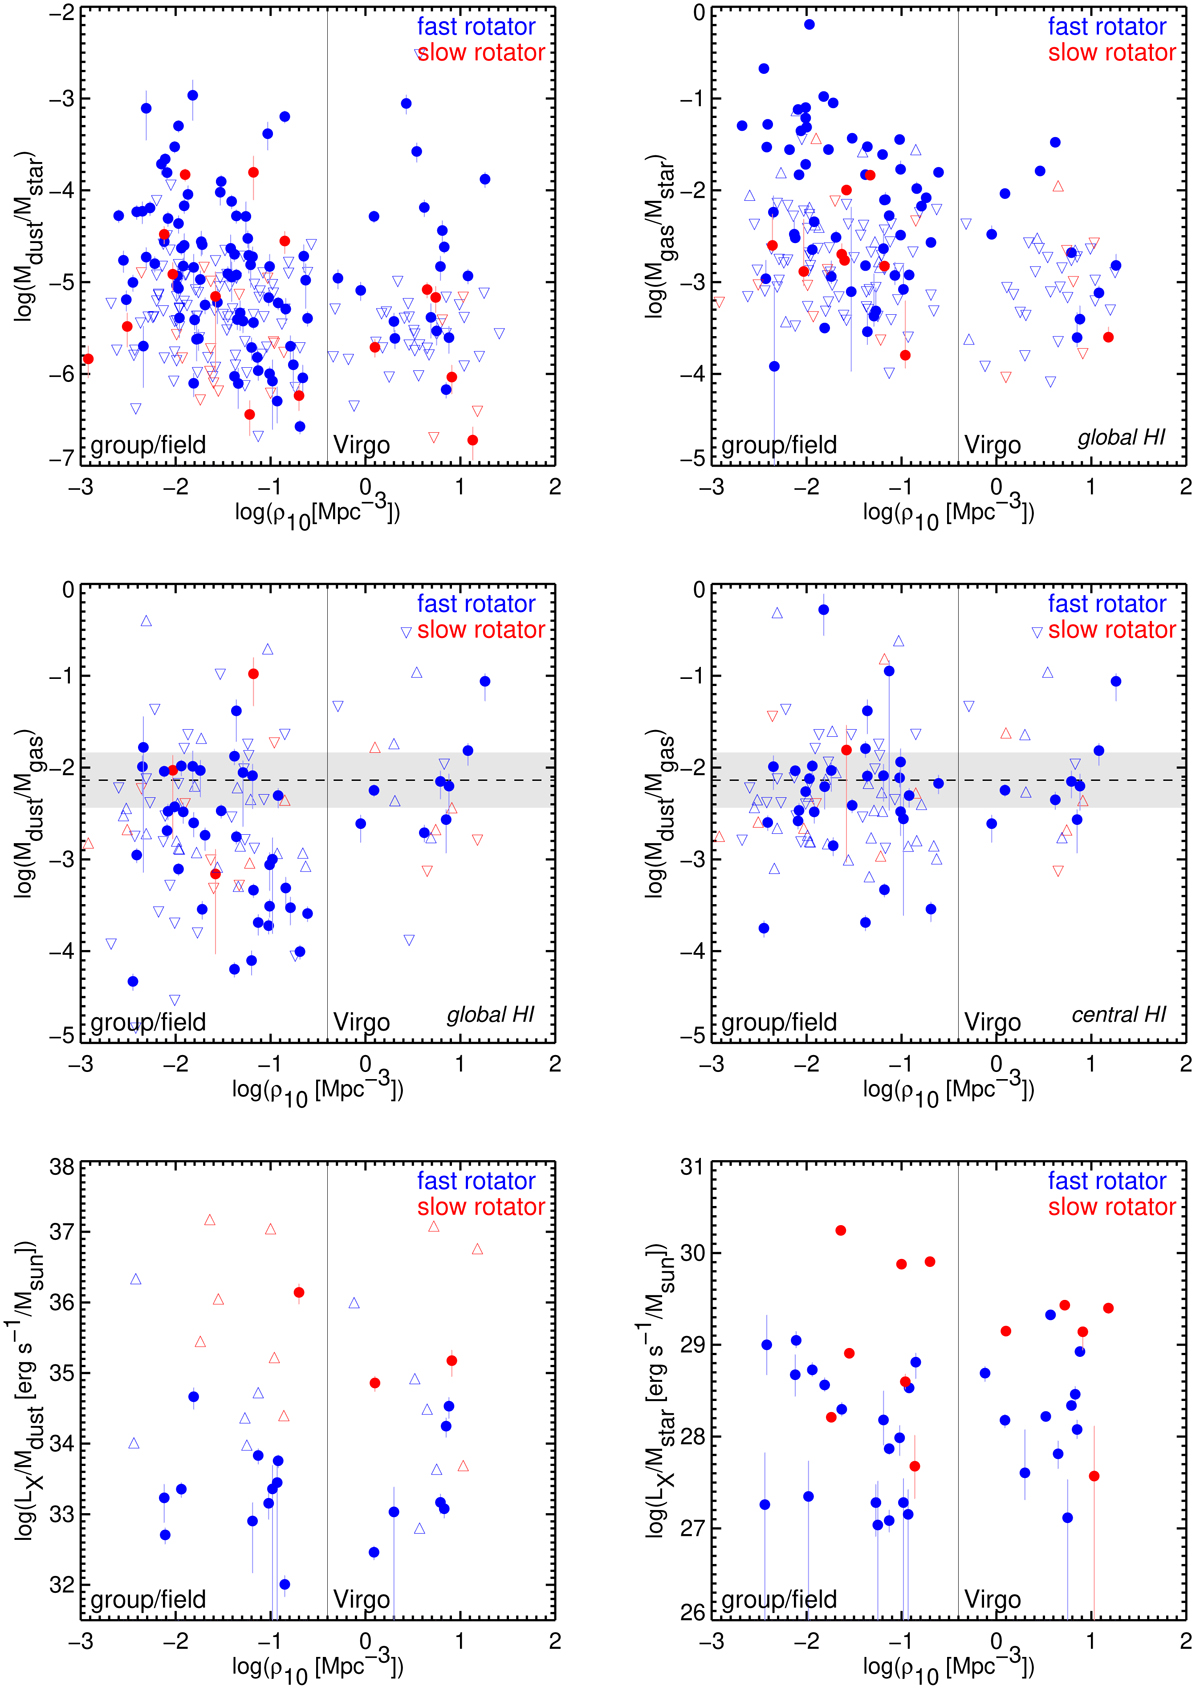
Top-left: total dust-to-stellar mass ratios vs. local galaxy densities ρ10 (Cappellari et al. 2011b). The symbols are as in Fig. 2. Top-right: as in the top-left panel, but for the global gas-to-stellar mass ratios. Solid circles show galaxies detected in at least one of H2 and H I (but observed in both). Downward open triangles show global cold gas mass upper limits (i.e. the sums of the 3σ upper limits on the global H I and H2 masses). Upward triangles show H2 masses only and are formally all global gas-to-stellar mass ratio lower limits. Middle-left: global dust-to-gas mass ratios vs. ρ10. Solid circles show galaxies robustly detected in at least one AKARI FIR band and in at least one of H2 and H I (but observed in both). Downward open triangles show 3σ total dust mass upper limits for galaxies not robustly detected in any AKARI FIR band. Galaxies observed and detected in H2 only are also shown as downward triangles and are formally all global dust-to-gas mass ratio upper limits and global cold gas mass lower limits. Upward triangles show global cold gas mass upper limits and are formally all global dust-to-gas mass ratio lower limits. Middle-right: as in the middle-left panel, but for the central dust-to-gas mass ratios. Bottom-left: X-ray luminosity-to-dust mass ratios vs. ρ10. Solid circles show galaxies robustly detected in at least one AKARI FIR band. Upward open triangles show 3σ total dust mass upper limits for galaxies not robustly detected in any AKARI FIR band and are formally all X-ray luminosity-to-dust mass ratio lower limits. Bottom-right: as in the bottom-left panel, but for the X-ray luminosity-to-stellar mass ratios. In all panels, the solid line at log(ρ10/Mpc3) = − 0.4 divides Virgo Cluster galaxies from group and field galaxies. The horizontal lines and grey-shaded regions in the middle panels are as in Fig. 3.
Current usage metrics show cumulative count of Article Views (full-text article views including HTML views, PDF and ePub downloads, according to the available data) and Abstracts Views on Vision4Press platform.
Data correspond to usage on the plateform after 2015. The current usage metrics is available 48-96 hours after online publication and is updated daily on week days.
Initial download of the metrics may take a while.