Fig. 4.
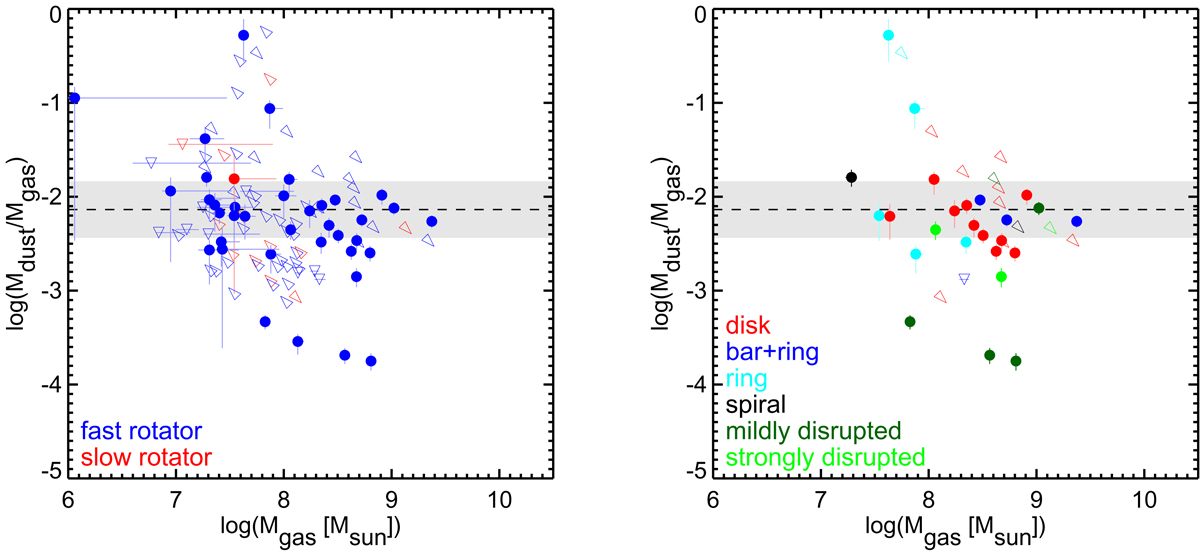
As in the left panel of Fig. 3, but for the central dust-to-gas mass ratios vs. central cold gas masses, where the H I measurements are from the central regions of the galaxies only (≈35″ × 45″; Young et al. 2014). Data points are colour-coded according to the galaxies’ specific stellar angular momenta (fast- and slow-rotators; left) and CO morphologies (Alatalo et al. 2013; right).
Current usage metrics show cumulative count of Article Views (full-text article views including HTML views, PDF and ePub downloads, according to the available data) and Abstracts Views on Vision4Press platform.
Data correspond to usage on the plateform after 2015. The current usage metrics is available 48-96 hours after online publication and is updated daily on week days.
Initial download of the metrics may take a while.