Fig. 3.
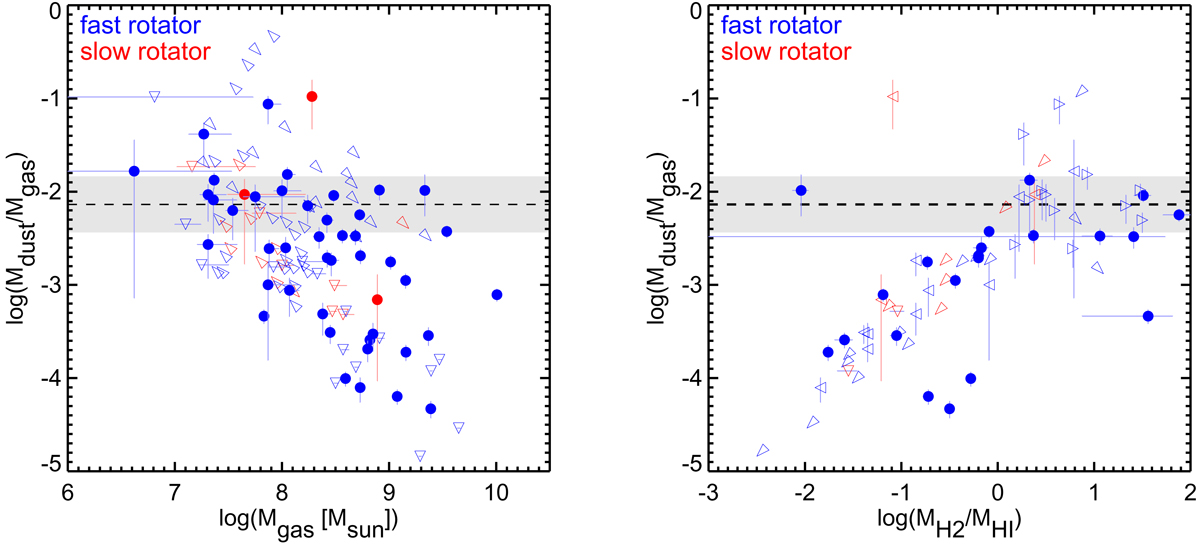
Left: global dust-to-gas mass ratios vs. global cold gas masses (Mgas ≡ MH2 + MH I). Solid circles show galaxies robustly detected in at least one AKARI FIR band and in at least one of H2 and H I (but observed in both), while downward open triangles show 3σ total upper limits on dust mass for galaxies not robustly detected in any AKARI FIR band. Triangles pointing toward the upper-left show global cold gas upper limits (i.e. the sums of the 3σ upper limits on the global H I and H2 masses) and are formally all global dust-to-gas mass ratio lower limits. Triangles pointing toward the bottom-right show H2 masses only and are formally all global dust-to-gas mass ratio upper limits and global cold gas mass lower limits. Right: global dust-to-gas mass ratios vs. global H2-to-H I mass ratios. Solid circles show galaxies robustly detected in at least one AKARI FIR band and in both H2 and H I, while 3σ H2 (resp. H I) upper limits are shown as left-pointing (resp. right-pointing) open triangles. Triangles pointing toward the bottom-left (resp. bottom-right) show 3σ H2 (resp. H I) upper limits for galaxies not robustly detected in any AKARI FIR band and are formally all global dust-to-gas mass ratio upper limits. In both panels, blue and red symbols represent respectively fast- and slow-rotating galaxies, and the black dotted line and grey-shaded regions show respectively the relation of our Galaxy (Draine et al. 2007) and a factor-two spread around it.
Current usage metrics show cumulative count of Article Views (full-text article views including HTML views, PDF and ePub downloads, according to the available data) and Abstracts Views on Vision4Press platform.
Data correspond to usage on the plateform after 2015. The current usage metrics is available 48-96 hours after online publication and is updated daily on week days.
Initial download of the metrics may take a while.