| Issue |
A&A
Volume 621, January 2019
|
|
|---|---|---|
| Article Number | L5 | |
| Number of page(s) | 6 | |
| Section | Letters to the Editor | |
| DOI | https://doi.org/10.1051/0004-6361/201834669 | |
| Published online | 04 January 2019 | |
Letter to the Editor
MUSE-AO view of the starburst–AGN connection: NGC 7130⋆
1
Instituto de Astrofísica de Canarias, 38205 La Laguna, Tenerife, Spain
2
Departamento de Astrofísica, Universidad de La Laguna, 38205 La Laguna, Tenerife, Spain
3
Astrophysics Research Institute, Liverpool John Moores University, IC2, Liverpool Science Park, 146 Brownlow Hill, Liverpool L3 5RF, UK
4
University of Oulu, Astronomy Research Unit, PO Box 3000, 90014 Oulu, Finland
e-mail: This email address is being protected from spambots. You need JavaScript enabled to view it.
5
Caltech-IPAC, MC 314-6, 1200 E California Blvd, Pasadena, CA 91125, USA
Received:
16
November
2018
Accepted:
3
December
2018
Abstract
We present the discovery of a small kinematically decoupled core of 0.″2 (60 pc) in radius as well as an outflow jet in the archetypical AGN–starburst “composite” galaxy NGC 7130 from integral field data obtained with the adaptive optics-assisted MUSE-NFM instrument on the VLT. Correcting the already good natural seeing at the time of our science verification observations with the four-laser GALACSI AO system, we reach an unprecedented spatial resolution at optical wavelengths of around 0.″15. We confirm the existence of star-forming knots arranged in a ring of 0.″58 (185 pc) in radius around the nucleus, previously observed from UV and optical Hubble Space Telescope and CO(6-5) ALMA imaging. We determine the position of the nucleus as the location of a peak in gas velocity dispersion. A plume of material extends towards the NE from the nucleus until at least the edge of our field of view at 2″ (640 pc) radius which we interpret as an outflow jet originating in the AGN. The plume is not visible morphologically, but is clearly characterised in our data by emission-line ratios characteristic of AGN emission, enhanced gas velocity dispersion, and distinct non-circular gas velocities. Its orientation is roughly perpendicular to the line of nodes of the rotating host galaxy disc. A circumnuclear area of positive and negative velocities of 0.″2 in radius indicates a tiny inner disc, which can only be seen after combining the integral field spectroscopic capabilities of MUSE with adaptive optics.
Key words: galaxies: active / galaxies: individual: NGC 7130 / galaxies: ISM / galaxies: jets / galaxies: nuclei / galaxies: Seyfert
Based on observations made at the European Southern Observatory using the Very Large Telescope under programme 60.A-9493(A).
© ESO 2019
1. Introduction
The accretion activity of supermassive black holes (SMBHs) is known to be closely related to the evolution of galaxies, and the mass of the SMBH scales with key galaxy parameters such as its velocity dispersion or the stellar mass and the luminosity of the bulge (see review by Kormendy & Ho 2013). These relationships may result from feedback from accretion onto a SMBH conditioning the evolution of the host galaxy, and/or from increased cold gas availability, which may simultaneously increase the star formation (SF) and the active galactic nucleus (AGN) activity.
A well-documented complication in the fuelling process of both AGN and circumnuclear starbursts is that the cold gaseous fuel, while plentiful in the body of the host galaxy, must lose by far most of its angular momentum before it can reach the central starburst and/or AGN (e.g., Begelman et al. 1984; Shlosman et al. 1989). Once it does, for instance under the influence of non-axisymmetries in the host galaxy induced by bars or past or present interactions, the availability of gaseous fuel can lead to both starburst and AGN activity, which has been referred to as “composite” if occurring simultaneously. Studying the gas physics, stellar properties, and kinematics of such composite AGN/starburst galaxies in detail can therefore provide fundamental clues on gas transport in, and the evolution of, galaxies, as well as the physics of AGN and circumnuclear starbursts.
One of the best-known examples of such composite AGN-starburst galaxies is the luminous infrared galaxy (LIRG) NGC 7130 (also known as IC 5135), a peculiar Sa (de Vaucouleurs et al. 1991) galaxy at a distance of 65.5 Mpc (so 1″ corresponds to 318 pc). NGC 7130 hosts a Seyfert 1.9 AGN nucleus (Véron-Cetty & Véron 2006) as well as a powerful compact circumnuclear starburst (Phillips et al. 1983).
In this Letter, we present the first results from the science verification phase of MUSE-NFM (narrow field mode), which uses the adaptive optics (AO) system GALACSI with four laser guide stars to feed MUSE.
2. Observations and data reduction
2.1. MUSE NFM AO
We used the MUSE integral field spectrograph on the VLT in its newly commissioned NFM in conjunction with GALACSI, an AO system developed to increase the performance of MUSE. GALACSI employs four sodium laser guide stars, the deformable secondary mirror on the VLT’s UT4, and an infrared low-order sensor to provide a near-diffraction-limited resolution at visible wavelengths (i.e., Strehl ratio >5% at 650 nm for  seeing). In addition to the four laser guide stars, we used the Seyfert nucleus of NGC 7130 as a natural guide star to measure the remaining atmospheric tip-tilt, defocus, and astigmatisms. Further technical details of MUSE with AO are given by Stuik et al. (2006).
In its NFM, MUSE covers a field of view (FOV) of  by
by  with a sampling of
  per pixel. Our observations were taken for proposal number 60.A-9493(A) (PI M. Seidel) during the nights of 2018 Sept 15, 16, and 18. The natural seeing on all three nights was below 1″, but it was below
  only on Sept 18. Only on that final night did the AO system deliver well enough; the spatial resolution from all other observations is poorer than
  compared to the excellent
  on Sept 18. We obtained a total of ten sets of 600-s exposures on-source interlaced with 180-s exposures of offset sky, but only two sets during the good-seeing period on Sept 18.
The resulting data were reduced using v. 2.5.2 of the MUSE pipeline (Weilbacher et al. 2012) under the ESO REFLEX interface (Freudling et al. 2013) with the default parameters1. The resulting datacubes were then manually aligned and the shifts were fed into muse_exp_combine to create a final combined datacube. We only combined the two datacubes with spatial resolution below  .
.
To extract information from the spectra we followed the procedure in Comerón et al. (2019), based on that used for MaNGA (M. Cappellari, priv. comm.). To extract the data we considered only spaxels with S/N > 0.5 and produced two spatial Voronoi binnings using the software by Cappellari & Copin (2003): a stellar tesselation (ST) with a signal-to-noise ratio S/N ≈ 25 in the stellar continuum between 5490 Å and 5510 Å (275 bins), and an emission line tesselation (ET), with S/N ≈ 50 for the Hα line, obtained after subtracting the continuum using a spectral window at restframe λHα + 50 Å (4645 bins).
We fitted the stellar component in the spectra obtained from the ST using pPXF (Cappellari & Emsellem 2004; Cappellari 2017). The code performs a full spectral fitting of the spectra with a linear combination of template spectral energy distributions widened to match the line of sight velocity distribution (LOSVD) of the spectral lines. We used the MIUSCAT template library (Vazdekis et al. 2012). As the spectral resolution of MUSE is worse than that of MIUSCAT in the blue, we convolved the MIUSCAT library with an adaptive Gaussian kernel to match the MUSE blue resolution. In red, the MUSE spectra were Gauss-convolved to match the MIUSCAT resolution. For this fit we masked the regions affected by strong sky lines and by emission lines. The fit was run in the range from 4750 Å to 8800 Å. The stellar continuum was modelled with an eighth-order additive Legendre polynomial.
We then reran pPXF over the spectra from the ST. This time, we kept the kinematics obtained in the previous step fixed and we did not mask the ISM emission lines. These were modelled with a Gaussian profile with the velocity and the velocity dispersion as free parameters. The lines fitted are Hβ, [O III] λ4959, [OIII] λ5007, [O I] λ6300, [OI] λ6364, [N II] λ6548, Hα, [NII] λ6583, [S II] λ6716, and [SII] λ6731. All the fitted emission lines were tied to have the same velocity and velocity dispersion. We adopted as radial velocity of the galaxy the value of 4799 km s−1 from Zhao et al. (2016).
We ran pPPXF a final time using the ET. Instead of fitting the stellar continuum with a combination of templates, we used the fitted stellar spectrum of the ST bin whose centre was the closest to that of the ET under study. The stellar model was not allowed to vary except for a scaling factor. This final pPXF fit is the one that provided the line properties reported in this Letter.
2.2. HST and ALMA data
We use additional data from the literature: an archival WFPC3 F555W HST image, 600 s deep (6 different exposures) and with  angular resolution, taken as post-explosion data of SN 2010bt (Elias-Rosa et al. 2018), and the ALMA CO(6-5) data with a
  resolution from Zhao et al. (2016). The alignment of the various data sets is not trivial. We calibrated the astrometry for the HST and the MUSE data by comparing the position of SF knots with their coordinates in the Gaia DR2 (Gaia Collaboration 2016, 2018). The ALMA data have good astrometry, so no calibration was required for those.
3. Results
The overall morphology of the central region of NGC 7130 is well known, and the alignment of the CO(6-5) emission with darker patches indicating dust concentrations has been described by Zhao et al. (2016). Figure 1 compares our MUSE data integrated over the whole spectral range with archival HST and ALMA imaging, highlighting the structure of the central region with well-organised dust lanes, spiral arm fragments and bright emission from the central 1″, as well as the morphology of the CO and dust. Figure 1 shows the exquisite spatial resolution and imaging capacity of the new AO-assisted MUSE NFM: local peaks of emission can easily be recognised as having a very similar resolution to the HST image, and across most of the MUSE FOV. The spatial resolution of our MUSE data is around  .
.
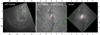 |
Fig. 1. Left panel: F555W HST image covering the central area of NGC 7130. Overlaid in green is the area covered by MUSE-NFM. Middle panel: zoomed-in view of the HST F555W image. Black contours correspond to the CO(6-5) line emission calculated as in Zhao et al. (2016) from their ALMA datacube; levels are as in Zhao et al. (2016, [1, 2, 4, 6, 7, 10] × 3σ with σ = 1.1 Jy beam−1 km s−1) but look slightly different, possibly because of additional processing performed by Zhao et al. (2016). Right panel: MUSE datacube integrated along the spectral direction. We note the high spatial resolution of this image, similar to that in the HST image. The red ellipse indicates the UCNR, measured as in Comerón et al. (2014). Coordinate labels are in arcseconds in all panels. The centre is defined to be at the spaxel with the largest sigma in the gas kinematics fit and is indicated by a red cross. North is up and east is to the left. |
Various emission-line maps as derived from our MUSE data are shown in Fig. 2. These maps were corrected for extinction by assuming an unextincted ratio of FHα/FHβ of 2.86 (Osterbrock 1989), and an extinction law as in Calzetti et al. (2000) with  . We show the resulting E(B − V)g map in Fig. 2.
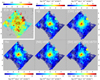 |
Fig. 2. Top left panel: E(B − V)g dust extinction map derived from the Hα and Hβ MUSE maps. Overlaid are the CO(6-5) contours of Fig. 1. Other panels: emission line maps in the lines of Hβ, [O III] λ5007, Hα, [NII] λ6583 and the [SII] doublet1. Colour scale and units are indicated above and below each panel. Axis labels and orientation are as in Fig. 1. |
The morphology of the central region is very similar in the different emission lines. In all maps, we see a strong nuclear peak, only slightly offset from the peak in velocity dispersion which we assume to be both the nucleus of the galaxy and the location of the AGN. This emission peak is surrounded, at a radius of  (∼160 pc), by the ring-like distribution of star forming regions first described by González Delgado et al. (1998) on the basis of their UV and optical HST imaging. Such small rings are not unusual, and were classified as ultra-compact nuclear rings (UCNRs) by Comerón et al. (2008). In Fig. 2, most of the individual fragments of emission in the HST UV map of González Delgado et al. (1998) can be seen, again confirming the superb quality of our new IFU data.
Outside the central arcsec region, various emission peaks can be identified in our maps, several of which confirm, but show much more detail of, the emission-line regions north and south of the nucleus identified by Davies et al. (2014). The overall line emission follows a north-south distribution, highlighting SF occurring in the immediate vicinity of the dust lanes coming into the nuclear regions (see HST image, Fig. 1).
A strong-line ratio diagnostic diagram is shown in Fig. 3. Such diagrams (Baldwin et al. 1981) allow one to distinguish between HII region and AGN regimes of emission2, and they are therefore excellent tools to study the details and origin of the starburst–AGN composite nature of the central region of NGC 7130. We colour-code the individual spaxels by their location in the diagnostic diagrams, and then map them back (Fig. 3, right) using the parameter η as introduced by Erroz-Ferrer et al. (in prep.) in the context of their analysis of the galaxies in the MUSE Atlas of Disks survey. These authors define η as: a) for the “Shock region” the orthogonal distance to the continuous curve, b) for the “SF” region the orthogonal distance to the dashed curve, and c) for the region in between the orthogonal distance to the bisector of the dashed and continuous curves. The parameter is normalised so that η = 0.5 at the continuous curve and η = −0.5 at the dashed curve.
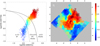 |
Fig. 3. OIII/Hβ vs NII/Hα diagnostic diagram (left panel), populated with the individual spaxels from the MUSE cube and colour-coded by the η parameter from Erroz-Ferrer et al. (in prep.). Right panel: location of the points according to these colours. The solid curve indicates the theoretical upper limit to pure SF from Kewley et al. (2001), with the empirical limit to this from Kauffmann et al. (2003) given as the dashed curve. The cross denoting the centre and the axis labels and orientation in the right panel are as in Fig. 1. |
Figure 3 shows that there is a large spread of line ratios from the SF to the AGN parts of the diagrams, with the AGN-region spaxels located primarily in the nuclear region of the galaxy, surrounded by areas dominated by SF. This confirms the general findings of Davies et al. (2014), but we do not confirm the almost perfectly annular distribution they present in their Fig. 5, indicating how the AGN contribution gradually decreases with increasing radius. Instead, we find a large plume of AGN-style emission extending from the nuclear region towards the NW, to the edge of our MUSE FOV, and with the largest values of η occurring not in the nucleus but along the plume. Below, we come back to this plume, and propose that it traces an outflow from the AGN. The fact that the circumnuclear medium is affected by the AGN was also shown by Pozzi et al. (2017) from their study of the CO spectral energy distribution.
Another feature to note in Fig. 3 is that the location of the intensely star-forming regions (e.g., González Delgado et al. 1998, and Figs. 1 and 2) is nicely reflected in the right panel as distinct local spots with lower η values in the central-arcsecond region in the top-right panel (seen as orange spots in the figure), the latter no doubt due to mixing of emission from the star-forming regions with that from the AGN.
Figure 4 shows the emission line kinematics: velocity field and velocity dispersion. From Zhao et al. (2016) we know that the gradient in the velocity field due to galaxy rotation is roughly east-west, and this is indeed seen in the area in Fig. 4. We will explore this in more detail in a future paper, where we will combine the MUSE kinematics with Hα Fabry-Pérot data which we have just obtained at the 4.2 m William Herschel Telescope. In that paper, we will also model the velocity field in more detail, using a multi-component analysis as in Davies et al. (2014) rather than the main-peak approach followed here in this initial work.
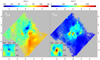 |
Fig. 4. Gas velocity field (left panel) and velocity dispersion map (right panel) derived from the ten emission lines (Sect. 2) in our MUSE data set. The insets show an enlarged version of the innermost |

A tiny area of ordered rotation at enhanced velocities can be distinguished in the very central region (within  in radius, see inset in left panel in Fig. 4). We interpret this as a tiny (radius 60 pc) kinematically decoupled nuclear disc, with a rotation axis offset by around 90° from that of the main body of the galaxy. Such discs are not uncommon, but discovering such a small one around the Seyfert nucleus of NGC 7130 is proof of the capabilities of MUSE. It will be modelled in detail in a subsequent paper.
The velocity dispersion map shows a well-defined peak, which we identify as marking the location of the centre of the galaxy, and of the AGN. It is surrounded by an area of ∼2″ diameter with increased velocity dispersion and some localised enhanced regions which may be related to the star-forming spots in the UCNR.
Another interesting feature in both the velocity and dispersion maps is the plume of approaching, high-dispersion gas extending from the nucleus to the edge of the MUSE FOV in the NW direction, coinciding spatially with the plume of material that we discovered from the diagnostic diagrams.
4. Discussion
4.1. Nuclear disc
The exquisite spatial resolution of our new MUSE-NFM data set is highlighted by the recovery of almost all the structure in the circumnuclear region, which previously had only been seen in HST UV and optical imaging (e.g. González Delgado et al. 1998). We confirm the existence of star-forming regions in a ring configuration with a radius of  (185 pc; outlined in Fig. 1), a tiny ring that is classified as an UCNR following the size criterion in Comerón et al. (2008), and whose size we measure here following the methodology of Comerón et al. (2014). But what our MUSE data offer is a whole new angle on the physics of these circumnuclear regions, ranging from their emission line ratios (showing locally enhanced line ratios due to SF; Fig. 3) and kinematics (localised streaming motions and variations in velocity dispersions, Fig. 4) presented in this Letter, to their metallicity and stellar populations, which will be studied in future papers.
The small region with excess positive and negative velocities surrounding the peak in velocity dispersion and indicating the nucleus of the galaxy (inset, left panel, Fig. 4) has its velocity field oriented in the same direction as the jet and may be connected to it, although an alternative interpretation as a tiny nuclear disc rotating in a different plane from the host galaxy would not be at odds with the jet explanation.
4.2. Outflow plume
A second striking feature discovered from our new MUSE data is the plume of low-velocity, high-velocity dispersion material with AGN-like emission line characteristics extending from the nucleus towards the NW direction, and reaching the edge of the FOV, 2″ or 640 pc from the nucleus (Figs. 3 and 4). We interpret this plume as material flowing out from the Seyfert core in a one-sided jet configuration. Its orientation is almost exactly 90° offset from the line of nodes, which could indicate polar emission if the black hole accretion disc is rotating in the same plane and sense as its host galaxy.
The plume towards the NW does not have a counterpart in either UV, optical, or IR imaging (González Delgado et al. 1998; Davies et al. 2014), nor in CO(6-5) (Zhao et al. 2016). Its presence can also not be detected from individual narrow-band images or the dust extinction map (Fig. 2). It is only through sensitive high-resolution IFU data such as those from MUSE presented here that it can be uncovered, through its AGN-like emission line ratios, and through its kinematics. Its discovery adds another fascinating component to the rich morphology and physics of this composite AGN+starburst galaxy hosting one of the few known UCNRs.
5. Conclusions
New IFU data obtained with the AO-assisted MUSE-NFM instrument on the VLT of the archetypical AGN–starburst “composite” galaxy NGC 7130, achieving an unprecedented spatial resolution at optical wavelengths of around  , has led to two discoveries.
Firstly, we discover a distinct circumnuclear area of  in radius of positive and negative velocities which indicate a tiny kinematically decoupled inner disc. Such discs are commonly seen as a remnant of past interactions between galaxies, but the small size and proximity to the composite AGN+starburst core of NGC 7130 adds a new dimension to our understanding of this system.
Secondly, we report the discovery of a plume of material extending towards the NE from the nucleus until at least the edge of our FOV at 2″ (640 pc) radius which we interpret as an outflow jet originating in the AGN. The plume is not visible morphologically, but is clearly characterised in our data by emission-line ratios characteristic of AGN emission, enhanced gas velocity dispersion, and distinct non-circular gas velocities. Its orientation is roughly perpendicular to the line of nodes (Fig. 4) of the rotating host galaxy disc, which indicates that the black hole powering the AGN may rotate in the same orientation.
More detailed analysis and modelling of the physical properties and the kinematics of both the inner disc and the plume regions will be presented in future papers.
We have been advised that the data reduction pipeline will be updated in early 2019. This update may affect the absolute flux calibration, so we warn that the values given here may have to be updated later. No other parameters are expected to be affected, and all other results presented here, in particular those based on line ratios and kinematics, are robust.
To be more precise, between regions ionised by UV radiation from massive stars and those ionised by emission from AGN, shocks, or AGB stars.
Acknowledgments
We thank the staff who made MUSE perform so well in its new NFM mode. We thank Dr. Lodovico Coccato for his help with the data reduction, Dr. Ana Monreal-Ibero for comments on the manuscript, and Dr. Fatemeh Tabatabaei for advice on the astrometric calibration. J.H.K. acknowledges financial support from the European Union’s Horizon 2020 research and innovation programme under Marie Skłodowska-Curie grant agreement No. 721463 to the SUNDIAL ITN network, from the Spanish Ministry of Economy and Competitiveness (MINECO) under grant number AYA2016-76219-P, from the Fundación BBVA under its 2017 programme of assistance to scientific research groups, for the project “Using machine-learning techniques to drag galaxies from the noise in deep imaging”, and from the Leverhulme Trust through the award of a Visiting Professorship at LJMU. This research has made use of the NASA/IPAC Extragalactic Database (NED), which is operated by the Jet Propulsion Laboratory, California Institute of Technology, under contract with the National Aeronautics and Space Administration. This Letter makes use of the following ALMA data: ADS/JAO.ALMA#2013.1.00524.S. ALMA is a partnership of ESO (representing its member states), NSF (USA) and NINS (Japan), together with NRC (Canada), MOST and ASIAA (Taiwan), and KASI (Republic of Korea), in cooperation with the Republic of Chile. The Joint ALMA Observatory is operated by ESO, AUI/NRAO and NAOJ. This work has made use of data from the European Space Agency (ESA) mission Gaia (https://www.cosmos.esa.int/gaia), processed by the Gaia Data Processing and Analysis Consortium (DPAC, https://www.cosmos.esa.int/web/gaia/dpac/consortium). Funding for the DPAC has been provided by national institutions, in particular the institutions participating in the Gaia Multilateral Agreement. Some of the data presented in this Letter were obtained from the Mikulski Archive for Space Telescopes (MAST). STScI is operated by the Association of Universities for Research in Astronomy, Inc., under NASA contract NAS5-26555.
References
- Baldwin, J. A., Phillips, M. M., & Terlevich, R. 1981, PASP, 93, 5 [NASA ADS] [CrossRef] [EDP Sciences] [Google Scholar]
- Begelman, M. C., Blandford, R. D., & Rees, M. J. 1984, Rev. Mod. Phys., 56, 255 [NASA ADS] [CrossRef] [Google Scholar]
- Calzetti, D., Armus, L., Bohlin, R. C., et al. 2000, ApJ, 533, 682 [NASA ADS] [CrossRef] [Google Scholar]
- Cappellari, M. 2017, MNRAS, 466, 798 [NASA ADS] [CrossRef] [Google Scholar]
- Cappellari, M., & Copin, Y. 2003, MNRAS, 342, 345 [NASA ADS] [CrossRef] [Google Scholar]
- Cappellari, M., & Emsellem, E. 2004, PASP, 116, 138 [NASA ADS] [CrossRef] [Google Scholar]
- Comerón, S., Knapen, J. H., Beckman, J. E., & Shlosman, I. 2008, A&A, 478, 403 [NASA ADS] [CrossRef] [EDP Sciences] [Google Scholar]
- Comerón, S., Salo, H., Laurikainen, E., et al. 2014, A&A, 562, A121 [NASA ADS] [CrossRef] [EDP Sciences] [Google Scholar]
- Comerón, S., Salo, H., Knapen, J. H., & Peletier, R. F. 2019, A&A, submitted [Google Scholar]
- Davies, R. L., Rich, J. A., Kewley, L. J., & Dopita, M. A. 2014, MNRAS, 439, 3835 [NASA ADS] [CrossRef] [Google Scholar]
- de Vaucouleurs, G., de Vaucouleurs, A., Corwin, Jr., H. G., et al. 1991, Third Reference Catalogue of Bright Galaxies (New York, USA: Springer) [Google Scholar]
- Elias-Rosa, N., Van Dyk, S. D., Benetti, S., et al. 2018, ApJ, 860, 68 [NASA ADS] [CrossRef] [Google Scholar]
- Freudling, W., Romaniello, M., Bramich, D. M., et al. 2013, A&A, 559, A96 [NASA ADS] [CrossRef] [EDP Sciences] [Google Scholar]
- Gaia Collaboration (Prusti, T., et al.) 2016, A&A, 595, A1 [NASA ADS] [CrossRef] [EDP Sciences] [Google Scholar]
- Gaia Collaboration (Brown, A. G. A., et al.) 2018, A&A, 616, A1 [NASA ADS] [CrossRef] [EDP Sciences] [Google Scholar]
- González Delgado, R. M., Heckman, T., Leitherer, C., et al. 1998, ApJ, 505, 174 [NASA ADS] [CrossRef] [Google Scholar]
- Kauffmann, G., Heckman, T. M., Tremonti, C., et al. 2003, MNRAS, 346, 1055 [Google Scholar]
- Kewley, L. J., Dopita, M. A., Sutherland, R. S., Heisler, C. A., & Trevena, J. 2001, ApJ, 556, 121 [Google Scholar]
- Kormendy, J., & Ho, L. C. 2013, ARA&A, 51, 511 [Google Scholar]
- Osterbrock, D. E. 1989, Astrophysics of Gaseous Nebulae and Active Galactic Nuclei (Mill Valley: University Science Books) [CrossRef] [Google Scholar]
- Phillips, M. M., Charles, P. A., & Baldwin, J. A. 1983, ApJ, 266, 485 [NASA ADS] [CrossRef] [Google Scholar]
- Pozzi, F., Vallini, L., Vignali, C., et al. 2017, MNRAS, 470, L64 [NASA ADS] [CrossRef] [Google Scholar]
- Shlosman, I., Frank, J., & Begelman, M. C. 1989, Nature, 338, 45 [NASA ADS] [CrossRef] [Google Scholar]
- Stuik, R., Bacon, R., Conzelmann, R., et al. 2006, New Astron. Rev., 49, 618 [NASA ADS] [CrossRef] [Google Scholar]
- Vazdekis, A., Ricciardelli, E., Cenarro, A. J., et al. 2012, MNRAS, 424, 157 [NASA ADS] [CrossRef] [Google Scholar]
- Véron-Cetty, M. P., & Véron, P. 2006, A&A, 455, 773 [NASA ADS] [CrossRef] [EDP Sciences] [Google Scholar]
- Weilbacher, P. M., Streicher, O., Urrutia, T., et al. 2012, SPIE, 8451, 84510B [Google Scholar]
- Zhao, Y., Lu, N., Xu, C. K., et al. 2016, ApJ, 820, 118 [Google Scholar]
All Figures
|
Fig. 1. Left panel: F555W HST image covering the central area of NGC 7130. Overlaid in green is the area covered by MUSE-NFM. Middle panel: zoomed-in view of the HST F555W image. Black contours correspond to the CO(6-5) line emission calculated as in Zhao et al. (2016) from their ALMA datacube; levels are as in Zhao et al. (2016, [1, 2, 4, 6, 7, 10] × 3σ with σ = 1.1 Jy beam−1 km s−1) but look slightly different, possibly because of additional processing performed by Zhao et al. (2016). Right panel: MUSE datacube integrated along the spectral direction. We note the high spatial resolution of this image, similar to that in the HST image. The red ellipse indicates the UCNR, measured as in Comerón et al. (2014). Coordinate labels are in arcseconds in all panels. The centre is defined to be at the spaxel with the largest sigma in the gas kinematics fit and is indicated by a red cross. North is up and east is to the left. |
| In the text | |
|
Fig. 2. Top left panel: E(B − V)g dust extinction map derived from the Hα and Hβ MUSE maps. Overlaid are the CO(6-5) contours of Fig. 1. Other panels: emission line maps in the lines of Hβ, [O III] λ5007, Hα, [NII] λ6583 and the [SII] doublet1. Colour scale and units are indicated above and below each panel. Axis labels and orientation are as in Fig. 1. |
| In the text | |
|
Fig. 3. OIII/Hβ vs NII/Hα diagnostic diagram (left panel), populated with the individual spaxels from the MUSE cube and colour-coded by the η parameter from Erroz-Ferrer et al. (in prep.). Right panel: location of the points according to these colours. The solid curve indicates the theoretical upper limit to pure SF from Kewley et al. (2001), with the empirical limit to this from Kauffmann et al. (2003) given as the dashed curve. The cross denoting the centre and the axis labels and orientation in the right panel are as in Fig. 1. |
| In the text | |
|
Fig. 4. Gas velocity field (left panel) and velocity dispersion map (right panel) derived from the ten emission lines (Sect. 2) in our MUSE data set. The insets show an enlarged version of the innermost |
| In the text | |
Current usage metrics show cumulative count of Article Views (full-text article views including HTML views, PDF and ePub downloads, according to the available data) and Abstracts Views on Vision4Press platform.
Data correspond to usage on the plateform after 2015. The current usage metrics is available 48-96 hours after online publication and is updated daily on week days.
Initial download of the metrics may take a while.