Fig. 2.
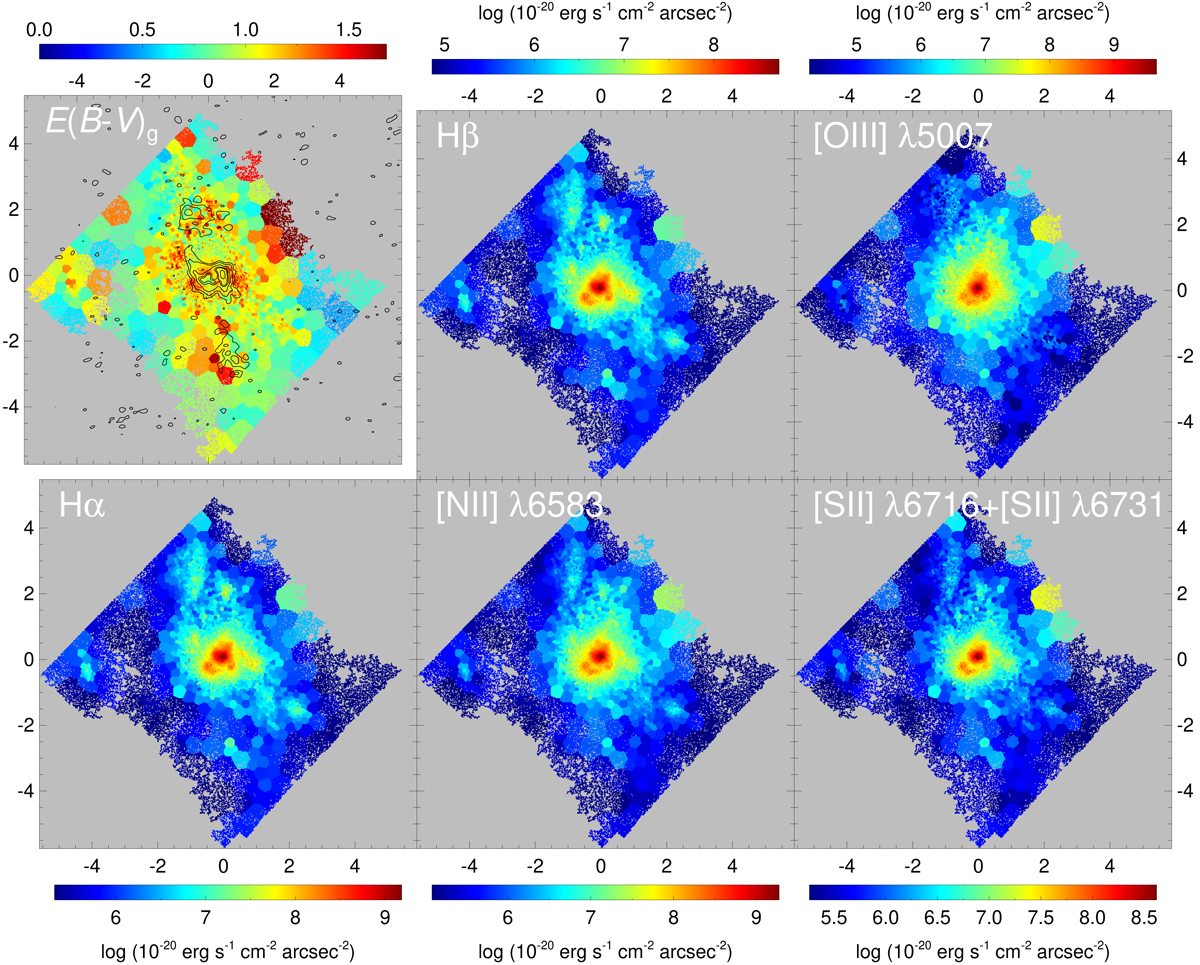
Top left panel: E(B − V)g dust extinction map derived from the Hα and Hβ MUSE maps. Overlaid are the CO(6-5) contours of Fig. 1. Other panels: emission line maps in the lines of Hβ, [O III] λ5007, Hα, [NII] λ6583 and the [SII] doublet1. Colour scale and units are indicated above and below each panel. Axis labels and orientation are as in Fig. 1.
Current usage metrics show cumulative count of Article Views (full-text article views including HTML views, PDF and ePub downloads, according to the available data) and Abstracts Views on Vision4Press platform.
Data correspond to usage on the plateform after 2015. The current usage metrics is available 48-96 hours after online publication and is updated daily on week days.
Initial download of the metrics may take a while.