Fig. 1.
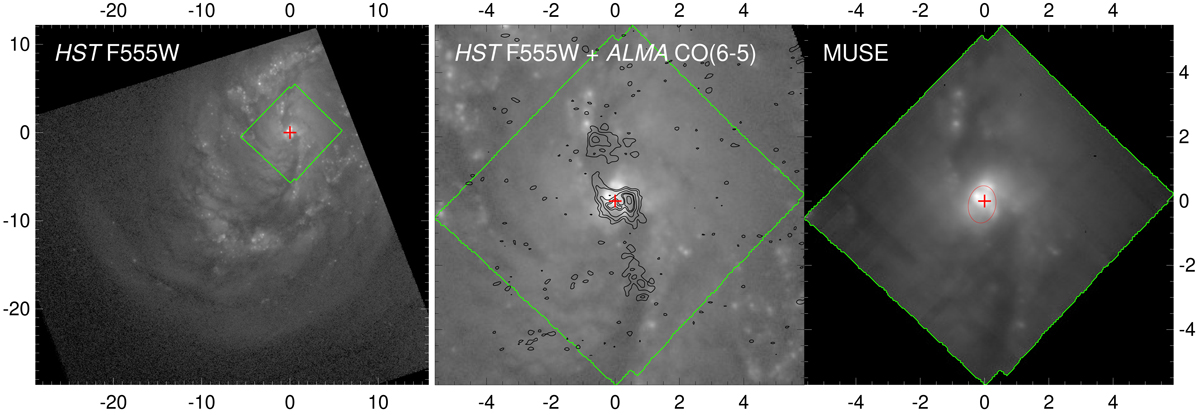
Left panel: F555W HST image covering the central area of NGC 7130. Overlaid in green is the area covered by MUSE-NFM. Middle panel: zoomed-in view of the HST F555W image. Black contours correspond to the CO(6-5) line emission calculated as in Zhao et al. (2016) from their ALMA datacube; levels are as in Zhao et al. (2016, [1, 2, 4, 6, 7, 10] × 3σ with σ = 1.1 Jy beam−1 km s−1) but look slightly different, possibly because of additional processing performed by Zhao et al. (2016). Right panel: MUSE datacube integrated along the spectral direction. We note the high spatial resolution of this image, similar to that in the HST image. The red ellipse indicates the UCNR, measured as in Comerón et al. (2014). Coordinate labels are in arcseconds in all panels. The centre is defined to be at the spaxel with the largest sigma in the gas kinematics fit and is indicated by a red cross. North is up and east is to the left.
Current usage metrics show cumulative count of Article Views (full-text article views including HTML views, PDF and ePub downloads, according to the available data) and Abstracts Views on Vision4Press platform.
Data correspond to usage on the plateform after 2015. The current usage metrics is available 48-96 hours after online publication and is updated daily on week days.
Initial download of the metrics may take a while.