Fig. 4.
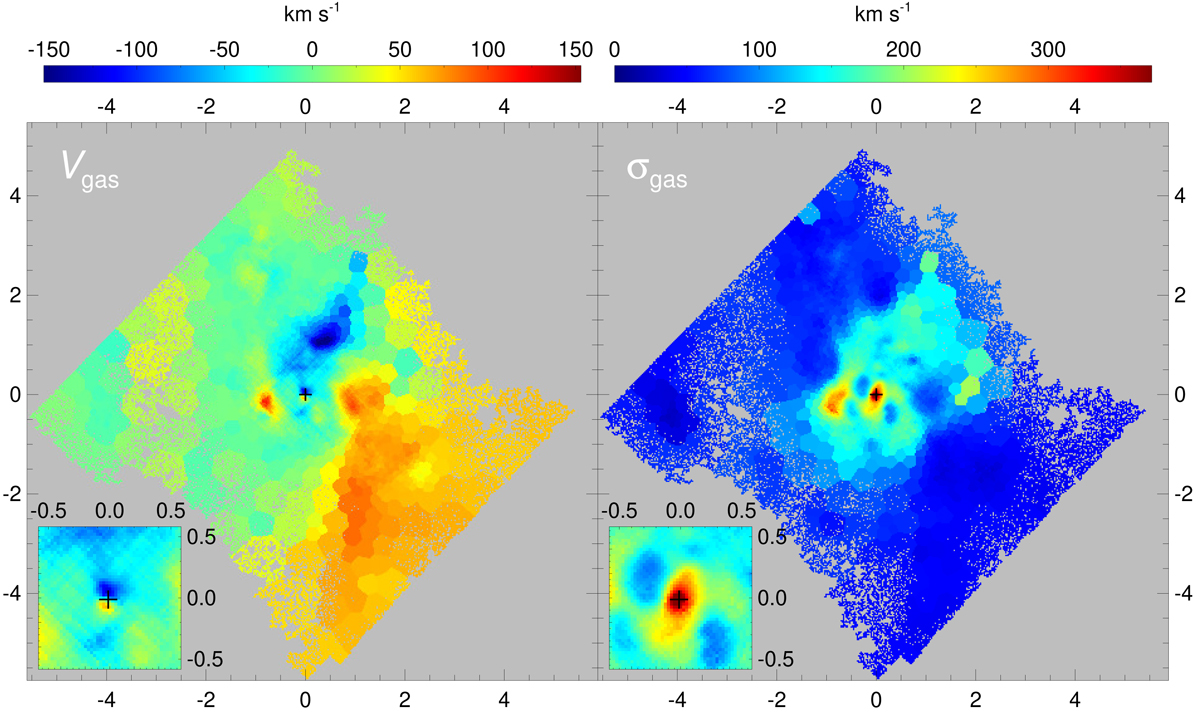
Gas velocity field (left panel) and velocity dispersion map (right panel) derived from the ten emission lines (Sect. 2) in our MUSE data set. The insets show an enlarged version of the innermost ![]() . Colour scale and units are indicated above each panel. Following Zhao et al. (2016), the zero velocity corresponds to a heliocentric recession velocity of vhelio = 4799 km s−1. The crosses indicate the centre of coordinates. Axis labels and orientation are as in Fig. 1.
. Colour scale and units are indicated above each panel. Following Zhao et al. (2016), the zero velocity corresponds to a heliocentric recession velocity of vhelio = 4799 km s−1. The crosses indicate the centre of coordinates. Axis labels and orientation are as in Fig. 1.
Current usage metrics show cumulative count of Article Views (full-text article views including HTML views, PDF and ePub downloads, according to the available data) and Abstracts Views on Vision4Press platform.
Data correspond to usage on the plateform after 2015. The current usage metrics is available 48-96 hours after online publication and is updated daily on week days.
Initial download of the metrics may take a while.