Fig. 3.
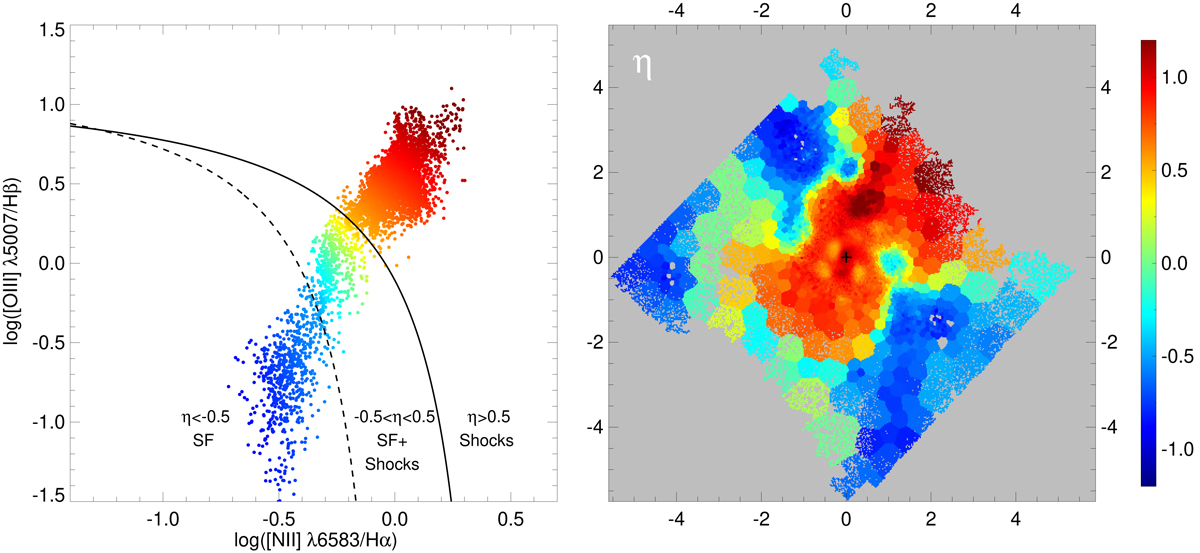
OIII/Hβ vs NII/Hα diagnostic diagram (left panel), populated with the individual spaxels from the MUSE cube and colour-coded by the η parameter from Erroz-Ferrer et al. (in prep.). Right panel: location of the points according to these colours. The solid curve indicates the theoretical upper limit to pure SF from Kewley et al. (2001), with the empirical limit to this from Kauffmann et al. (2003) given as the dashed curve. The cross denoting the centre and the axis labels and orientation in the right panel are as in Fig. 1.
Current usage metrics show cumulative count of Article Views (full-text article views including HTML views, PDF and ePub downloads, according to the available data) and Abstracts Views on Vision4Press platform.
Data correspond to usage on the plateform after 2015. The current usage metrics is available 48-96 hours after online publication and is updated daily on week days.
Initial download of the metrics may take a while.