| Issue |
A&A
Volume 621, January 2019
|
|
|---|---|---|
| Article Number | A23 | |
| Number of page(s) | 8 | |
| Section | Planets and planetary systems | |
| DOI | https://doi.org/10.1051/0004-6361/201833749 | |
| Published online | 21 December 2018 | |
Photochemical escape of atomic C and N on Mars: clues from a multi-instrument MAVEN dataset
1
School of Atmospheric Sciences, Sun Yat-sen University,
Zhuhai, PR China
e-mail: This email address is being protected from spambots. You need JavaScript enabled to view it.
2
Key Laboratory of Lunar and Deep Space Exploration, National Astronomical Observatories, Chinese Academy of Sciences,
Beijing, PR China
3
Center for Excellence in Comparative Planetology, Chinese Academy of Sciences,
Hefei, PR China
4
Space Science Institute, Macau University of Science and Technology,
Macau,
PR China
5
Key Laboratory of Earth and Planetary Physics, Institute of Geology and Geophysics, Chinese Academy of Sciences,
Beijing, PR China
Received:
30
June
2018
Accepted:
8
November
2018
Abstract
Context. Photochemical escape of hot atoms is crucial to the long-term evolution of the Martian climate. For atomic C and N, photochemical escape is primarily driven by photodissociation (PD) of CO and N2.
Aims. Combining the Mars Atmosphere and Volatile Evolution (MAVEN) measurements of atmospheric neutral densities and solar EUV/X-ray irradiance, we perform a state-of-the-art analysis of atomic C and N escape on Mars.
Methods. For each MAVEN orbit, we calculated the hot C and N production rates in the dayside Martian upper atmosphere via PD, from which the escape rates are estimated using a simplified technique to parameterize the respective escape probabilities taking into account multiple collisions with ambient neutrals.
Results. The mean C and N escape rates are 1 × 1024 s−1 and 9 × 1024 s−1, appropriate for low to moderate solar activity conditions, and thermospheric PD makes a larger contribution to the total N escape than to the total C escape. The above differences highlight the importance of nascent energy, with more energetic nascent escaping atoms able to survive collisions with ambient neutrals more easily, thus extending down to deeper regions of the atmosphere. Solar cycle variation in C and N escape is revealed by our analysis, whereas solar zenith angle variation is absent for both species. These results could be explained by the fact that the production of nascent escaping atoms responds to varying solar illumination angle at low altitudes where the escape probability is negligible, but responds to varying level of solar EUV/X-ray irradiance at high altitudes where the atmosphere is essentially collisionless.
Key words: planets and satellites: individual: Mars / planets and satellites: atmospheres
© ESO 2018
1 Introduction
The network of photochemical reactions occurring in a planetary upper atmosphere produces a wealth of hot atoms, with a fraction capable of gaining sufficient energy to escape (e.g., Johnson et al. 2008). A notable example is the photochemical escape of atomic O on Mars, an important factor that modulates the long-term evolution of the Martian climate (Lammer et al. 2013; Lillis et al. 2015). The controlling process is generally thought to be the dissociative recombination (DR) of O (Fox & Hać 2018, and references therein), the most abundant species of the Martian ionosphere (Hanson et al. 1977; Benna et al. 2015). For the photochemical escape of atomic C and N, photodissociation (PD) of CO and N2 becomes the dominant process (Fox 1993; Fox & Bakalian 2001; Bakalian & Hartle 2006).
Photochemical escape of hot atoms on Mars has been modeled by numerous authors over the past few decades, using a variety of methods such as the exobase approximation (e.g., Levine et al. 1974, 1978; Wallis 1978), the two-stream solution to the Boltzmann equation (e.g., Nagey & Cravens 1988; Kim et al. 1998), as well as the Monte Carlo simulation that traces the trajectories of a large number of test particles (e.g., Hodges 2000; Fox & Bakalian 2001; Bakalian & Hartle 2006; Bakalian 2006; Cipriani et al. 2007; Shematovich et al. 2007; Fox & Hać 2009; Valeille et al. 2010; Shematovich 2013; Gröller et al. 2014; Lee et al. 2015; Zhao & Tian 2015). Estimates of the atomic O escape rate in the literature vary greatly from 1024 s−1 to 1026 s−1 depending on season and solar activity (Fox & Hać 2018, and references therein). Atomic C and N escape are less well studied, with estimated escape rates typically over the range of 1023 s−1 to 1024 s−1 (e.g., Fox 2004; Bakalian & Hartle 2006; Bakalian 2006; Gröller et al. 2014; Zhao et al. 2017).
Evaluating the photochemical escape of hot atoms with realistic data is complicated because knowledge of a number of controlling factors is required, including solar extreme ultraviolet (EUV) irradiance, atmospheric neutral and ion densities, as well as electron density and temperature. The recent Mars Atmosphere and Volatile Evolution (MAVEN) mission (Jakosky et al. 2015)provides a unique opportunity to explore a wide parameter space of all the above controlling factors, allowing theescape rates to be estimated rigorously and the dominant photochemical processes to be identified unambiguously.
Recently, a thorough analysis of atomic O escape driven by DR was performed by Lillis et al. (2017) based on a multi-instrument MAVEN dataset, revealing a modern era mean escape rate of 4 × 1025 s−1 which is in agreement with the early result of Lee et al. (2015) based on the Rosetta Far Ultraviolet Imaging Spectrograph measurements. The atomic O escape on Mars could also be probed indirectly by analyzing the pick-up ion signature in the vicinity of the planet, as done by Rahmati et al. (2017) using the data acquired by several particle instruments onboard MAVEN. In the present study, we focus on atomic C and N escape instead. We calculated the hot C and N production rates in the dayside Martian upper atmosphere (Sect. 2), which are used to estimate their escape fluxes based on a simplified technique to parameterize the respective escape probabilities (Sect. 3). Section 4 is devoted to the variability of C and N escape among different orbits. Finally, conclusions are provided in Sect. 5.
2 Hot atom production rates
The complete set of controlling parameters used for calculating the hot atom production rate and the associated escape flux is favorably provided by the measurements made with several instruments onboard MAVEN. First, the solar EUV/X-ray flux is based on the level 3 solar spectral model at Mars, constructed from the Flare Irradiance Spectral Model – Mars (FISM – Mars) and calibrated with the Extreme Ultraviolet Monitor (EUVM) band irradiance data (Eparvier et al. 2015; Thiemann et al. 2017). Second, the neutral and ion densities are obtained from the Neutral Gasand Ion Mass Spectrometer (NGIMS) level 2 data in the Closed Source Neutral and Open Source Ion modes, respectively, both covering the mass range of 2–150 Da with a resolution of 1 Da (Mahaffy et al. 2015b). Third, the electron density and temperature are available from the Langmuir probe and waves (LPW) level 2 data which are derived either from measured current–voltage characteristics or from wave sounding (Andersson et al. 2015).
For the purpose of the present study, we have included all relevant measurements that are available at the time when this manuscript was being prepared, from the arrival of MAVEN at Mars on 21 Sep 2014 up to 14 Feb 2018. We took into account all measurements made with solar zenith angle (SZA) up to 110°, beyond which the portion of the Martian upper atmosphere with significant C and N escape probabilities, typically around 200 km, is no longer illuminated by the Sun and the photochemical escape rate is expected to fall rapidly (see below). The outbound data acquired during each MAVEN orbit are excluded to avoid contamination by possible reactions on the NGIMS antechamber walls, a well-known feature that also occurs on other mass spectrometers with a similar design (Cui et al. 2009).
Photodissociation is predicted to be the dominant process driving atomic C and N escape on Mars (Fox 2004; Bakalian & Hartle 2006). The PD rate, pj, for a given species j (either CO or N2) is calculated via
 (1)
(1)
where λ is the wavelength, λmax,j is the maximum wavelength required by PD (112 nm for CO and 127 nm for N2), nj is the number density,  is the PD cross section, F∞ is the solar EUV/X-ray flux at the top of the atmosphere, and τ is the line-of-sight optical depth given by
 (2)
(2)
with z being the altitude,  being the photoabsorption cross section, and Ch being the Chapman grazing incidence function that takes into full account the spherical nature of the atmosphere (Smith & Smith 1972). The summation in Eq. (2) is over CO and N2, as well as CO2 and O as the two most abundant neutral species of the Martian upper atmosphere (Mahaffy et al. 2015a).
The relevant cross sections in Eqs. (1) and (2) are adapted from Heays et al. (2017; see also Visser et al. 2009), with a spectral resolution of 0.1 nm which is much higher than the resolution of 1 nm in the FISM - Mars solar irradiance model. Rather thanusing directly the NGIMS neutral density data, we construct empirical models for several neutral species including CO2, O, CO, N2, and Ar based on isothermal fittings to the respective densities measured from periapsis up to 250 km above the surface. Such a procedure effectively removes undesired wave structures frequently seen in the NGIMS neutral density data (e.g., England et al. 2017; Terada et al. 2017). When Eqs. (1) and (2) are applied to each MAVEN orbit, the SZA, which typically varies by several degrees below 250 km, is always fixed at its periapsis value.
An example is shown in Fig. 1A for orbit No. 1077 on 20 Apr 2015during the second MAVEN Deep Dip campaign, with a periapsis altitude of 130 km and under the subsolar condition. The dashed lines in the figure represent the NGIMS densities of five neutral species in the Martian upper atmosphere. The N2 and Ar densities are divided by 10 to improve visibility. The best-fit temperatures are 224 K for CO2, 126 K for O, 181 K for CO, 225 K for N2, and 233 K for Ar, respectively, as demonstrated by the solid lines. The CO2, N2, and Ar temperatures are in reasonable agreement (Mahaffy et al. 2015a), implying that these species are under diffusive equilibrium and the effect of eddy diffusion could be ignored (Jakosky et al. 2015). In contrast, the O and CO temperatures are considerably reduced, which is not surprising since the profiles of these two species are controlled by both diffusion and photochemistry (e.g., Krasnopolsky 2002), and accordingly their observed scale heights are not necessarily a diagnostic of the underlying thermal structure. Modest differences between the NGIMS data and the empirical fits are present for some of the species either at high altitudes, which likely reflects imperfect subtraction of background signals (Lillis et al. 2017), or near the periapsis, which is likely connected to antechamber wall chemistry (Cui et al. 2018).
The empirical fits are extrapolated to the altitude range from 100 km to 700 km over which the hot atom production rates are obtained with the aid of Eqs. (1) and (2), and displayed in Fig. 1B, solid red for C via CO PD and solid blue for N via N2 PD. We note that the latter is twice the N2 PD rate, since two N atoms are released per N2 PD event. The maximum hot C production rate is 43 cm−3 s−1 at 144 km and the maximum hot N production rate is 71 cm−3 s−1 at a slightlylower altitude of 140 km. From the figure, hot C production declines faster from the peak, with e-folding scales of 28 and 17 km above and below the peak, respectively, to be compared with 32 and 20 km for the decline in hot N production. At the exobase altitude of 220 km, the hot C and N production rates are 0.86 and 2.3 cm−3 s−1. Here the exobase altitude is obtained by assuming that the probability of no collision with ambient neutrals is e−1 (see Sect. 3). This is one of the common ways of defining the exobase altitude, and is essentially equivalent to the widely accepted assumption of identical neutral density scale height and collision mean free path (e.g., Strobel 2002).
Existing work indicates that hot C and N production via PD is substantially more important than production via DR (Fox & Bakalian 2001; Bakalian & Hartle 2006; Gröller et al. 2014). According to these works, the dominant DR processes are CO+ + e and  , respectively, with rate coefficients available from Rosén et al. (1998) and Peterson et al. (1998). Analogous to Lillis et al. (2017), we calculated the hot C and N production rates via DR based on the NGIMS measurements of relevant ion densities and the LPW measurements of electron density and temperature. Here we caution that only the sum of the CO+ and N
 densities is available due to their equality in mass-to-charge ratio but their relative contributions could be separated with the condition that the CO+ to N
 density ratio equals the CO to N2 photoionization rate ratio, which is a fair assumption under photochemical equilibrium. In contrast, the relative contributions of CO and N2 are readily separated with their distinct cracking patterns (Benna et al. 2015). The hot C and N production rates via DR for orbit No. 1077 are displayed by the dash-dotted lines in Fig. 1B, confirming the dominant role of PD with realistic data. We should be cautious in our conclusion that DR likely makes a significant contribution to hot N production above 250 km, but N escape is not seriously affected by hot N production at these altitudes. For instance, N2 PD below 250 km is responsible for nearly 95% of the total N escape rate (see Sect. 3). Accordingly, the DR contributions to atomic C and N escape are ignored throughout the rest of the paper.
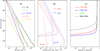 |
Fig. 1 Panel A: density profiles of CO2 (black), O (green), N2 (blue), CO (red), and Ar (orange) obtained from the NGIMS measurements over the inbound portion of MAVEN orbit No. 1077 on20 Apr 2015 during the second MAVEN Deep Dip campaign (dashed), to be compared with the respective empirical models assuming species-dependent constant temperatures from the periapsis up to 250 km (solid). The N2 and Ar densities are divided by 10 to improve visibility. Panel B: hot C production rates via CO PD (solid red) and CO+ DR (dash-dotted red), and the hot N production rates via N2 PD (solid blue) and N |

3 Hot atom escape rates
Some of the hot C and N atoms produced by PD in the Martian upper atmosphere have nascent energies above the respective escape energies, and these atoms truly escape provided that further collisions with ambient neutrals do not reduce their energies too much. The simplest way to calculate the escape flux is to column integrate the production rate of nascent escaping atoms above the exobase (e.g., McElroy 1972; Cravens et al. 1997). This implies that the probability for a nascent escaping atom to truly escape (hereafter the escape probability) equals zero below the exobase and 50% above, where the latter accounts for the fact that half of the nascent escaping atoms are released over the upward hemisphere. In reality, the exobase represents an extended region over which the escape probability varies gradually from zero to 50% (Fox & Hać 2009). To characterize such a smooth transition, a revised version of the analytic formulism proposed by Cravens et al. (2017) is implemented, which we describe in details as follows.
The elastic scattering of hot atoms by ambient neutrals is strongly forward, and the differential cross section for O–O collisions calculated by Kharchenko et al. (2000) predicts a mean scattering angle of 20°. This is assumed to be valid for all binary collisions involved here, and is used to obtain the mean fractional energy loss per elastic collision with either CO2 or O in theambient atmosphere. On average, the maximum number of collision, xj, that a nascent escaping atom of species j is able to survive without losing sufficient energy and becoming gravitationally bound by Mars satisfies the condition of
 (3)
(3)
where Ēj is the mean energy of the nascent escaping atom at a given altitude,  is the mean fractional energy loss per collision, and Eesc,j is the escape energy. For each of the atomic species, Ēj is obtained by integrating the differential production rate of nascent escaping atoms above the escape energy, and
  obtained by averaging over collisions with different ambient neutrals (either CO2 or O) weighted by their column densities above the given altitude.
For a nascent escaping atom, the probability of making i elastic collisions with ambient neutrals is  according to the Poisson distribution. Here k is the mean number of collisions given by
  where θ is the ejection angle of the nascent escaping atom with respect to local vertical, Nj is the column density,
  is the elastic collision cross section, and the summation is over CO2 and O. Clearly, a nascent escaping atom becomes truly escaping for a maximum number of ⌊x⌋ collisions where ⌊x⌋ is the maximum integer not exceeding x. The escape probability, Pesc, is then given by
 (4)
(4)
where the integration is over all ejection angles assuming isotropic but restricted to the upward hemisphere alone. For both C and N, the cross section for elastic collisions with CO2 is taken to be 2 × 10⁻¹⁴ cm2 using O as a proxy (Fox & Hać 2014), and for collisions with O, a cross section of 9 × 10⁻¹⁵ cm2 is used (Kharchenko et al. 1997). An implicit assumption in Eq. (4) is a constant direction of motion for any nascent escaping atom, which is strictly true for collisions with zero scattering angle but still reasonable for the strongly forward scatterings encountered here (Kharchenko et al. 2000).
The escape probabilities calculated from Eq. (4) are displayed in Fig. 1C for orbit No. 1077, red for C and blue for N. For comparison, we also show in dashed green the escape probability for the ideal exobase approximation, implying that according to our model, some of the hot atoms produced below the exobase are able to escape. Our model also predicts a higher escape probability than the model of Cravens et al. (2017), indicated by dashed black for a mean ejection angle of 60°. The latter essentially assumes that one collision is sufficient for a nascent escaping atom to be gravitationally bound by Mars. This is likely appropriate for isotropic scatterings but oversimplified for strongly forward scatterings encounteredhere as the fractional energy loss increases with increasing scattering angle (see Eq. (2) of Fox & Hać 2014).
The production rates of nascent escaping atoms, when multiplied by the escape probabilities, are shown by the dashed linesin Fig. 1B, denoted as escaping atom production rates for short. The peak values are 0.31 cm−3 s−1 at 207 km and 2.6 cm−3 s−1 at 193 km, respectively, for C and N. The escape fluxes for orbit No. 1077 are then readily found by the column integration of the escaping atom production rate weighted by  where RM is the solid body radius of Mars, giving 1.3 × 106 cm−2 s−1 for C and 1.1 × 107 cm−2 s−1 for N, both referred to the surface. The respective escape rates are 1 × 1024 s−1 and 9 × 1024 s−1 obtained by summing over the dayside hemisphere of Mars up to SZA = 110° (with a cross-sectional area of 8 × 1017 cm2), with possible SZA variations ignored for simplicity (see Sect. 4). For comparison, the C and N escape fluxes are 9.5 × 10⁵ and 5.1 × 106 cm−2 s−1 for the ideal exobase approximation, and 2.5 × 10⁵ and 1.4 × 106 cm−2 s−1 for the single collision approximation of Cravens et al. (2017), respectively, where all flux values refer to the surface. Therefore, we see that improper treatment of the escape probability near the exobase may lead to an underestimate of the escape flux by a significant amount.
The C and N escape rates derived following the procedure outlined above are subject to several sources of systematic uncertainty, which we address below in turn. The uncertainty in the calculated hot atom production rate is around 15%, which reflects the combined uncertainty in photoabsorption and PD cross sections (typically 10% according to Heays et al. 2017), in neutral density (typically below 1% according to Mahaffy et al. 2015a, over the altitude range with substantial contribution to the escape rate), and in the adopted FISM – Mars solar irradiance model (typically 10% according to Thiemann et al. 2017). The uncertainty in the escape probability is likely larger, which we expect to stem from at least three inherent uncertainties in applying Eqs. (3) and (4). First, the uncertainty in the elastic collision cross section could be as large as a factor of 2 (Fox & Hać 2014). Here we repeat our calculations by increasing (decreasing) all relevant elastic collision cross sections by a factor of 2, which leads to reduced (enhanced) escape rates by around 40%. Second, a constant direction of motion is implicitly assumed for any nascent escaping atom in calculating its escape probability, but such an uncertainty should be of minor importance because it is equivalent to an uncertainty of 6% only in the elastic collision cross section according to Eq. (4). Third, the change in gravitational energy should in principle be incorporated in Eq. (3), but this is ignored for simplicity by referring to a fixed altitude of 250 km in obtaining the numerical results presented so far. Repeating our calculations with varying reference altitudes from 250 to 700 km, we estimate the respective uncertainty in the escape rate to be 15%. When all the above sources of uncertainty are combined, a total uncertainty of around 50% in the escape rate is expected, which is dominated by the uncertainty in the elastic collision cross section following the above discussions. Finally, we caution that the scattering of C and N on ambient neutrals may lead to inelastic processes such as the ro-vibrational excitation of CO2 but these processes are ignored for simplicity as no cross section is available from either lab measurements or numerical calculations, and such a simplification may contribute to further uncertainty in the derived hot atom escape rate.
4 Variability in hot atom escape
The procedure outlined above is applied to the NGIMS and EUVM data along the inbound portions of a total number of 1544 MAVEN orbits, from which the atomic C and N escape rates driven by PD are estimated. The mean escape rates are found to be 1 × 1024 s−1 for C and 9 × 1024 s−1 for N, respectively. The difference in escape is not due to the difference in PD because the mean PD frequencies of the two species are comparable at the top of the atmosphere, 2.1 × 10⁻⁷ s−1 for CO and 2.5 × 10⁻⁷ s−1 for N2 where the latter has been multiplied by 2 to account for two N atoms released per PD event. The difference in escape instead highlights the importance of nascent energy, typically 1.5 eV for C and 2.5 eV for N, with more energetic N atoms able to survive more collisions with ambient neutrals, typically 15 collisions allowed for N and six collisions allowed for C. The above distinction naturally leads to a higher N escape probability and subsequently a higher N escape rate.
As already mentioned in Sect. 3, a significant amount of the escape rate is contributed by hot atoms produced below the exobase. When averaged over all orbits, CO PD below the exobase contributes to more than 50% of the total C escape, whereas N2 PD below the exobase is responsible for nearly 75% of the total N escape. For comparison, a similar conclusion on atomic O escape was reached by a number of authors (e.g., Nagey & Cravens 1988; Fox & Hać 2009). Compared to C escape, a larger contribution to N escape from thermospheric PD is again caused by the difference in nascent energy.
Considerable variability in escape is observed among different MAVEN orbits, for both C and N. Clues to the driving force of the variability can be gained from Fig. 2, where we display, from top to bottom, the CO PD frequency at the top of the atmosphere (as a diagnostic of the incident solar EUV/X-ray irradiance), the SZA at periapsis, the CO density, the production rate of nascent escaping C atoms (to be distinguished from truly escaping C atoms), the total CO2 and O mass densities, the C escape probability, as well as the C escape rate, all as a function of the orbit number. The same figure for N, whichreveals a similar orbit-to-orbit variability, is not shown.
From late Feb 2015 to mid Oct 2015, the 10.7 cm solar radio index at Earth, in solar flux unit, declines from 120 to 80, and rises mildly back to 100 in early Oct 2016 followed by another decline to 70 in mid-Feb 2018. Similar trends are observed in the CO PD frequency, along with small scale fluctuations caused by solar rotation (Fig. 2A). The entire duration of the MAVEN dataset included here is divided into several nearly consecutive sampling periods, with orbit number ranges of 729 to 1271, 1745 to 2541, 2631 to 3353, 3795 to 4468, 4624 to 5428, and 5542 to 6398, respectively, denoted as P1 to P6 (see the top of Fig. 2). Each sampling period presents a systematic SZA variation from 110° sunward to the smallest SZA available during that period and anti-sunward to 110° again (Fig. 2B). Therefore, the available MAVEN dataset allows both the solar cycle and SZA variations in C and N escape to be examined, despite the lack of measurements made at high solar activities.
The solar cycle and SZA variations are well observed in the production rate of nascent escaping C atoms (Fig. 2D). However, CO PD is controlled by solar EUV/X-ray irradiance and solar illumination angle in different ways, which has profound influence on the observed variation of C escape. A scrutiny of the production rate profiles reveals that the SZA variation mainly occurs at altitudes near or below peak production, whereas the solar cycle variation mainly occurs at altitudes near or above. Such a difference is more clearly seen in Fig. 3A where we compare the production rates of nascent escaping C atoms obtained for several MAVEN orbits under varying conditions of solar illumination. Specifically, orbits No. 5688, 5792, and 5960 (all in P6) are characterized by the same CO PD frequency of 1.6 × 10⁻⁷ s−1 at the top of the Martian atmosphere but different solar illumination angles of 75°, 55°, and 20°, respectively.For orbits No. 2993 (in P3) and 911 (in P1), both solar illumination angles are 55° but the CO PD frequencies are 2.0 × 10⁻⁷ s−1 for the former and 2.9 × 10⁻⁷ s−1 for the latter.
However, not all the nascent escaping atoms truly escape. According to Sect. 3, the escape rate is determined by both the production of nascent escaping atoms and the probability that these atoms survive collisions with ambient neutrals. The latter isdisplayed in Fig. 2F for all available MAVEN orbits, demonstrating a smooth but sharp transition between zero and 50%. The transition occurs at varying altitudes from orbit to orbit in response to the variation of the underlying atmosphericdensity structure (Fig. 2E). Figure 2F further demonstrates that the narrow transition region lies exclusively above peak production of nascent escaping atoms (indicated by the yellow crosses) except beyond the terminator. Since the transition region essentially marks the lowest boundary where nascent escaping atoms truly escape, the SZA variation of production (Fig. 2D), which is restricted to regions near or below peak production, is not necessarily accompanied by a similar variation of C escape (Fig. 2G). The lack of SZA variation of C escape is also contributed by the relatively weak SZA dependence of the transition altitude in escape probability (Fig. 2F). The above effects of the background density distribution and the escape probability are clearly demonstrated in Figs. 3B and C for the subset of MAVEN orbits with a similar CO PD frequency but different solar illumination angles. For comparison, we note that no obvious SZA variation of O escape is suggested by the MAVEN data as well (Lillis et al. 2017). In contrast, the solar cycle variation, which affects the topside production rate profile, is well preserved in the escape rate. Meanwhile, both Figs. 2F and 3C reveal an elevated transition altitude in escape probability with increasing solar EUV/X-ray irradiance, in response to the solar cycle variation of the background atmospheric density (Figs. 2E and 3B). Such a variation partially counteracts, but does not completely cancel out, the solar cycle variation of the topside production of nascent escaping atoms. To be more quantitative, we performed Kendall’s τ-tests to the available MAVEN dataset, giving correlation coefficients of + 0.67 between the CO PD frequency and the C escape rate, and − 0.05 between the SZA and the C escape rate, respectively. Similarly, the solar cycle and SZA variations of N escape are indicated by correlation coefficients of + 0.36 and + 0.03.
Analogous to Lillis et al. (2017), we show further in Fig. 4 the C and N escape rates as a function of the CO and N2 PD frequencies. The C escape rate increases systematically with increasing solar activity in a bimodal style. The variation at low solar activity below a threshold CO PD frequency of 2.3 × 10⁻⁷ s−1 is reasonably described by a power law with an exponent of 0.85, whereas above this threshold, a larger exponent of 1.8 is found. In contrast, the variation of N escape with N2 PD is substantially weaker, characterized by a power law exponent of only 0.45. These power law fits are indicated by the dashed lines in Fig. 4 for reference. For comparison, a much larger power law exponent of 2.6 was recently obtained for O escape via O DR in the dayside Martian upper atmosphere also based on the MAVEN data (Lillis et al. 2017). We should caution that the available MAVEN dataset characterizes low to moderate solar activity conditions, and a more robust evaluation of the solar cycle variation of hot atom escape relies on the accumulation of more data. We also emphasize that the various uncertainties quoted in Sect. 3 affect only the absolute values of the escape rate but not necessarily the solar cycle and SZA trends reported here.
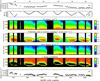 |
Fig. 2 CO PD frequency at the top of the atmosphere (panel A), the SZA at periapsis (panel B), the CO density (panel C), the production rate of nascent escaping C atoms (panel D), the atmospheric mass density (panel E, including only CO2 and O for simplicity), the C escape probability (panel F), as well as the C escape rate (panel G), all as a function of the MAVEN orbit number. The yellow crosses in panel F show the orbit-to-orbit variability in the altitude of peak production. The entire duration of the available dataset is divided into six nearly consecutive sampling periods with SZA below 110°, marked as P1 to P6 at the top of the figure. |
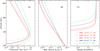 |
Fig. 3 Production rates of nascent escaping C atoms due to CO PD in the Martian upper atmosphere (panel A), the atmosphericmass densities (panel B), and the respective C escape probabilities (panel C) obtained for several MAVEN orbits under varying conditions of solar illumination. Different colors represent different levels of solar activity, and different line styles represent different solar illumination angles. The orbit numbers, the CO PD frequencies at the top of the atmosphere, as well as the periapsis SZAs are specified in the figure legend for reference. |
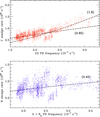 |
Fig. 4 Variations of the C (top panel) and N (bottom panel) escape rates with the CO and N2 PD frequencies at the top of the atmosphere. The latter frequency is multiplied by 2 to account for two N atoms released per PD event. The dashed lines represent the power law fits to the derived escape rates, with best-fit exponents quoted in the parentheses. |
5 Concluding remarks
A multi-instrument MAVEN dataset is used in the present study to examine the photochemical escape of atomic C and N on Mars. This is implemented by calculating the hot atom production rates in the dayside Martian upper atmosphere, from which the escape rates are derived with the aid of a simplified technique to parameterize the respective escape probabilities. Such a technique is different from the ideal exobase approximation (Fox & Hać 2009) in that a smooth transition in escape probability between zero and 50% is reasonably well captured, and is different from the model of Cravens et al. (2017) in that the nascent escaping atoms are allowed to make multiple collisions with ambient neutrals before they lose sufficient energy and become gravitationally bound by Mars. The implementation of our simplified technique also avoids the construction of sophisticated and time-consuming Monte Carlo models. A comparison between hot atom escape driven by PD and DR suggests the dominant photochemical process to be CO PD for C and N2 PD for N, thus confirming the early modeling results with realistic data (e.g., Fox 2004; Bakalian & Hartle 2006; Gröller et al. 2014).
Based on the available MAVEN dataset, the mean atomic C and N escape rates are 1 × 1024 s−1 and 9 × 1024 s−1, respectively.These rates are appropriate for low to moderate solar activity conditions. The combined uncertainty in the above escape rates is around 50%, and is dominated by the uncertainty in the elastic collision cross section. For comparison, the mean atomic O escape rate is substantially larger, around 4 × 1025 s−1 as estimatedby Lillis et al. (2017) also based on a multi-instrument MAVEN dataset. Our analysis implies that a significant amount of the escaping atoms are produced well below the nominal exobase, with CO PD contributing to more than 50% of the total C escape and N2 PD contributing to nearly 75% of the total N escape, respectively. The difference in escape between the two atomic species, in terms of both the total escape rate and the relative contribution from thermospheric PD, highlights the importance of nascent energy in that escaping N atoms are more energetic and able to survive collisions with ambient neutrals more easily, thus extending down to deeper regions of the atmosphere.
The available MAVEN dataset allows possible solar cycle and SZA variations to be evaluated. It is not surprising that strong solar cycle and SZA variations are present in the production rate of nascent escaping atoms. For comparison, solar cycle variation in the escape rate is clearly seen for C and also weakly seen for N, whereas no obvious SZA variation is present for both species. Clues to the variability in escape can be gained by comparing the production rates of nascent escaping atoms under different conditions of solar illumination. On the one hand, the SZA variation mainly occurs at altitudes near or below peak production, where the atmosphere is strongly collisional and the escape probability is negligible. On the other hand, the solar cycle variation mainly occurs at altitudes near or above peak production, where the atmosphere remains collisionless and the escape probability is significant. The combination of the above two facts, along with the variation of the background neutral atmosphere that controls the variation of the escape probability, is responsible for the maintenance of solar cycle variation and the absence of SZA variation in C and N escape on Mars. A similar mechanism likely works for other photochemical escape processes and on other planets as well (e.g., Lillis et al. 2017).
Power law relations are used to describe the solar cycle variations of both C and N escape, using the CO and N2 PD frequencies at the top of the atmosphere as diagnostics. Our analysis reveals that the solar cycle variation of C escape is bimodal, with best-fit exponents of 0.85 and 1.8, respectively, below and above a threshold CO PD frequency of 2.3 × 10⁻⁷ s−1. The power exponent characterizing the solar cycle variation of C escape serves as one of the key free parameters in the atmospheric C evolution model of Hu et al. (2015) and has important implications on the transition of the Martian climate from a warm and wet early state to the cold and arid current state. For N escape, a small exponent of 0.45 is obtained throughout the range of solar activity encountered here. For comparison, a much larger power law exponent of 2.6 for the solar cycle variation of atomic O escape driven by O DR was obtained based on a similar MAVEN dataset (Lillis et al. 2017).
Acknowledgements
J.C. and Y.W. acknowledge supports from the National Science Foundation of China (NSFC) through grants 41525015, 41774186, and 41525016. J.C. is also supported by the Science and Technology Development Fund of Macau SAR (FDCT) through grants 039/2013/A2 and 082/2015/A3. The multi-instrument MAVEN dataset used in this work is publicly available at the MAVEN Science Data Center (http://lasp.colorado.edu/maven/sdc/public/). We also acknowledge use of NASA Goddard Space Flight Center (GSFC)’s Space Physics Data Facility’s OMNIWeb service and OMNI data (https://omniweb.gsfc.nasa.gov/form/dx1.html). The authors appreciate the anonymous referee for his/her constructive comments which have greatly improved the quality of the manuscript.
References
- Andersson, L., Ergun, R. E., Delory, G. T., et al. 2015, Space Sci. Rev., 195, 173 [NASA ADS] [CrossRef] [Google Scholar]
- Bakalian, F. 2006, Icarus, 183, 69 [NASA ADS] [CrossRef] [Google Scholar]
- Bakalian, F., & Hartle, R. E. 2006, Icarus, 183, 55 [NASA ADS] [CrossRef] [Google Scholar]
- Benna, M., Mahaffy, P. R., Grebowsky, J. M., et al. 2015, Geophys. Res. Lett., 42, 8958 [NASA ADS] [CrossRef] [Google Scholar]
- Cipriani, F., Leblanc, F., & Berthelier, J. J. 2007, J. Geophys. Res. Planets, 112, E07001 [NASA ADS] [CrossRef] [Google Scholar]
- Cravens, T. E., Keller, C. N., & Ray, B. 1997, Planet. Space Sci., 45, 889 [NASA ADS] [CrossRef] [Google Scholar]
- Cravens, T. E., Rahmati, A., Fox, J. L., et al. 2017, J. Geophys. Res. Space Phys., 122, 1102 [Google Scholar]
- Cui, J., Yelle, R. V., Vuitton, V., et al. 2009, Icarus, 200, 581 [NASA ADS] [CrossRef] [Google Scholar]
- Cui, J., Yelle, R. V., Zhao, L.-L., et al. 2018, ApJ, 853, L33 [NASA ADS] [CrossRef] [Google Scholar]
- England, S. L., Liu, G., Yiǧit, E., et al. 2017, J. Geophys. Res. Space Phys., 122, 2310 [NASA ADS] [Google Scholar]
- Eparvier, F. G., Chamberlin, P. C., Woods, T. N., & Thiemann, E. M. B. 2015, Space Sci. Rev., 195, 293 [NASA ADS] [CrossRef] [Google Scholar]
- Fox, J. L. 1993, J. Geophys. Res., 98, 3297 [NASA ADS] [CrossRef] [Google Scholar]
- Fox, J. L. 2004, J. Geophys. Res. Space Phys., 109, A08306 [NASA ADS] [Google Scholar]
- Fox, J. L., & Bakalian, F. M. 2001, J. Geophys. Res., 106, 28785 [NASA ADS] [CrossRef] [Google Scholar]
- Fox, J. L., & Hać, A. B. 2009, Icarus, 204, 527 [NASA ADS] [CrossRef] [Google Scholar]
- Fox, J. L., & Hać, A. B. 2014, Icarus, 228, 375 [NASA ADS] [CrossRef] [Google Scholar]
- Fox, J. L., & Hać, A. B. 2018, Icarus, 300, 411 [NASA ADS] [CrossRef] [Google Scholar]
- Gröller, H., Lichtenegger, H., Lammer, H., & Shematovich, V. I. 2014, Planet. Space Sci., 98, 93 [NASA ADS] [CrossRef] [Google Scholar]
- Hanson, W. B., Sanatani, S., & Zuccaro, D. R. 1977, J. Geophys. Res., 82, 4351 [NASA ADS] [CrossRef] [Google Scholar]
- Heays, A. N., Bosman, A. D., & van Dishoeck E. F. 2017, A&A, 602, A105 [NASA ADS] [CrossRef] [EDP Sciences] [Google Scholar]
- Hodges, R. R. 2000, J. Geophys. Res., 105, 6971 [NASA ADS] [CrossRef] [Google Scholar]
- Hu, R., Kass, D. M., Ehlmann, B. L., & Yung, Y. L. 2015, Nat. Commun., 6, 10003 [NASA ADS] [CrossRef] [Google Scholar]
- Jakosky, B. M., Grebowsky, J. M., Luhmann, J. G., & Brain, D. A. 2015, Geophys. Res. Lett., 42, 8791 [NASA ADS] [CrossRef] [Google Scholar]
- Johnson, R. E., Combi, M. R., Fox, J. L., et al. 2008, Space Sci. Rev., 139, 355 [NASA ADS] [CrossRef] [Google Scholar]
- Kharchenko, V., Tharamel, J., & Dalgarno, A. 1997, J. Atmos. Sol. Terr. Phys., 59 [Google Scholar]
- Kharchenko, V., Dalgarno, A., Zygelman, B., & Yee, J.-H. 2000, J. Geophys. Res., 105, 24899 [NASA ADS] [CrossRef] [Google Scholar]
- Kim, J., Nagy, A. F., Fox, J. L., & Cravens, T. E. 1998, J. Geophys. Res., 103, 29339 [NASA ADS] [CrossRef] [Google Scholar]
- Krasnopolsky, V. A. 2002, J. Geophys. Res. Planets, 107, 5128 [NASA ADS] [CrossRef] [Google Scholar]
- Lammer, H., Chassefière, E., Karatekin, Ö., et al. 2013, Space Sci. Rev., 174, 113 [NASA ADS] [CrossRef] [Google Scholar]
- Lee, Y., Combi, M. R., Tenishev, V., Bougher, S. W., & Lillis, R. J. 2015, J. Geophys. Res. Planets, 120, 1880 [NASA ADS] [CrossRef] [Google Scholar]
- Levine, J. S., Keating, G. M., & Prior, E. J. 1974, Planet. Space Sci., 22, 500 [NASA ADS] [CrossRef] [Google Scholar]
- Levine, J. S., McDougal, D. S., Anderson, D. E., & Barker, E. S. 1978, Science, 200, 1048 [NASA ADS] [CrossRef] [Google Scholar]
- Lillis, R. J., Brain, D. A., Bougher, S. W., et al. 2015, Space Sci. Rev., 195, 357 [NASA ADS] [CrossRef] [Google Scholar]
- Lillis, R. J., Deighan, J., Fox, J. L., et al. 2017, J. Geophys. Res. Space Phys., 122, 3815 [Google Scholar]
- Mahaffy, P. R., Benna, M., Elrod, M., et al. 2015a, Geophys. Res. Lett., 42, 8951 [NASA ADS] [CrossRef] [Google Scholar]
- Mahaffy, P. R., Benna, M., King, T., et al. 2015b, Space Sci. Rev., 195, 49 [NASA ADS] [CrossRef] [Google Scholar]
- McElroy, M. B. 1972, Science, 175, 443 [NASA ADS] [CrossRef] [Google Scholar]
- Nagey, A. F., & Cravens, T. E. 1988, Geophys. Res. Lett., 15, 433 [NASA ADS] [CrossRef] [Google Scholar]
- Peterson, J. R., Le Padellec, A., Danared, H., et al. 1998, J. Chem. Phys., 108, 1978 [NASA ADS] [CrossRef] [Google Scholar]
- Rahmati, A., Larson, D. E., Cravens, T. E., et al. 2017, J. Geophys. Res. Space Phys., 122, 3689 [NASA ADS] [CrossRef] [Google Scholar]
- Rosén, S., Peverall, R., Larsson, M., et al. 1998, Phys. Rev. A, 57, 4462 [NASA ADS] [CrossRef] [Google Scholar]
- Shematovich, V. I. 2013, Sol. Syst. Res., 47, 437 [NASA ADS] [CrossRef] [Google Scholar]
- Shematovich, V. I., Tsvetkov, G. A., Krestyanikova, M. A., & Marov, M. Y. 2007, Sol. Syst. Res., 41, 103 [NASA ADS] [CrossRef] [Google Scholar]
- Smith, III, F. L., & Smith, C. 1972, J. Geophys. Res., 77, 3592 [Google Scholar]
- Strobel, D. F. 2002, Washington DC American Geophysical Union Geophysical Monograph Series, 130, 7 [NASA ADS] [Google Scholar]
- Terada, N., Leblanc, F., Nakagawa, H., et al. 2017, J. Geophys. Res. Space Phys., 122, 2374 [NASA ADS] [Google Scholar]
- Thiemann, E. M. B., Chamberlin, P. C., Eparvier, F. G., et al. 2017, J. Geophys. Res. Space Phys., 122, 2748 [Google Scholar]
- Valeille, A., Combi, M. R., Tenishev, V., Bougher, S. W., & Nagy, A. F. 2010, Icarus, 206, 18 [NASA ADS] [CrossRef] [Google Scholar]
- Visser, R., van Dishoeck, E. F., & Black, J. H. 2009, A&A, 503, 323 [NASA ADS] [CrossRef] [EDP Sciences] [Google Scholar]
- Wallis, M. K. 1978, Planet. Space Sci., 26, 949 [NASA ADS] [CrossRef] [Google Scholar]
- Zhao, J., & Tian, F. 2015, Icarus, 250, 477 [NASA ADS] [CrossRef] [Google Scholar]
- Zhao, J., Tian, F., Ni, Y., & Huang, X. 2017, Icarus, 284, 305 [NASA ADS] [CrossRef] [Google Scholar]
All Figures
|
Fig. 1 Panel A: density profiles of CO2 (black), O (green), N2 (blue), CO (red), and Ar (orange) obtained from the NGIMS measurements over the inbound portion of MAVEN orbit No. 1077 on20 Apr 2015 during the second MAVEN Deep Dip campaign (dashed), to be compared with the respective empirical models assuming species-dependent constant temperatures from the periapsis up to 250 km (solid). The N2 and Ar densities are divided by 10 to improve visibility. Panel B: hot C production rates via CO PD (solid red) and CO+ DR (dash-dotted red), and the hot N production rates via N2 PD (solid blue) and N |
| In the text | |
|
Fig. 2 CO PD frequency at the top of the atmosphere (panel A), the SZA at periapsis (panel B), the CO density (panel C), the production rate of nascent escaping C atoms (panel D), the atmospheric mass density (panel E, including only CO2 and O for simplicity), the C escape probability (panel F), as well as the C escape rate (panel G), all as a function of the MAVEN orbit number. The yellow crosses in panel F show the orbit-to-orbit variability in the altitude of peak production. The entire duration of the available dataset is divided into six nearly consecutive sampling periods with SZA below 110°, marked as P1 to P6 at the top of the figure. |
| In the text | |
|
Fig. 3 Production rates of nascent escaping C atoms due to CO PD in the Martian upper atmosphere (panel A), the atmosphericmass densities (panel B), and the respective C escape probabilities (panel C) obtained for several MAVEN orbits under varying conditions of solar illumination. Different colors represent different levels of solar activity, and different line styles represent different solar illumination angles. The orbit numbers, the CO PD frequencies at the top of the atmosphere, as well as the periapsis SZAs are specified in the figure legend for reference. |
| In the text | |
|
Fig. 4 Variations of the C (top panel) and N (bottom panel) escape rates with the CO and N2 PD frequencies at the top of the atmosphere. The latter frequency is multiplied by 2 to account for two N atoms released per PD event. The dashed lines represent the power law fits to the derived escape rates, with best-fit exponents quoted in the parentheses. |
| In the text | |
Current usage metrics show cumulative count of Article Views (full-text article views including HTML views, PDF and ePub downloads, according to the available data) and Abstracts Views on Vision4Press platform.
Data correspond to usage on the plateform after 2015. The current usage metrics is available 48-96 hours after online publication and is updated daily on week days.
Initial download of the metrics may take a while.