Fig. 2
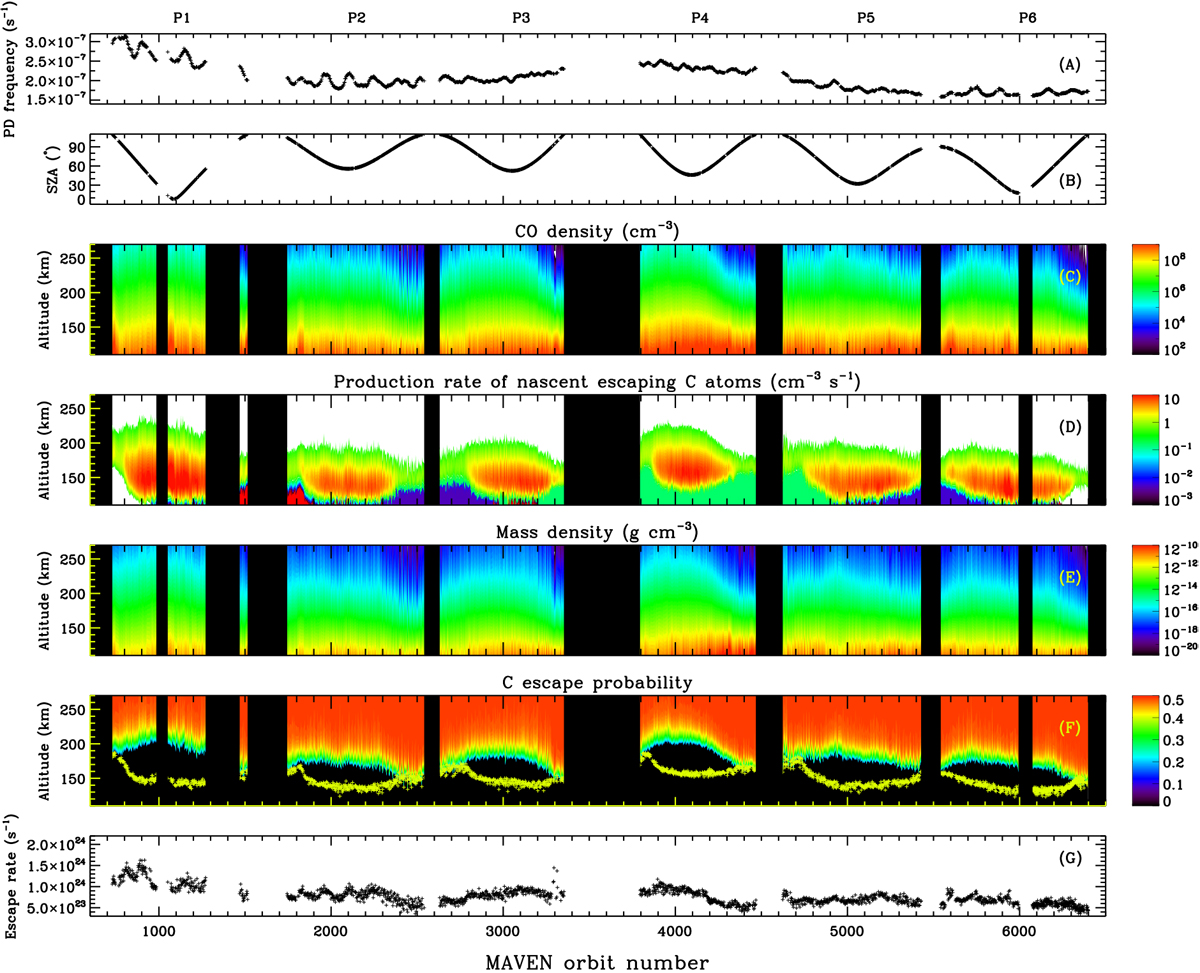
CO PD frequency at the top of the atmosphere (panel A), the SZA at periapsis (panel B), the CO density (panel C), the production rate of nascent escaping C atoms (panel D), the atmospheric mass density (panel E, including only CO2 and O for simplicity), the C escape probability (panel F), as well as the C escape rate (panel G), all as a function of the MAVEN orbit number. The yellow crosses in panel F show the orbit-to-orbit variability in the altitude of peak production. The entire duration of the available dataset is divided into six nearly consecutive sampling periods with SZA below 110°, marked as P1 to P6 at the top of the figure.
Current usage metrics show cumulative count of Article Views (full-text article views including HTML views, PDF and ePub downloads, according to the available data) and Abstracts Views on Vision4Press platform.
Data correspond to usage on the plateform after 2015. The current usage metrics is available 48-96 hours after online publication and is updated daily on week days.
Initial download of the metrics may take a while.