Fig. 4
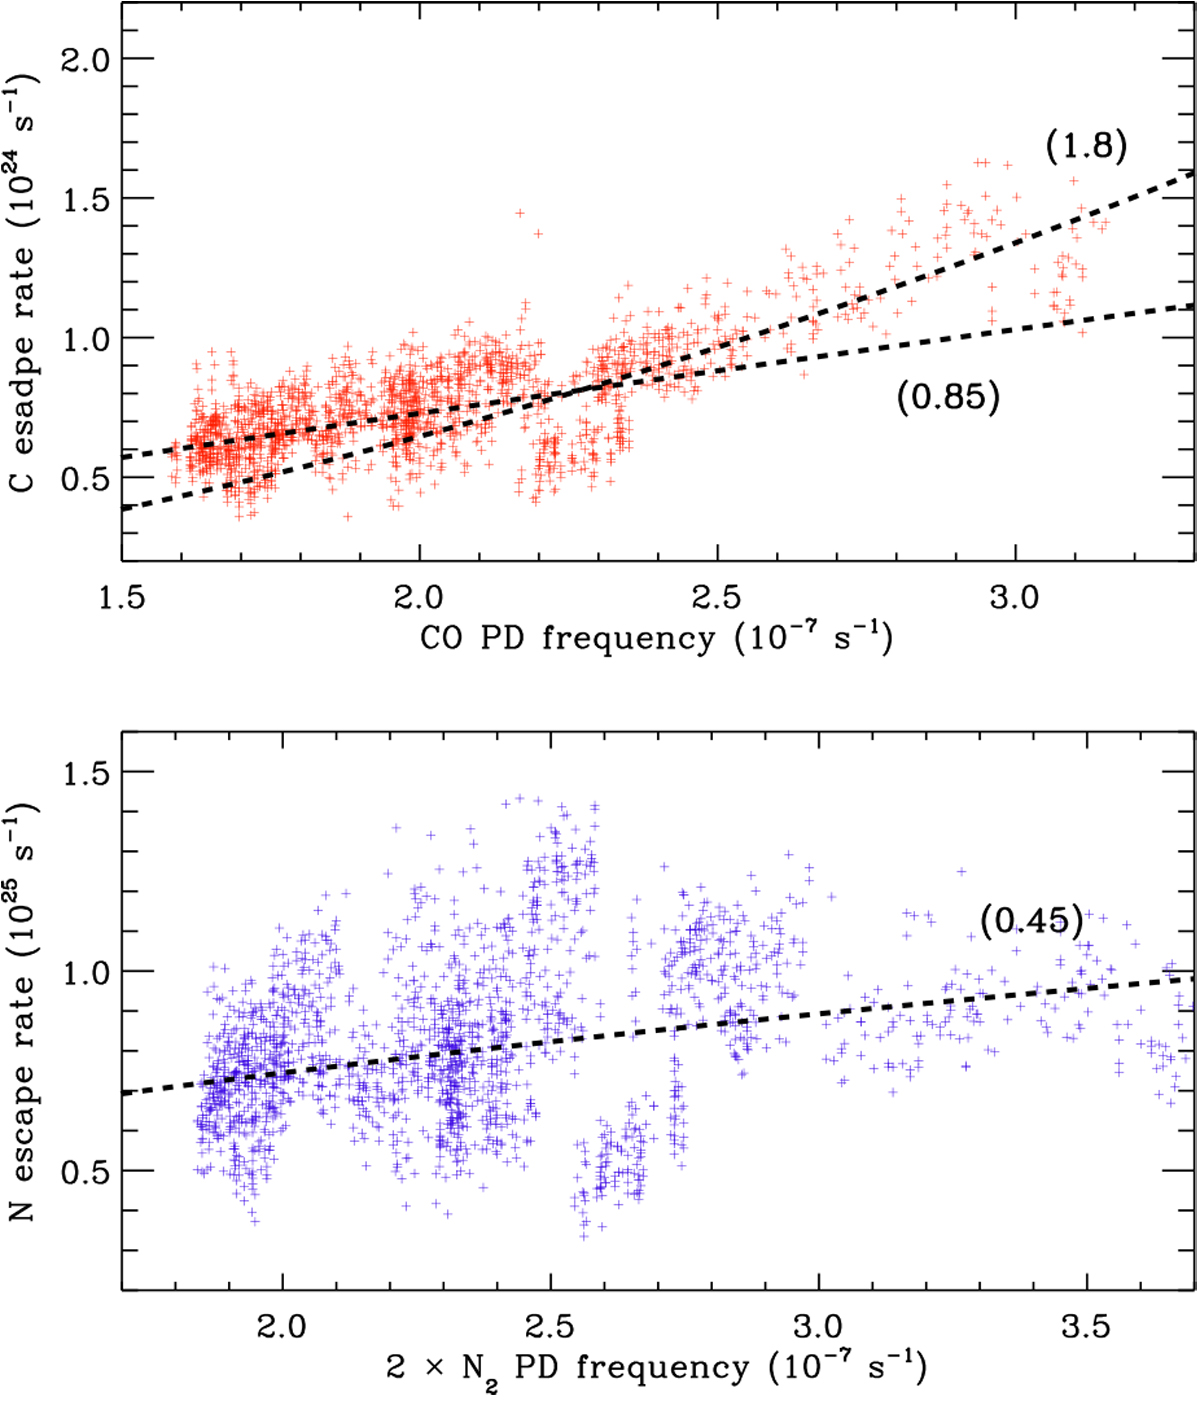
Variations of the C (top panel) and N (bottom panel) escape rates with the CO and N2 PD frequencies at the top of the atmosphere. The latter frequency is multiplied by 2 to account for two N atoms released per PD event. The dashed lines represent the power law fits to the derived escape rates, with best-fit exponents quoted in the parentheses.
Current usage metrics show cumulative count of Article Views (full-text article views including HTML views, PDF and ePub downloads, according to the available data) and Abstracts Views on Vision4Press platform.
Data correspond to usage on the plateform after 2015. The current usage metrics is available 48-96 hours after online publication and is updated daily on week days.
Initial download of the metrics may take a while.