Fig. 3
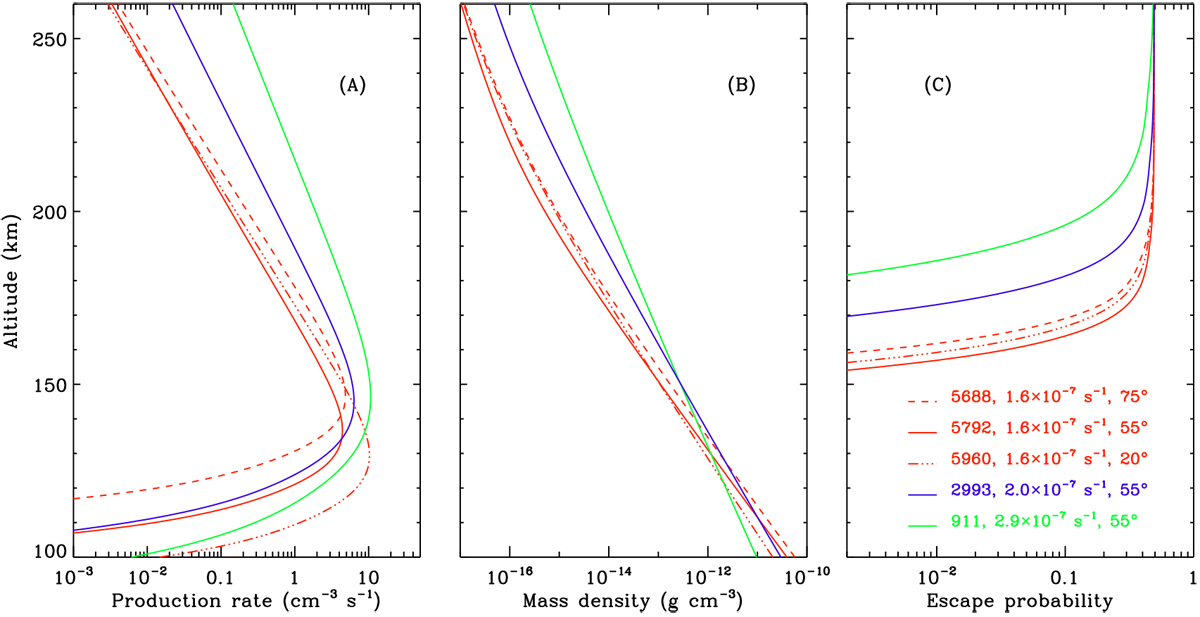
Production rates of nascent escaping C atoms due to CO PD in the Martian upper atmosphere (panel A), the atmosphericmass densities (panel B), and the respective C escape probabilities (panel C) obtained for several MAVEN orbits under varying conditions of solar illumination. Different colors represent different levels of solar activity, and different line styles represent different solar illumination angles. The orbit numbers, the CO PD frequencies at the top of the atmosphere, as well as the periapsis SZAs are specified in the figure legend for reference.
Current usage metrics show cumulative count of Article Views (full-text article views including HTML views, PDF and ePub downloads, according to the available data) and Abstracts Views on Vision4Press platform.
Data correspond to usage on the plateform after 2015. The current usage metrics is available 48-96 hours after online publication and is updated daily on week days.
Initial download of the metrics may take a while.