Fig. 1

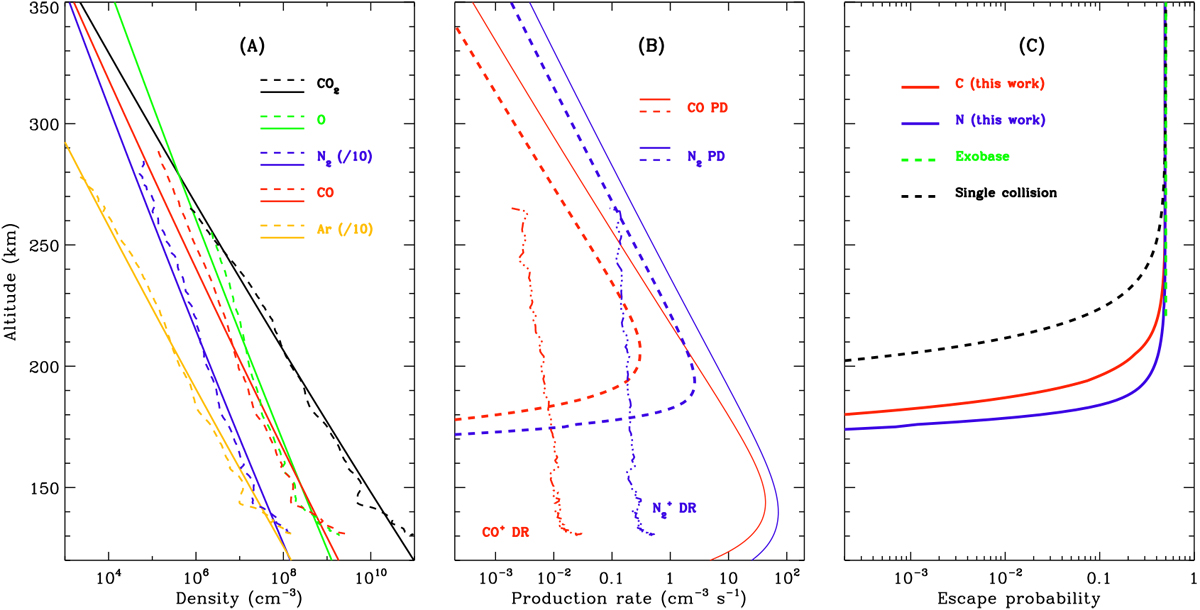
Panel A: density profiles of CO2 (black), O (green), N2 (blue), CO (red), and Ar (orange) obtained from the NGIMS measurements over the inbound portion of MAVEN orbit No. 1077 on20 Apr 2015 during the second MAVEN Deep Dip campaign (dashed), to be compared with the respective empirical models assuming species-dependent constant temperatures from the periapsis up to 250 km (solid). The N2 and Ar densities are divided by 10 to improve visibility. Panel B: hot C production rates via CO PD (solid red) and CO+ DR (dash-dotted red), and the hot N production rates via N2 PD (solid blue) and N![]() DR (dash-dotted blue), respectively. Also shown are the production rates of nascent escaping C (dashed red) and N (dashed blue) atoms, multiplied by the respective escape probabilities obtained with the multiple collision model outlined in Sect. 3. Panel C: escape probabilities for C (solid red) and N (solid blue) based on this study, as well as the escape probabilities for the ideal exobase approximation (dashed green) and the single collision approximation of Cravens et al. (2017) for a mean ejection angle of 60° with respective to local vertical (dashed black).
DR (dash-dotted blue), respectively. Also shown are the production rates of nascent escaping C (dashed red) and N (dashed blue) atoms, multiplied by the respective escape probabilities obtained with the multiple collision model outlined in Sect. 3. Panel C: escape probabilities for C (solid red) and N (solid blue) based on this study, as well as the escape probabilities for the ideal exobase approximation (dashed green) and the single collision approximation of Cravens et al. (2017) for a mean ejection angle of 60° with respective to local vertical (dashed black).
Current usage metrics show cumulative count of Article Views (full-text article views including HTML views, PDF and ePub downloads, according to the available data) and Abstracts Views on Vision4Press platform.
Data correspond to usage on the plateform after 2015. The current usage metrics is available 48-96 hours after online publication and is updated daily on week days.
Initial download of the metrics may take a while.


