| Issue |
A&A
Volume 620, December 2018
|
|
|---|---|---|
| Article Number | A164 | |
| Number of page(s) | 16 | |
| Section | Extragalactic astronomy | |
| DOI | https://doi.org/10.1051/0004-6361/201833914 | |
| Published online | 12 December 2018 | |
A Virgo Environmental Survey Tracing Ionised Gas Emission (VESTIGE)
IV. A tail of ionised gas in the merger remnant NGC4424
1
Aix-Marseille Univ., CNRS, CNES, LAM, Marseille, France
e-mail: This email address is being protected from spambots. You need JavaScript enabled to view it.
2
Max-Planck-Institut für Extraterrestrische Physik, Giessenbachstrasse, 85748 Garching, Germany
3
Institute for Computational Cosmology and Centre for Extragalactic Astronomy, Department of Physics, Durham University, South Road, Durham DH1 3LE, UK
e-mail: This email address is being protected from spambots. You need JavaScript enabled to view it.
4
Universitá di Milano-Bicocca, Piazza della scienza 3, 20100 Milano, Italy
e-mail: This email address is being protected from spambots. You need JavaScript enabled to view it.
5
Department of Physics and Astronomy, University of Alabama in Huntsville, Huntsville, AL 35899, USA
6
European Southern Observatory, Alonso de Córdova 3107, Casilla 19, Santiago, Chile
7
Centro de Astronomía (CITEVA), Universidad de Antofagasta, Avenida Angamos 601, Antofagasta, Chile
8
International Centre for Radio Astronomy Research, The University of western Australia, 35 Stirling Highway, Crawley, WA 6009, Australia
9
ARC Centre of Excellence for All Sky Astrophysics in 3 Dimensions (ASTRO 3D), Australia
10
NRC Herzberg Astronomy and Astrophysics, 5071 West Saanich Road, Victoria, BC V9E 2E7, Canada
11
AIM, CEA, CNRS, Université Paris-Saclay, Université Paris Diderot, Sorbonne Paris Cité, Observatoire de Paris, PSL University, 91191 Gif-sur-Yvette Cedex, France
12
Department of Physiscs and Astronomy, Youngstown State University, Youngstown, OH, USA
13
PITT PACC, Department of Physics and Astronomy, University of Pittsburgh, Pittsburgh, PA 15260, USA
14
Department of Astrophysics, University of Vienna, Turkenschanzstrasse 17, 1180 Vienna, Austria
15
Finnish Centre for Astronomy with ESO (FINCA), University of Turku, 20014 Finland
16
Tuorla Observatory, Department of Physics and Astronomy, University of Turku, 20014 Finland
17
Instituto de Astronomia, Geofísica e Ciências Atmosféricas da Universidadede São Paulo, Cidade Universitária, CEP 05508-900 São Paulo, SP, Brazil
18
Cerro Tololo Inter-American Observatory, SOAR Telescope, Casilla 603, La Serena, Chile
19
Univ. Lyon1, ENS de Lyon, CNRS, Centre de Recherche Astrophysique de Lyon UMR5574, 69230 Saint-Genis-Laval, France
20
Instituto de Astronomía, Universidad Nacional Autónoma de México, Circuito Exterior, Ciudad Universitaria, Ciudad de México 04510, Mexico
21
UK Astronomy Technology Centre, Royal Observatory Edinburgh, Blackford Hill, Edinburgh EH9 3HJ, UK
22
UCO/Lick Observatory, University of California, Santa Cruz, 1156 High Street, Santa Cruz, CA 95064, USA
23
Texas Tech University, Physics Department, Box 41051, Lubbock, TX 79409-1051, USA
24
INAF-Osservatorio Astronomico di Brera, via Brera 28, 20121 Milano, Italy
25
Observatoire Astronomique de Strasbourg, UMR 7750, 11 rue de l’Université, 67000 Strasbourg, France
Received:
20
July
2018
Accepted:
22
October
2018
Abstract
We observed the late-type peculiar galaxy NGC 4424 during the Virgo Environmental Survey Tracing Galaxy Evolution (VESTIGE), a blind narrow-band Hα+[NII] imaging survey of the Virgo cluster carried out with MegaCam at the Canada-French-Hawaii Telescope (CFHT). The presence of a ∼110 kpc (in projected distance) HI tail in the southern direction indicates that this galaxy is undergoing a ram pressure stripping event. The deep narrow-band image revealed a low surface brightness (Σ(Hα) ≃ 4 × 10⁻¹⁸ erg s−1 cm−2 arcsec−2) ionised gas tail ∼10 kpc in length extending from the centre of the galaxy to the north-west, thus in the direction opposite to the HI tail. Chandra and XMM X-rays data do not show a compact source in the nucleus or an extended tail of hot gas, while IFU spectroscopy (MUSE) indicates that the gas is photo-ionised in the inner regions and shock-ionised in the outer parts. Medium-resolution (MUSE) and high-resolution (Fabry-Perot) IFU spectroscopy confirms that the ionised gas is kinematically decoupled from the stellar component and indicates the presence of two kinematically distinct structures in the stellar disc. The analysis of the SED of the galaxy indicates that the activity of star formation was totally quenched in the outer disc ∼250–280 Myr ago, while only reduced by ∼80% in the central regions. All this observational evidence suggests that NGC 4424 is the remnant of an unequal-mass merger that occurred ≲500 Myr ago when the galaxy was already a member of the Virgo cluster, and is now undergoing a ram pressure stripping event that has removed the gas and quenched the activity of star formation in the outer disc. The tail of ionised gas probably results from the outflow produced by a central starburst fed by the collapse of gas induced by the merging episode. This outflow is sufficiently powerful to overcome the ram pressure induced by the intracluster medium on the disc of the galaxy crossing the cluster. This analysis thus suggests that feedback can participate in the quenching process of galaxies in high-density regions.
Key words: galaxies: individual: NGC 4424 / galaxies: clusters: general / galaxies: clusters: individual: Virgo / galaxies: evolution / galaxies: interactions / galaxies: ISM
Visiting Astronomer at NRC Herzberg Astronomy and Astrophysics, 5071 West Saanich Road, Victoria, BC, V9E 2E7, Canada.
© ESO 2018
1. Introduction
It is well established that the environment plays a major role in shaping galaxy evolution. Rich clusters of galaxies in the local (Dressler 1980; Whitmore et al. 1993) and intermediate-redshift Universe (Dressler et al. 1997) are dominated by a quiescent galaxy population mainly composed of ellipticals and lenticulars. At the same time, compared to their field counterparts, star forming systems in rich environments are generally deprived of their interstellar medium (ISM) in its different phases, from the atomic (Haynes et al. 1984; Solanes et al. 2001; Vollmer et al. 2001a; Gavazzi et al. 2005, 2006b, 2013) and molecular gas (Fumagalli et al. 2009; Boselli et al. 2014b) to the interstellar dust (Cortese et al. 2010, 2012a). As a consequence, their star formation could be significantly reduced (Kennicutt 1983; Gavazzi et al. 1998, 2002, 2006a, 2013; Boselli et al. 2014c, 2015).
Different physical processes have been proposed in the literature to explain the differences observed, as reviewed in Boselli & Gavazzi (2006, 2014). These processes can be broadly divided in two main families: those related to the gravitational perturbation that a galaxy can suffer in a dense environment (galaxy–galaxy interactions, Merritt 1983, galaxy-cluster interactions, Byrd & Valtonen 1990, galaxy harassment, Moore et al. 1998), and those due to the interaction of the galaxy ISM with the hot (T ≃ 107 − 108 K) and dense (ρICM ≃ 10−3 cm−3; Sarazin 1986) intracluster medium (ICM; ram pressure, Gunn & Gott 1972, thermal evaporation, Cowie & Songaila 1977, viscous stripping, Nulsen 1982, starvation, Larson et al. 1980).
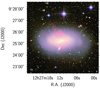 |
Fig. 1. Pseudo-colour image of NGC 4424 obtained combining the NGVS (Ferrarese et al. 2012) optical u and g in the blue channel, the r and NB in the green, and the i and the continuum-subtracted Hα in the red. At the assumed distance of the galaxy (16.5 Mpc), 1 arcmin = 4.8 kpc. Stellar shells are not detected down to the NGVS surface brightness limit of μg = 29 mag arcsec−2. |
The identification of the dominant mechanism responsible for the morphological transformation of galaxies in dense environments is one of the major challenges of modern extragalactic astronomy. It is expected that the relative importance of the aforementioned processes varies with the mass of galaxies and of the overdense regions, and thus with cosmic time given that these structures are growing with time. The identification of the principal process can be carried on by comparing complete samples of galaxies in different environments, from voids to rich clusters, and at different redshifts, with the prediction of cosmological simulations and semi-analytic models of galaxy evolution. It can also be accomplished by comparing the detailed multifrequency observations of representative objects to the predictions of models and simulations especially tailored to take into account the effects of the different perturbations. This second approach has been succesfully applied to a large number of galaxies in nearby clusters where the sensitivity and the angular resolution of multifrequency observations allows us to compare in a coherent study the properties of the different galaxy components (e.g. stellar populations, dust, gas in its different phases, magnetic fields) to the predictions of models. Typical examples are the studies of several galaxies in the Virgo cluster (Kenney & Koopmann 1999; Kenney & Yale 2002; Boselli et al. 2005, 2006; Kenney et al. 2004, 2008, 2014; Vollmer et al. 1999, 2000, 2004a,b, 2005a,b, 2006, 2008a,b, 2009, 2012; Fumagalli et al. 2011; Abramson & Kenney 2014; Abramson et al. 2011, 2016; Jáchym et al. 2013), Coma cluster (Vollmer et al. 2001b; Kenney et al. 2015), A1367 (Gavazzi et al. 1995, 2001a,b; Consolandi et al. 2017), and Norma cluster (Sun et al. 2006, 2007, 2010; Fumagalli et al. 2014; Jáchym et al. 2014; Fossati et al. 2016), or the jellyfish galaxies of the GASP survey (Poggianti et al. 2017). The analysis of these representative objects has been important not only to understand the very nature of the physical mechanisms in act, but also to see that different processes can jointly participate in and compete in the ongoing transformation (Gavazzi et al. 2001a,b, 2003a; Vollmer 2003; Vollmer et al. 2005b; Cortese et al. 2006; Fritz et al. 2017).
NGC 4424, the galaxy analysed in this work, is a typical example of an object undergoing a violent transformation due to different mechanisms (Fig. 1 and Table 1). This star forming system is located at ≃ 0.9 Mpc ( ≃ 0.6R200) projected distance from M 87 and M 49, the two dominant substructures of the Virgo cluster, but it is likely a member of the main cluster A given its distance of ≃ 15.5–15.8 Mpc (Munari et al. 2013; Hatt et al. 2018)1. The first analysis on optical data done by Kenney et al. (1996) revealed a peculiar morphology with the presence of shells suggesting that this object has recently undergone a merging event. This scenario was later confirmed by high-resolution spectroscopic and CO observations by Cortés et al. (2006, 2015). The presence of a 110 kpc tail in projected length of HI gas has been interpreted as clear evidence that the galaxy is now undergoing a ram pressure stripping event (Chung et al. 2007, 2009; Sorgho et al. 2017). Radio continuum observations also indicate the presence of two polarised cones perpendicular to the disc of the galaxy, probably due to a nuclear outflow (Vollmer et al. 2013).
Properties of the galaxy NGC 4424 (VCC 979).
To study the effects of the environment on galaxy evolution, we are undertaking Virgo Environmental Survey Tracing Ionised Gas Emission (VESTIGE), a deep blind Hα+[NII]2 narrow-band (NB) imaging survey of the Virgo cluster at the CFHT (Boselli et al. 2018a; Paper I). One of the purposes of this survey is to identify galaxies undergoing perturbations with the hostile cluster environment through the observation of peculiar morphologies in the ionised gas component. Deep blind observations of galaxies in nearby clusters, now made possible by the advent of large panoramic detectors coupled with 4–8 m class telescopes, have indicated Hα NB imaging as one of the most efficient techniques for this purpose (Gavazzi et al. 2001a; Yoshida et al. 2002; Yagi et al. 2007, 2010, 2017; Sun et al. 2007; Kenney et al. 2008; Fossati et al. 2012; Zhang et al. 2013; Boselli et al. 2016a). The new Hα image of NGC 4424 taken as part of the VESTIGE survey reveals the presence of spectacular features in the ionised gas distribution. We use these new data, combined with Chandra and XMM imaging and high-resolution 2D Fabry-Perot spectroscopic data gathered during follow-up observations and integral field spectroscopic data from VLT/MUSE to further analyse the kinematical and physical properties of this intriguing object. The observations and data reduction are described in Sect. 2, while the description of the multifrequency data used in the analysis is given in Sect. 3. The derivation of the physical and kinematical parameters is given in Sect. 4, while the discussion and conclusions follow in Sects. 5 and 6.
2. Observations and data reduction
2.1. Narrow-band imaging
The galaxy NGC 4424 was observed during VESTIGE pilot observations in April 2016. The observations were carried out using MegaCam at the CFHT coupled with the new NB filter MP9603 (λc = 6590 Å; Δλ = 104 Å) perfectly suited for the observations of Virgo cluster galaxies. At the redshift of the galaxy (cz = 438 km s−1) the filter encompasses the Hα line (λ = 6563 Å), where the transmissivity is T = 92%, and the two [NII] lines (λ = 6548, 6583 Å). MegaCam is composed of 40 CCDs with a pixel scale of 0.187 arcsec pixel−1. As for the other pilot observations (Boselli et al. 2016a, 2018b; Fossati et al. 2018), the galaxy was observed using the pointing-macro QSO LDP-CCD7 especially designed for the Elixir-LSB data reduction pipeline. This macro is composed of seven different overlapping pointings over a region of 40 × 30 arcmin2. The determination of the stellar continuum is secured via a similar observation in the r-band filter. The integration time for each single pointing within the macro was of 660 s in the NB filter and 66 s in the r-band. The macro was run twice, thus the total integration time is of 924 s in r-band and 9240 s in NB. The typical sensitivity of the images is similar to that reached during the VESTIGE survey, i.e. f(Hα) ∼ 4 × 10⁻¹⁷ erg s−1 cm−2 for point sources (5σ) and Σ(Hα) ∼ 2 × 10⁻¹⁸ erg s−1 cm−2 arcsec−2 for extended sources (1σ after smoothing at 3 arcsec resolution; see Paper I for details). The images are of excellent quality, with a median image quality of 0.63 arcsec in the r-band and 0.62 arcsec in the NB filter.
As for the other VESTIGE observations, the MegaCam images were reduced using Elixir-LSB (Ferrarese et al. 2012), a data reduction pipeline especially designed to detect the diffuse emission of extended low surface brightness features associated with perturbed cluster galaxies. This pipeline efficiently removes any contribution of the scattered light in the different science frames as demonstrated by the analysis of broad-band images taken during the the Next Generation Virgo Cluster Survey (NGVS; Ferrarese et al. 2012; Mihos et al. 2015). Pilot observations of the galaxy NGC 4569 (Boselli et al. 2016a) have shown that Elixir-LSB is perfectly suited for the NB frames whenever the images are background dominated, such as those under discussion. The photometric calibration in both filters was done following the procedures given in Fossati et al. (in prep.), with a typical uncertainty of 0.02–0.03 mag in both bands. A further check on the spectroscopic calibration of the images was done by comparing the emission in the NB filter to that obtained by MUSE on the ∼ 1 × 1 arcsec2 gas emitting region. This comparison gives consistent results within 3.5%. The astrometry of each single image was corrected using the MegaPipe pipeline (Gwyn 2008) before stacking.
2.2. X-rays imaging
Chandra observation of NGC 4424 were taken on April 17, 2017, with the Advanced CCD Imaging Spectrometer (ACIS). ACIS chip S3 is on the aimpoint (ObsID: 19408; PI: Soria). The image has no background flares and the clean time for the S3 chip is 14.6 ks. There were two XMM observations of NGC 4424. The first (0651790101; PI: Sun) was taken on June 13, 2010, but was completely ruined by background flares. The second (0802580201; PI: Sun) was gathered on December 5, 2017, with an integration time of 34 ks. After removing the background flares, the clean time is 14.1 ks for MOS1, 13.8 ks for MOS2, and 9.2 ks for PN. Because of the accelerated build-up of contamination on the optical blocking filter of ACIS/Chandra, the XMM data are much more sensitive than the Chandra data below 1.5 keV. Following Sun et al. (2010) and Ge et al. (2018), the X-ray data were reduced using the standard procedures with CIAO 4.10 and CALDB 4.7.9 (Chandra), and SAS 17.0.0 (XMM).
2.3. MUSE spectroscopy
The MUSE data were taken as part of the 097.D-0408(A) and 098.D-0115(A) programmes of the AMUSING supernova survey (Galbany et al. 2018). Observations were carried out using the Wide Field Mode in the spectral range 4800–9300 Å with a spectral resolution of 2.55 Å, corresponding to ∼50 km s−1 at Hα as described in Galbany et al. (2016) and Krühler et al. (2017). The data were gathered during two different runs, one in May 2016 with four dithered exposures 625 s long, and centred at ∼18 arcsec on the east of the nucleus of the galaxy, and the other in January 2017, again with four dithered exposures of 701 s, centred at ∼75 arcsec on the east of the nucleus. To secure a correct sampling of the sky on this extended galaxy, two exposures were taken with the telescope pointed on an empty region close to the galaxy. The observations were carried out in mostly clear sky conditions. The typical sensitivity of MUSE to low and extended surface brightness features at Hα is Σ(Hα) ∼ 4 × 10⁻¹⁸ erg s−1 cm−2 arcsec−2.
The MUSE data were reduced using a combination of in-house python procedures and the MUSE pipeline (Weilbacher et al. 2014), as first presented in Fumagalli et al. (2014) and later improved in Fossati et al. (2016) and Consolandi et al. (2017). These procedures perform the cube reconstruction using the daytime calibrations, and later improve the illumination spatial uniformity. The skylines subtraction is achieved with the Zurich Atmospheric Purge (ZAP, V1.0, Soto et al. 2016). Individual exposures are projected on a common output grid and are then combined with mean statistics. Lastly, the cube is smoothed by 10 × 10 spaxels in the spatial direction to improve the signal-to-noise ratio (S/N) of the spectra without compromising the image quality.
The stellar continuum is modelled and subtracted from the data cube using the GANDALF code (Sarzi et al. 2006), which uses the penalised pixel-fitting code (pPXF, Cappellari & Emsellem 2004). We only fit spaxels with a S/N per spectral channel greater than 5 and we used the MILES spectral library (Vazdekis et al. 2010), and we record the stellar kinematics from the best fit spectra. We fit the emission lines from the continuum subtracted cube using the KUBEVIZ software as detailed in Fossati et al. (2016). After fitting all the spaxels independently we flag as good fits those with a S/N > 5 for the Hα flux. In the present paper we also ran a new feature of the KUBEVIZ code that iteratively attempts to improve the unreliable fits using initial guesses obtained from the nearby good spaxels. With this method we obtained good fits for ∼ 2% more spaxels than with the original fitting method.
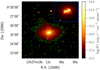 |
Fig. 2. Continuum-subtracted Hα image of NGC 4424 with contours at Σ(Hα) = 4 × 10⁻¹⁸ erg s−1 cm−2 arcsec−2. A prominent tail is visible in the north-east direction extending from the ionised gas halo. The inset shows a contrasted image of the central regions (here on an arbitrary surface brightness scale) with prominent filaments of ionised gas. |
Finally, we find no ionised gas emission in the eastern data cube and we find that the stellar kinematics fits are highly uncertain in this cube due to the very low surface brightness of the stellar continuum. For these reasons we only use the central field in the following analysis.
2.4. Fabry-Perot spectroscopy
High-resolution 3D spectroscopic observations of NGC 4424 were carried out using two different Fabry-Perot interferometers, SAM-FP on the 4.2 m SOAR telescope located at Cerro Pachón (Chile), and GHASP on the 1.93 m Observatoire de Haute Provence (OHP) telescope (France). SAM-FP, a Fabry-Perot mounted inside the SOAR telescope Adaptive-optics Module, is the only imaging Fabry-Perot interferometer which uses a laser-assisted ground layer adaptive optic over a 3 × 3 arcmin2 field-of-view (Mendes de Oliveira et al. 2017). SAM-FP is equipped with a single e2v CCD with 4096 × 4112 pixels with a 2 × 2 binned pixel of size 0.18 × 0.18 arcsec2. The observations were carried out in April 2017 during the commissioning of the instrument. The galaxy was observed with a 1 h exposure in dark sky under photometric conditions. Thanks to the Ground Layer Adaptive Optics (GLAO) module, the mean image quality is 0.55 arcsec. GHASP is a focal reducer including a Fabry-Perot providing a 5.8 × 5.8 arcmin2 field-of-view equipped with a 512 × 512 Imaging Photon Counting System (IPCS) with a pixel scale of 0.68 × 0.68 arcsec2 (Gach et al. 2002; Garrido et al. 2005). The galaxy was observed in dark sky time during photometric conditions, with a total exposure time of 4 h and a typical seeing of 3 arcsec. The free spectral range of the two Fabry-Perot instruments, 492 km s−1 and 378 km s−1 for SAM-FP and GHASP, were scanned through 36 and 32 channels, respectively. This provides a comparable spectral resolution of R ≃ 12000 at Hα. For both instruments, suitable 15 Å FWHM interference filters were used to select the spectral range of interest. The Ne I 6598.95 Å emission line was used for wavelength calibration. The line detection limits for the diffuse emission of both instruments after Voronoi binning is ∼ 2.5 × 10⁻¹⁷ erg s−1 cm−2 arcsec−2 at OHP and ∼ 5 × 10⁻¹⁷ erg s−1 cm−2 arcsec−2 at Cerro Pachón.
Fabry-Perot data were reduced following the standard procedures fully described in Daigle et al. (2006) and Epinat et al. (2008). Night-sky line subtraction was applied after data cube construction and wavelength calibrations. Using adaptive binning techniques based on 2D Voronoi tessellations applied to the 3D data cubes, we derived Voronoi Hα data cubes from which, among others, Hα maps, radial velocity, and velocity dispersion fields are computed. With the spatial adaptive binning technique, a bin accretes new pixels until it reaches an {a priori} criterion, which was fixed here to a S/N = 7 for the emission line within the bin for both sets of observations. The main advantage of this technique is that the best spatial resolution is obtained at each point of the galaxy and that no spatial contamination between the bins is possible, each bin corresponds to the same S/N and therefore has the same statistical weight.
3. Multifrequency data
3.1. Data
The galaxy NGC 4424 is located close to the core of Virgo and has been observed during several multifrequency surveys of the cluster. Deep GALEX ultraviolet images in the far-ultraviolet (FUV; λc = 1539 Å; integration time = 2008 s) and near-ultraviolet (NUV; λc = 2316 Å; integration time = 2009 s) bands were gathered during the GUViCS survey of the Virgo cluster (Boselli et al. 2011). The galaxy was also observed in the ugiz broad bands during the NGVS (Ferrarese et al. 2012), in the near-infrared H band (Boselli et al. 2000), in the mid-infrared by WISE (Wright et al. 2010), in the four IRAC bands by Spitzer (Ciesla et al. 2014), and in the far-infrared by Spitzer with MIPS at 24, 70, and 160 μm (Bendo et al. 2012) and by Herschel with PACS at 100 and 160 μm (Cortese et al. 2014) and SPIRE at 250, 350, and 500 μm (Ciesla et al. 2012) as part of the Herschel Reference Survey (HRS; Boselli et al. 2010) and the Herschel Virgo Cluster Survey (HeViCS; Davies et al. 2010). The images of the galaxy in different photometric bands, including the continuum-subtracted NB Hα, the FUV, NUV, u, IRAC1 3.6 μm, and the MIPS 24 μm bands, are shown in Fig. 3. High-quality images of the galaxy in the visible were also obtained with the WFC3 on the HST by Silverman et al. (2012; Fig. 4). HI VLA, KAT-7, and WSRT data of NGC 4424 are available from Chung et al. (2009) and Sorgho et al. (2017). VLA radio continuum data at 6 cm and 20 cm, including polarisation, are also available (Vollmer et al. 2013).
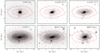 |
Fig. 3. Multifrequency images on the same scale of the galaxy NGC 4424. Upper panels, from left to right: continuum-subtracted Hα (VESTIGE), FUV (GALEX), NUV (GALEX); lower panels: u (NGVS), IRAC 3.6 μm (Spitzer), MIPS 24 μm (Spitzer). Red contours are drawn from the u-band image at 22nd, 24th, and 26th mag arcsec−2 and highlight the truncation of the disc at different wavelengths. |
3.2. Image analysis
A first glance at the new images presented in this paper clearly shows the peculiar morphology of the galaxy at all wavelengths, although with some remarkable differences with respect to what was found in previous works. First of all, the very deep NGVS images (Figs. 1 and 3) do not show any of the fine structures generally interpreted as a proof of a recent merging event (shells, rings, plumes, tails) in the stellar component in the outer regions (e.g. Duc et al. 2011). We recall that these NGVS images were gathered and reduced using Elixir-LSB, a pipeline especially tailored to detect extended low surface brightness features (Ferrarese et al. 2012; Paudel et al. 2017). Fine structures in the stellar component are not detected down to a surface brightness limit of μg ≃ 29 mag arcsec−2. The excellent HST image of the inner region not only confirms a perturbed morphology, but also shows plumes and filaments of dust in absorption located along the major axis of the galaxy or perpendicular to it (Fig. 4). A peculiar distribution of the dust emission is also revealed for the first time by the 24 μm MIPS/Spitzer image (Fig. 3). This figure shows a ≃ 5 kpc filament (projected length) extending from the nucleus to the north-north-east. The 3.6 μm IRAC/Spitzer image (Fig. 3), sensitive to the distribution of the old stellar population, shows an elongated feature slightly misaligned with respect to the major axis, with a prominent compact structure at the western edge and another in the centre.
Thanks to their excellent quality in terms of sensitivity and angular resolution, the very deep VESTIGE continuum-subtracted NB Hα image shows several features never observed before:
- (1)
a spectacular tail of ionised gas in the north-east ≃ 10 kpc long (projected length) extending from the central star forming region (Figs. 1 and 2). This feature, which corresponds to the one detected at 24 μm (Fig. 3) and with a typical surface brightness of Σ(Hα) ≃ 4 × 10⁻¹⁸ erg s−1 cm−2 arcsec−2, is diffuse and does not contain clumpy spots indicating the presence of HII regions. The star formation activity is present only in the central ≃ 3 kpc2 region and is mainly located along the thin elongated structure visible in the near-infrared, and in particular at its edges. There are, however, a few blobs of star formation south to the nucleus outside the stellar disc;
- (2)
filaments of ionised gas perpendicular to the star forming bar extending up to ≃ 1.5 kpc;
- (3)
a low surface brightness (Σ(Hα) ≃ 4 × 10⁻¹⁸ erg s−1 cm−2 arcsec−2) diffuse halo extending along the major axis of the galaxy up to ≃ 6–7 kpc from the nucleus. The lack of any structured feature suggests that this emission is due to the diffuse gas ionised by the radiation escaping from the nuclear starburst or that it is gas shock-ionised by the ram pressure stripping event (see Sect. 4.1.2). The activity of star formation in the outer disc is thus completely quenched.
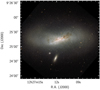 |
Fig. 4. HST colour image of the galaxy NGC 4424, showing a perturbed morphology at an unequaled sensitivity and angular resolution, with plumes and filaments of dust in absorption located along the major axis of the galaxy or perpendicular to it. |
4. Physical parameters
4.1. Narrow-band imaging
4.1.1. Galaxy
The VESTIGE data can be used to estimate the total Hα luminosity of the galaxy and of the tail of ionised gas detected in the north-eastern direction. The total Hα flux of the galaxy including its extended tail is log f(Hα + [NII]) = −12.12 ± 0.02 erg s−1 cm−2, where the uncertainty on the flux was measured after deriving the uncertainty from the sky background on an aperture similar to the size of the galaxy in 100 regions randomly located on the frame around the target. Assuming a typical [NII]λ6583 Å/Hα = 0.36 and a Balmer decrement Hα/Hβ = 4.45 as measured from the MUSE data in the central field (see Sect. 4.3), the total extinction-corrected Hα luminosity of the galaxy is L(Hα) = 4.50 ( ± 0.21) × 1040 erg s−1, which corresponds to a SFR = 0.25 ± 0.04 M⊙ yr−1 assuming the escape fraction and the fraction of ionising photons absorbed by dust before ionising the gas to be zero (Boselli et al. 2009), the Kennicutt (1998) SFR − L(Hα) calibration, and a Chabrier (2003) IMF.
4.1.2. Diffuse tail
We also measured the total Hα emission in the tail of ionised gas within a box of size 77 × 32 arcsec2, PA = −30 deg, centred at RA = 12:27:13.56; Dec = +9:26:17.1 obtaining log f(Hα + [NII]) = −13.85 ± 0.19 erg s−1 cm−2. The lack of IFU data in this low surface brightness region prevents us from having an accurate estimate of the [NII] contribution and of the Balmer decrement. The BPT diagram analysed in Sect. 4.3 indicates that the [NII]-to-Hα ratio increases in the outer regions of the galaxy where it reaches [NII]λ6583 Å/Hα ≃ 1.0 probably because of the shock-ionised gas. The MUSE map of the Balmer decrement indicates that in these outer regions Hα/Hβ ≃ 4.5 (A(Hα) ≃ 1.2 mag). Assuming that these ratios are also valid in the diffuse extraplanar tail, where the gas is supposedly shock-ionised and dust might be present as indicated by the extended 24 μm emission, we estimate that the total Hα luminosity of the northern diffuse component is L(Hα) ≃ 5.34 (±2.34) × 1038 erg s−1. Using relation (2) in Boselli et al. (2016a), and assuming a filling factor f = 0.1 and a gas distributed within a cylinder of diameter ( ≃ 2.6 kpc) and height ( ≃ 7 kpc) similar to the deprojected rectangular box used for the flux extraction in the tail, we obtain a rough estimate of the typical gas density in the tail, ne ≃ 7 × 10⁻² cm−3, with a corresponding total ionised gas mass Mtail(Hα) ≃ 6.0 × 10⁶ M⊙, to be compared to the HI mass in the tail, Mtail(HI) ≃ 5.1 × 10⁷ M⊙ (Sorgho et al. 2017). We can also estimate the typical recombination timescale for the diffuse gas by using Eq. (5) in Boselli et al. (2016a): trec ≃ 1.4 Myrs.
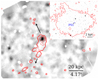 |
Fig. 5. Adaptively smoothed 0.4–1.3 keV XMM image of the NGC 4424 with the HI contours (from Chung et al. 2009) superposed. Bright X-ray point sources outside of the galaxy are masked. No soft X-ray enhancement is observed in the position of the HI tail. The two arrows at the north and south of the galaxy point towards the centre of Virgo cluster A and B, respectively. Their length is proportional to the distance to M 87 and M 49. The zoomed-in region at the upper right shows the Chandra 0.5–7 keV image of the galaxy, with the Hα contours (as in Fig. 2) superposed. The small blue circle with a radius of 2″ shows the putative nuclear position without a corresponding X-ray source. An obscured X-ray source 4.9″ to the south-east of the nucleus (PS1) is detected by Chandra. |
4.2. X-ray imaging
Figure 5 shows the XMM and Chandra images of NGC 4424. The putative nucleus is undetected by Chandra. Assuming a power law model with a photon index of 1.7, the 3σ upper limit of the 2–10 keV luminosity is 5.6 × 1037 erg s−1 for an absorption column density of 1.7 × 1020 cm−2 (Galactic absorption). As a significant amount of intrinsic absorption is expected in NGC 4424, the 3σ upper limit becomes 6.6 × 1037 erg s−1 and 1.5 × 1038 erg s−1 for an absorption column density of 10 times and 100 times greater than the Galactic value, respectively. The expected super massive black hole (SMBH) mass of NGC 4424 derived using the Marconi & Hunt (2003) relation is ∼ 2.4 × 10⁷ M⊙. Thus, in NGC 4424 the SMBH is quiescent and has an Eddington ratio of < 10−6. There is indeed an X-ray source 4.9″ to the south-east of the nucleus (PS1 in Fig. 5). It is only detected in 2–7 keV, suggesting that it is obscured. Its X-ray hardness ratio is consistent with an absorption column density greater than 2.5 × 1022 cm−2. The 2–10 keV luminosity is 4.3 × 1038 erg s−1 for an absorption column density of 2.5 × 1022 cm−2 and 1.1 × 1039 erg s−1 for an absorption column density of 1023 cm−2. If it is associated with NGC 4424, this point source can be an X-ray binary (almost an ultraluminous X-ray source in that case) or the nucleus of a merged galaxy.
As shown in Fig. 5, the HI tail is undetected in X-rays. The 3σ upper limit of the 0.4–1.3 keV emission in the HI tail can be estimated from the XMM data, and is 4.1 × 10⁻¹⁶ erg s−1 cm−2 arcmin−2 and 4.8 × 10⁻¹⁶ erg s−1 cm−2 arcmin−2 for an assumed gas temperature of 0.6 keV and 0.3 keV, respectively. The resulting X-ray bolometric luminosity of the tail is thus at least 370–700 times smaller than that of ESO 137-001 (Sun et al. 2010). Although the mixing of the cold gas stripped from the galaxy with the hot ICM enhances the soft X-rays emission within the tail, the ambient pressure, which in the position of NGC 4424 is ∼100 smaller than around ESO 137-001 (see Sect. 5.4), is not sufficient to make the tail detectable with the existing X-ray observations (Tonnesen et al. 2011).
4.3. Spectroscopy
4.3.1. Line ratios
The MUSE data can be used to derive the typical properties of the ISM. The Balmer decrement shown in Fig. 6 traces the dust attenuation in the Balmer lines. The Hα-to-Hβ ratio ranges from ≃ 7 in the western peak of Hα emission (A(Hα) ≃ 2.3 mag) to ≃ 3 in the diffuse gas (A(Hα) ≃ 0.1 mag). It is worth noting that the eastern peak of Hα emission does not match the peak of dust attenuation which is located further out ( ≃ 0.3 kpc) along the elongated structure dominating the ionised gas emission.
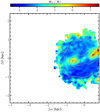 |
Fig. 6. Spaxel distribution of the Balmer decrement Hα/Hβ derived from the MUSE pixels with S/N > 5. The cross indicates the position of the nucleus, the grey contours the distribution of the Hα emitting gas (contour levels are Σ(Hα) = 5 × 10⁻¹⁷ − 10−16 erg s−1 cm−2 arcsec−2). |
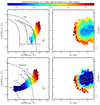 |
Fig. 7. Line diagnostic BPT diagrams log([OIII]λ5007/Hβ) vs. log ([NII]λ6583/Hα) (upper left panel) and log([OIII]λ5007/Hβ) vs. log ([OI]λ6300/Hα) (lower left panel) derived from MUSE pixels with S/N > 5. The different points are colour-coded according to their distance from the dashed lines defined by Kauffmann et al. (2003; upper panels) and Kewley et al. (2001; lower panels) to separate AGN from star forming regions. The grey contours show the distribution of a random sample of nuclear spectra of SDSS galaxies in the redshift range 0.01–1 and stellar mass 109–1011. The solid thick lines in the upper left panel show the expected behaviour of star forming regions as derived from the photo-ionisation models of Kewley et al. (2001) for three different metallicities (0.2, 0.4, 1 Z⊙). Lower left panel: shock models of Rich et al. (2011) for increasing shock fraction (from left to right) in a twice solar gas. Right panels: distribution of the same points colour-coded as in the left panels over the disc of the galaxy. The cross shows the centre of the galaxy, the grey contours the distribution of the Hα emitting gas. |
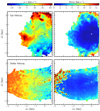 |
Fig. 8. Velocity field (left panels) and error maps (right panels) of the gaseous (upper panels) and stellar (lower panels) components derived from the MUSE data. The black and white crosses indicate the position of the nucleus, the grey contours the distribution of the Hα emitting gas. |
The [SII]λ6716/6731 line ratio, a direct tracer of the gas density, is always fairly high, with the lower values found on the two bright Hα nuclei, where [SII]λ6716/6731 ≃ 1.2–1.3, corresponding to gas densities ne ≃ 150 cm−3, while [SII]λ6716/6731 ≃ 1.4–1.5 in the diffuse gas (ne ≲ 30 cm−3) (Osterbrock et al. 2006; Proxauf et al. 2014). Line measurements can also be used to derive the metallicity of the gas. Using the calibration of Curti et al. (2017) based on the [OIII], Hβ, [NII], and Hα lines, we obtain typical metallicities ranging from 12 + log O/H ≃ 8.65 in the outer gas to 12 + log O/H ≃ 8.8 in the inner regions. These values are comparable to those derived for galaxies of similar stellar mass (e.g. Hughes et al. 2013).
The spectroscopic data can also be used to derive several line diagnostic diagrams such as those proposed by Baldwin et al. (1981; BPT diagrams). These diagrams, shown in Fig. 7, can be used to identify the dominant ionising source of the gas. Figure 7 shows that the gas is photo-ionised by the young stars in the inner regions, while it is shock-ionised in the outer ones. The high cut in the S/N ratio in all the emission lines used in the two diagrams (S/N > 5) and the agreement in the [OIII]/Hβ versus [NII]/Hα, [OIII]/Hβ versus [OI]/Hα, and [OIII]/Hβ versus [SII]/Hα (not shown here) BPT diagrams secure this result against systematic effects in the data. Figures 7 and 5 do not show the presence of any hard ionising source near the nucleus, suggesting a very low accretion rate despite the abundant cold material in the nuclear region (Cortés et al. 2006).
4.3.2. Stellar kinematics
Figure 8 shows the stellar kinematics derived using the MUSE data (lower left panel). The stellar velocity field of NGC 4424, although showing a gradient from the nucleus to the eastern regions3 of ≃ 40 km s−1, does not have the typical shape of a rotating disc for a spiral galaxy inclined ∼60 deg on the plane of the sky with a steep gradient in the inner regions. Furthermore, this rotation (vel ≃ 85 km s−1 when corrected for inclination) is significantly smaller than that expected for a rotating system of similar stellar mass (Mstar ≃ 1010.17 M⊙; vel ≃ 200 km s−1) as indeed noticed by Kenney et al. (1996), Rubin et al. (1999), Coccato et al. (2005), and Cortés et al. (2015). The superior quality of the MUSE data allows us to reconstruct the stellar velocity field down to one arcsec angular resolution (≃80 pc). This stellar velocity field shows a kinematically decoupled structure on the elongated feature emitting in Hα and in the nucleus of the galaxy not seen in previous data. This feature suggests that the stellar component associated with the nuclear starburst has a different origin than the outer disc.
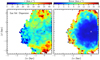 |
Fig. 9. Velocity dispersion (left panel) and error maps (right panel) of the gaseous component derived from the MUSE data. The cross indicates the position of the nucleus, the grey contours the distribution of the Hα emitting gas. |
4.3.3. Gas kinematics
Figure 8 also shows the velocity of the gas derived using the MUSE data (upper panel), while its velocity dispersion is shown in Fig. 9. The MUSE data suggest that the gas is rotating at large scales along the major axis as the stellar component, although with a slightly steeper gradient. We expect that the same rotation of the two components is present on the western side where MUSE data are unfortunately unavailable, as indeed suggested by the CO velocity field of Cortés et al. (2006). As for the stellar component, in the inner region we do not see any steep gradient in the gas component along the major axis, as expected in a massive unperturbed system. The two dominant Hα emitting regions located to the east and west of the stellar nucleus are at approximately the same line-of-sight velocity (≃−10 km s−1, see Fig. 10), suggesting that the elongated structure to which they belong is not a rotating bar. Between these two Hα emitting regions there is a rather narrow (50 pc) north–south filament in the velocity field displaying a higher mean line-of-sight velocity (≃ 30 ± 10 km s−1) surrounded by velocities closer to those of the dominant Hα blobs than to that of the filament. This filament is also present in the MUSE data. The kinematical data suggest that this high-velocity filament might be in a different plane than the low-velocity component embedding the two dominant Hα emitting regions.
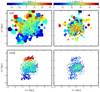 |
Fig. 10. Velocity field (left panels) and velocity dispersion (right panels) of the gaseous component as derived from the OHP (upper panels) and SOAR (lower panels) Fabry-Perot observations. The black and white crosses indicate the position of the nucleus, the grey contours the distribution of the Hα emitting gas. |
Figures 8 and 10 consistently indicate that there is a systematic difference in velocity between the northern (≃ + 50 km s−1) and the southern regions (≃ − 30 km s−1), suggesting the presence of a second gas component. Figure 9 also indicates that in these outer regions the velocity dispersion of the gas is fairly high (≃ 80 km s−1). This second component might be gas rotating along the minor axis (Coccato et al. 2005), as well as gas infalling or outflowing from the nucleus, depending on the orientation of the galaxy disc on the plane of the sky. The line-of-sight overlapping of the minor axis component on the major axis gas could explain why in the inner regions we do not observe a velocity gradient along the major axis. The high spectral resolution Fabry-Perot data ( ≃ 5 km s−1) do not show multiple profiles, suggesting that the two gaseous components are well mixed within this inner region.
5. Discussion
5.1. SED fitting
The Hα image of NGC 4424 obtained during the VESTIGE survey clearly indicates that the activity of star formation is present only within the inner ∼1.5 × 1.5 kpc2 region, while it is totally quenched in the outer disc. Figure 3 also shows that the colour gradually increases with galactic radius (the size of the stellar disc increases with wavelength). The lack of diffuse dust in the outer regions, shown by the 24 μm image, indicates that the radial reddening of the disc is not due to dust attenuation, but is instead produced by the ageing of the stellar population. The VLA HI data suggest that the atomic gas in the outer disc was removed during a ram pressure episode. The lack of gas has induced the decrease in star formation activity. We use the spectro-photometric data to measure the epoch when the activity was quenched by the interaction with the ICM. This is done by dating the last episode of star formation in the outer disc. To this end, we fitted the FUV to far-IR SED of the galaxy extracted in three distinct 0.5×0.5 arcmin2 regions (2.5×2.5 kpc2) located along the major axis of the galaxy, as depicted in Fig. 11. These regions were defined to be representative of the inner star forming region and of the outer quenched disc. Fluxes and uncertainties were measured within these regions using the same procedures described in Fossati et al. (2018) and Boselli et al. (2018b).
To quantify the time elapsed since the truncation of the star formation activity we followed the same procedure given in Boselli et al. (2016b), i.e. we used an abruptly truncated star formation law and the following free parameters: the rotational velocity of the galaxy, the quenching age QA (epoch when the quenching of the star formation activity started to occur), and the quenching factor QF (QF = 0 for unperturbed SFR, QF = 1 for a totally quenched SFR). The SED of the galaxy was fitted with CIGALE (Noll et al. 2009; Boquien et al. 2018) using Bruzual & Charlot (2003) stellar population models derived with a Chabrier IMF for the stellar continuum and the Draine & Li (2007) models for the dust emission. To represent the observed SED, we used the two GALEX FUV and NUV bands, the optical NGVS and VESTIGE ugriz bands, a Calar Alto near-infrared observation in the H band, the four IRAC bands, the MIPS 24 μm image, the PACS images at 100 and 160 μm, and the SPIRE 250 and 350 μm bands (17 photometric bands). We excluded from the analysis the WISE bands, the MIPS bands at longer wavelengths, and the SPIRE 500 μm band for their lower sensitivity and/or lower angular resolution to avoid any possible contamination within the selected regions. Given their size, we did not apply any aperture correction. As in Boselli et al. (2016b) we included the Hα emission by measuring the number of ionising photons from the VESTIGE image. The observed Hα + [NII] flux measured within the central region was corrected for dust attenuation and [NII] contamination using the mean values derived from the MUSE data (see Sect. 4.3). We also included in the fit the age-sensitive Hβ absorption line (Poggianti & Barbaro 1997) by measuring its contribution within a pseudo-filter as in Boselli et al. (2016b). This was done using a light-weight mean spectrum derived from the MUSE data cube in the central and eastern regions.
 |
Fig. 11. Far-UV to far-IR SED of the three selected regions along the disc of NGC 4424 (from east to west). In each panel the observational data and their error bars are indicated with red filled dots, the upper limit with a blue triangle; the black solid line shows the best fit model. The inset shows the colour gri RGB image of the galaxy; overlayed are the red boxes indicating the three fields used to study the SED with the CIGALE fitting code. |
 |
Fig. 12. Best model fit obtained with CIGALE (black) is compared to the MUSE spectrum (red) in the Hβ line after emission is removed using GANDALF. The best model has been shifted on the y-axis to match the observed spectrum. |
Results of the SED fitting
The results of the fit are shown in Figs. 11 and 12 and summarised in Table 2. The quality of the fit is satisfactory in the two outer regions, and good in the centre of the galaxy. The best fit models perfectly match the age-sensitive Hβ absorption line in the eastern and central regions where MUSE data are available. The fitted model indicates that the activity of star formation was totally quenched (QF = 1) in the outer disc ≃ 250–280 Myr ago. These numbers are consistent with those derived by Crowl & Kenney (2008) using Balmer absorption indices extracted from IFU spectroscopy or the GALEX FUV–NUV colour index in the outer disc in the eastern direction (275 ± 75 Myr), although with a much better accuracy thanks to our larger number of photometric (17) and spectroscopic (2) bands and to the more refined SED fitting technique. To test the reliability of the output parameters of the fit, and in particular of the quenching ages and quenching factors given above, following Boselli et al. (2016b) we created a mock catalogue by introducing some extra noise into the observed data, randomly distributed according to a Gaussian curve of dispersion similar to the median error in each band, and re-fitted the data using the SED models. The output of the fit on the mock catalogue gives again QF = 1 and QA values consistent within ≃ 6%, confirming that the determination of these parameters is robust. The fit also suggests that, in the central region, the activity of star formation was reduced by 79% approximately 180 Myr ago. The mock analysis suggests that while in this region QF is fairly well constrained, the uncertainty on the quenching age QA is very large. Furthermore, this value should be considered with caution given that the parametrised star formation history used to trace the evolution of NGC 4424 is not optimal for the inner region, which has probably suffered from two competitive mechanisms, a quenching episode (during the ram pressure stripping event) and a starburst (during the merging event) which might last 10–100 Myr (Cortijo-Ferrero et al. 2017). This very peculiar and changing star formation history is reproducible with difficulty using a simple SED fitting technique like the one adopted for the outer disc. To conclude, the overall star formation activity of NGC 4424 was significantly reduced after the gas stripping episode, moving the galaxy below the main sequence relation of unperturbed objects (Boselli et al. 2016b).
5.2. Ram pressure stripping
The presence of a long (∼110 kpc in projected distance) symmetric HI tail of gas is clear evidence that the galaxy is undergoing a ram pressure stripping event (Chung et al. 2007; Sorgho et al. 2017). The relative orientation of the galaxy and the position of the tail on the plane of the sky combined with a relatively low recessional velocity with respect to the mean velocity of the cluster (〈velcluster A – velN4424〉 ∼ 500 km s−1) also indicate that the stripping event is occurring almost face-on, making it particularly efficient at removing the gas from the outer regions producing truncated gaseous discs (Quilis et al. 2000; Roediger & Brüggen 2006, 2007; Tonnesen & Bryan 2009). Given its accurate distance estimate of ≃ 15.5–16 Mpc (Munari et al. 2013; Cantiello et al. 2018; Hatt et al. 2018), the galaxy is now in the foreground of the cluster (16.5 Mpc). It has thus probably already crossed the southern envelopes of Virgo cluster A coming from the south-eastern region behind the cluster and moving in the north-west direction in front of it. The lack of gas quenches the activity of star formation outside-in, also producing truncated discs in the young stellar populations (Boselli et al. 2006; Fossati et al. 2018). The SED fitting analysis presented in the previous section indicates that the quenching episode is relatively recent ( ≃ 250–280 Myr ago). This timescale can be compared with the time necessary for the galaxy to travel within the cluster to form an HI tail of ≃ 110 kpc. Assuming the typical velocity dispersion measured within Virgo cluster A (σcluster A = 800 km s−1; Boselli et al. 2014c), this timescale is tHI ≃ 140 Myr, just a factor of ∼2 shorter than the typical quenching time. These numbers are fairly consistent considering that (i) the total extension of the HI tail can be underestimated for sensitivity reasons and (ii) the cold atomic gas, once stripped and in contact with the hot intracluster medium can change phase becoming ionised gas or hot plasma via heat conduction, as indeed observed in the majority of cluster galaxies (e.g. Boselli & Gavazzi 2014; Boselli et al. 2016a; Yagi et al. 2017; Gavazzi et al. 2018). Within the stellar disc the gas can be shocked-ionised by the stripping process, as observed in the outer regions of the MUSE field (Fig. 7). The significant difference between the HI mass in the tail measured by Sorgho et al. (2017; Mtail(HI) ≃ 5.1 × 10⁷, M⊙) and that of the stripped gas derived from the HI-deficiency parameter (HI-def = 0.98; Boselli et al. 2014a, thus Mstripped(HI) ≃ 2 × 10⁹ M⊙) supports this interpretation.
5.3. Merging
The morphological and kinematical properties of NGC 4424 also suggest that the galaxy has undergone a more violent gravitational perturbation (Kenney et al. 1996; Cortés et al. 2006, 2008, 2015). Although the presence of fine structures witnessing an old major merging event is not confirmed in our NGVS data, the perturbed and decoupled kinematics of both the gas and stellar components unquestionably indicate an unrelaxed object. In this regard, we recall the decoupled kinematics of the stellar component along the elongated star forming structure with respect to the slowly rotating stellar disc revealed by MUSE. Simulations suggest that unequal-mass merger remnants might result in systems with a spiral-like morphology but elliptical-like kinematics (Bournaud et al. 2004), characteristics similar to those observed in NGC 4424: a grand-design spiral morphology (Fig. 1) and a low rotational velocity compared to the velocity dispersion of both the gas and the stellar components. The fact that the gas is still turbulent and not stabilised over the disc suggests that the merging event is relatively recent (tmerging ≲500 Myr). Considering that the typical crossing time of Virgo is ≃ 1.7 Gyr (Boselli & Gavazzi 2006), this means that the merging episode occurred once the galaxy was already within the Virgo cluster. We recall that in massive clusters such as Virgo (MVirgo ≃ 2−4 × 10¹⁴ M⊙, Paper I, and references therein) the high-velocity dispersion (σVirgo ≃ 800 km s−1) makes merging events among intermediate-mass galaxies very unlikely (Boselli & Gavazzi 2006).
5.4. The nature of the northern ionised gas tail
The presence of a tail of ionised gas in the northern direction, thus in the direction opposite to the direction of the HI gas tail, is hard to explain in a simple ram pressure stripping scenario. The kinematics of the gas over the plane of the disc, as mentioned in Sect. 4.3, can be interpreted as being due to (i) a rotating gas ring, (ii) infalling, or (iii) outflowing gas. It is hard to discriminate between these different scenarios, in particular because the peculiar morphology of the galaxy prevents us from determining the orientation of the stellar disc on the plane of the sky. There are, however, a few arguments suggesting that this ionised gas tail results from an outflow:
- (a)
The morphology of the inner regions is similar to that observed in other starburst galaxies such as M82 or the Circinus galaxy: the Hα emitting gas shows promi-nent filaments perpendicular to the stellar disc (Fig. 2) and dust filamentary structures (Fig. 4) in the inner regions, while extended tails in Hα (Fig. 2) and in the mid-IR (Fig. 3) on large scales (up to 10 kpc) are also present in these iconic objects (Elmouttie et al. 1998a,b; Shopbell & Bland-Hawthorn 1998; Alton et al. 1999; Wilson et al. 2000; Engelbracht et al. 2006).
- (b)
The velocity dispersion of the gas increases from the centre of the galaxy along the minor axis, reaching values as high as ≃ 80 km s−1 at ≃ 2 kpc from the disc (e.g. Cresci et al. 2017; López-Cobá et al. 2017).
- (c)
The galaxy has two extended radio continuum lobes and a magnetic field perpendicular to the stellar disc, interpreted by Vollmer et al. (2013) as evidence of outflow.
- (d)
The flat radio continuum spectral index (α = −0.26; Vollmer et al. 2013) and the BPT diagram (Fig. 7) consistently indicate that the source of energy is a nuclear starburst. The energy of this starburst, although now limited (SFR = 0.25 M⊙ yr−1), could have been sufficient to overcome the gravitational forces also thanks to the perturbed gravitational potential well of the galaxy and to eject matter in the direction perpendicular to the disc. Following Boselli et al. (2016a) we can make a rough estimate of the total energy (potential and kinetic) of the outflow, Eout ≃ 1.7 × 1055 erg s−1. This energy can be produced by 1.7 × 10⁴ supernovae, or a larger number if we assume a more realistic 1–10% energy transfer efficiency, associated with a nuclear star cluster of stellar mass ≳3.7 × 10⁶ M⊙ and to a star formation rate ≳3.7 M⊙ yr−1, a star formation rate comparable to that in the galaxy before the quenching episode (Sect. 5.1). As remarked in Boselli et al. (2016a), however, ram pressure can produce low-density superbubble holes and can thus supply extra energy to the outflow through Kelvin-Helmholtz instabilities (Roediger & Hensler 2005) and viscous stripping (Roediger & Brüggen 2008).
- (e)
The presence of a nuclear outflow might decouple the rotation of the stellar disc from the kinematics of the gas which becomes turbulent, as indeed observed in blue compact galaxies (Östlin et al. 2004).
- (f)
The recombination time of the gas within the tail is very low (trec ≃ 1.4 Myrs). It is thus unlikely that it remains ionised if it is gas orbiting along the minor axis or if it is infalling gas given the lack of any ionising source in these regions. In the case of an outflow, the gas can be ionised by the central starburst or by the diffuse hot gas emitting in X-rays via heat conduction. The BPT diagram shown in Fig. 7, however, indicates that at the periphery of the central star forming region detected by MUSE the gas is mainly shock-ionised probably by the ram pressure episode.
- (g)
The outflow has sufficient kinetic energy to overcome the external pressure of the ICM (p(RP) if
 (1)
(1)where pout is the pressure within the outflow. A rough estimate of pout can be derived as
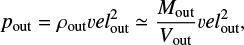 (2)
(2)where Vout is the volume, Mout the mass, and velout the velocity of the outflow. As described in Sect. 4.1.2, the mass of the outflow is Mout = 6 × 10⁶ M⊙ and its volume Vout = 3.9 × 1066 cm3. We do not have any estimate of the velocity of the gas up to 10 kpc from the galaxy disc, but we can extrapolate it from the MUSE data (Sect. 4.3.2, Fig. 8): the gas velocity gradually increases from 0 km s−1 to
 at ≃ 2 kpc from the galaxy disc, and might thus reach
  km s−1 at the edge of the observed outflow (10 kpc). This velocity is close to the escape velocity of the galaxy, which we estimate as in Boselli et al. (2018b) at νe ≃ 700 km s−1. The mean pressure exerted by the outflow on the surrounding medium should thus be pout ≃ 7.5 × 10⁻¹² dyn cm−2. Considering the typical velocity of the galaxy within Virgo cluster A (vel = 800 km s−1, Boselli et al. 2014c), and estimating the density of the ICM in the position of NGC 4424 (at a physical distance of 1.3 Mpc from M 87) using Planck and Suzaku data from Simionescu et al. (2017), we obtain ne(rN4424) = 3 × 10⁻⁵ cm−3 and pRP = 6.2 × 10⁻¹³ dyn cm−2.
The accurate distance estimate (15.5–16.0 Mpc) and its relative velocity of ≃ − 500 km s−1 with respect to M 87 place the galaxy in the foreground of the cluster and suggest that it has probably crossed the periphery of Virgo coming from the south-east and moving towards the north-west. If the Hα tail is an outflow, the upper edge of the disc is the one closest to us. The Hα tail, like the HI tail, is bent to the east because of the motion of the galaxy along the line of sight. The line-of-sight velocity of the HI gas in the tail is veltail(HI) = 453 km s−1, slightly higher than that of the HI gas over the stellar disc (veldisc(HI) = 433 km s−1; Sorgho et al. 2017), again suggesting that the gas was lost while the galaxy was approaching from the cluster background, as has indeed been observed in other ram pressure stripped galaxies (Fumagalli et al. 2014). Remarkably, the ionised gas in the z-plane in the south of the galaxy disc, as observed by MUSE and by the Fabry-Perot observations, has a lower line-of-sight velocity than the galaxy, again suggesting that the outflow overcomes the ram pressure stripping process also in this southern region.
The new result of this analysis is that despite a moderate nuclear star formation activity probably induced by the infall of fresh gas accreted after a recent merging event, the galactic winds produced in the star forming regions are able to overcome the ram pressure stripping process and drag the gas out from the disc of the galaxy from the nuclear regions even in the direction opposite to that of the motion within the cluster. This picture is fairly consistent with the prediction of cosmological simulations and semi-analytic models in a starvation scenario (e.g. Larson et al. 1980), where the removal of the hot halo once the galaxy becomes a satellite of a larger dark matter structure makes the feedback process more efficient in removing the cold gas from the galaxy disc and quenching the activity of star formation (e.g. De Lucia 2011). It must be noted, however, that as in NGC 4569 (Boselli et al. 2016a) the amount of ionised gas ejected by feedback is between one and two orders of magnitude lower than that removed by the ram pressure mechanism.
6. Conclusion
NGC 4424 is a peculiar galaxy located at ∼0.6R200 from the Virgo cluster centre. New very deep NB Hα imaging data acquired during the VESTIGE survey have revealed the presence of a ∼10 kpc tail (projected distance) of ionised gas perpendicular to the stellar disc. This newly discovered tail is located in the direction opposite to the ∼ 110 kpc long HI tail observed at 21 cm, and is generally interpreted as clear evidence of an ongoing ram pressure stripping event. The detailed analysis of this object based on multifrequency data covering the whole electromagnetic spectrum, from the X-rays to the radio continuum, including high- and medium-resolution Fabry-Perot and MUSE spectroscopic data, consistently indicate that the galaxy is indeed being subjected to an ongoing ram pressure stripping event able to remove the gas from the outer disc and quench the activity of star formation on timescales of ∼250–280 Myr. The galaxy, however, has also been perturbed by a recent merging event. This gravitational perturbation, as suggested by simulations, might have contributed to making the ram pressure stripping event more efficient than in other cluster galaxies. The tail of ionised gas observed in the opposite direction than the HI tail probably results from a nuclear outflow fed by the collapse of the gas in the central regions after the merging episode. Despite a moderate nuclear star formation activity, the outflow produced by the starburst is able to overcome the ram pressure stripping force and contribute to the exhaustion of the gas in the inner regions. This observational result is the first evidence that the feedback process generally invoked by cosmological simulations and semi-analytic models (e.g. De Lucia 2011) in a starvation scenario (e.g. Larson et al. 1980) might contribute to remove gas from galaxies once they become satellites of a larger dark matter structure. As observed in other cluster objects, however, the amount of gas expelled by feedback seems to be only a small fraction of that removed via ram pressure stripping, thus suggesting that feedback plays only a minor role in quenching the activity of star formation of galaxies in high-density environments.
Consistently with other VESTIGE works, throughout this work we assume for NGC4424 a distance of 16.5 Mpc, as for all galaxies within the Virgo cluster A substructure (Gavazzi et al. 1999; Mei et al. 2007).
Hereafter we refer to the Hα+[NII] band simply as Hα, unless otherwise stated.
The velocity does not seem to increase in the eastern disc mapped by the second field of MUSE. The low S/N in this outer region prevents us from deriving an accurate stellar velocity field.
Acknowledgments
Based on observations obtained with MegaPrime/MegaCam, a joint project of CFHT and CEA/DAPNIA, at the Canada-French-Hawaii Telescope (CFHT) which is operated by the National Research Council (NRC) of Canada, the Institut National des Sciences de l’Univers of the Centre National de la Recherche Scientifique (CNRS) of France and the University of Hawaii. Based on observations obtained with XMM-Newton, an ESA science mission with instruments and contributions directly funded by ESA Member States and NASA. Based on observations made with ESO Telescopes at the La Silla Paranal Observatory under programme IDs 097.D-0408(A) and 098.D-0115(A). Based on observations collected at the Observatoire de Haute Provence (OHP) (France), operated by the CNRS. Based on observations obtained at the Southern Astrophysical Research (SOAR) telescope, which is a joint project of the Ministério da Ciência, Tecnologia, Inovações e Comunicações do Brasil (MCTIC/LNA), the US National Optical Astronomy Observatory (NOAO), the University of North Carolina at Chapel Hill (UNC), and Michigan State University (MSU). We are grateful to the whole CFHT QSO team who assisted us in the preparation and in the execution of the observations and helped us with the calibration and characterisation of the instrument, allowing us to make the best use of our data: Todd Burdullis, Daniel Devost, Billy Mahoney, Nadine Manset, Andreea Petric, Simon Prunet, Kanoa Withington. The authors thank the anonymous referee for the useful comments which helped improve the quality of the manuscript. The scientific results reported in this article are based in part on data obtained from the Chandra Data Archive. We acknowledge financial support from the “Programme National de Cosmologie et Galaxies” (PNCG) funded by CNRS/INSU-IN2P3-INP, CEA and CNES, France, and from “Projet International de Coopération Scientifique” (PICS) with Canada funded by the CNRS, France. M.B. acknowledges the support of FONDECYT regular grant 1170618. Parts of this research were conducted by the Australian Research Council Centre of Excellence for All Sky Astrophysics in 3 Dimensions (ASTRO 3D), through project number CE170100013. M.F. acknowledges support by the Science and Technology Facilities Council [grant number ST/P000541/1]. This project has received funding from the European Research Council (ERC) under the European Union’s Horizon 2020 research and innovation programme (grant agreement No. 757535). S.F.S. is grateful for the support of a CONACYT (Mexico) grant CB-285080, and funding from the PAPIIT-DGAPA-IA101217(UNAM). M.S. acknowledges support from the NASA grant 80NSSC18K0606 and the NSF grant 1714764. This research has made use of the NASA/IPAC Extragalactic Database (NED) which is operated by the Jet Propulsion Laboratory, California Institute of Technology, under contract with the National Aeronautics and Space Administration and of the GOLDMine database (http://goldmine.mib.infn.it/; Gavazzi et al. 2003b).
References
- Abramson, A., & Kenney, J. D. P. 2014, AJ, 147, 63 [NASA ADS] [CrossRef] [Google Scholar]
- Abramson, A., Kenney, J. D. P., Crowl, H. H., et al. 2011, AJ, 141, 164 [NASA ADS] [CrossRef] [Google Scholar]
- Abramson, A., Kenney, J., Crowl, H., & Tal, T. 2016, AJ, 152, 32 [NASA ADS] [CrossRef] [Google Scholar]
- Alton, P. B., Davies, J. I., & Bianchi, S. 1999, A&A, 343, 51 [NASA ADS] [Google Scholar]
- Baldwin, J. A., Phillips, M. M., & Terlevich, R. 1981, PASP, 93, 5 [NASA ADS] [CrossRef] [EDP Sciences] [Google Scholar]
- Bendo, G. J., Galliano, F., & Madden, S. C. 2012, MNRAS, 423, 197 [NASA ADS] [CrossRef] [Google Scholar]
- Blakeslee, J. P., Jordán, A., Mei, S., et al. 2009, ApJ, 694, 556 [NASA ADS] [CrossRef] [Google Scholar]
- Boquien, M., Burgarella, D., Roehlly, Y., et al. 2018, A&A, accepted [arXiv:1811.03094] [Google Scholar]
- Boselli, A., & Gavazzi, G. 2006, PASP, 118, 517 [NASA ADS] [CrossRef] [Google Scholar]
- Boselli, A., & Gavazzi, G. 2014, A&ARv, 22, 74 [NASA ADS] [CrossRef] [Google Scholar]
- Boselli, A., Gavazzi, G., Franzetti, P., Pierini, D., & Scodeggio, M. 2000, A&AS, 142, 73 [NASA ADS] [CrossRef] [EDP Sciences] [Google Scholar]
- Boselli, A., Boissier, S., Cortese, L., et al. 2005, ApJ, 623, L13 [NASA ADS] [CrossRef] [Google Scholar]
- Boselli, A., Boissier, S., Cortese, L., et al. 2006, ApJ, 651, 811 [NASA ADS] [CrossRef] [Google Scholar]
- Boselli, A., Boissier, S., Cortese, L., et al. 2009, ApJ, 706, 1527 [NASA ADS] [CrossRef] [Google Scholar]
- Boselli, A., Eales, S., Cortese, L., et al. 2010, PASP, 122, 261 [NASA ADS] [CrossRef] [Google Scholar]
- Boselli, A., Boissier, S., Heinis, S., et al. 2011, A&A, 528, A107 [NASA ADS] [CrossRef] [EDP Sciences] [Google Scholar]
- Boselli, A., Cortese, L., & Boquien, M. 2014a, A&A, 564, A65 [NASA ADS] [CrossRef] [EDP Sciences] [Google Scholar]
- Boselli, A., Cortese, L., Boquien, M., et al. 2014b, A&A, 564, A67 [NASA ADS] [CrossRef] [EDP Sciences] [Google Scholar]
- Boselli, A., Voyer, E., Boissier, S., et al. 2014c, A&A, 570, AA69 [Google Scholar]
- Boselli, A., Fossati, M., Gavazzi, G., et al. 2015, A&A, 579, A102 [NASA ADS] [CrossRef] [EDP Sciences] [Google Scholar]
- Boselli, A., Cuillandre, J. C., Fossati, M., et al. 2016a, A&A, 587, A68 [NASA ADS] [CrossRef] [EDP Sciences] [Google Scholar]
- Boselli, A., Roehlly, Y., Fossati, M., et al. 2016b, A&A, 596, A11 [NASA ADS] [CrossRef] [EDP Sciences] [Google Scholar]
- Boselli, A., Fossati, M., Ferrarese, L., et al. 2018a, A&A, 614, A56 [NASA ADS] [CrossRef] [EDP Sciences] [Google Scholar]
- Boselli, A., Fossati, M., Cuillandre, J. C., et al. 2018b, A&A, 615, A114 [NASA ADS] [CrossRef] [EDP Sciences] [Google Scholar]
- Bournaud, F., Combes, F., & Jog, C. J. 2004, A&A, 418, L27 [NASA ADS] [CrossRef] [EDP Sciences] [Google Scholar]
- Bruzual, G., & Charlot, S. 2003, MNRAS, 344, 1000 [NASA ADS] [CrossRef] [Google Scholar]
- Byrd, G., & Valtonen, M. 1990, ApJ, 350, 89 [NASA ADS] [CrossRef] [Google Scholar]
- Cantiello, M., Blakeslee, J. P., Ferrarese, L., et al. 2018, ApJ, 856, 126 [NASA ADS] [CrossRef] [Google Scholar]
- Cappellari, M., & Emsellem, E. 2004, PASP, 116, 138 [NASA ADS] [CrossRef] [Google Scholar]
- Chabrier, G. 2003, PASP, 115, 763 [Google Scholar]
- Chung, A., van Gorkom, J. H., Kenney, J. D. P., & Vollmer, B. 2007, ApJ, 659, L115 [NASA ADS] [CrossRef] [Google Scholar]
- Chung, A., van Gorkom, J. H., Kenney, J. D. P., Crowl, H., & Vollmer, B. 2009, AJ, 138, 1741 [NASA ADS] [CrossRef] [Google Scholar]
- Ciesla, L., Boselli, A., Smith, M. W. L., et al. 2012, A&A, 543, A161 [NASA ADS] [CrossRef] [EDP Sciences] [Google Scholar]
- Ciesla, L., Boquien, M., Boselli, A., et al. 2014, A&A, 565, A128 [Google Scholar]
- Coccato, L., Corsini, E. M., Pizzella, A., & Bertola, F. 2005, A&A, 440, 107 [NASA ADS] [CrossRef] [EDP Sciences] [Google Scholar]
- Consolandi, G., Gavazzi, G., Fossati, M., et al. 2017, A&A, 606, A83 [NASA ADS] [CrossRef] [EDP Sciences] [Google Scholar]
- Cortés, J. R., Kenney, J. D. P., & Hardy, E. 2006, AJ, 131, 747 [NASA ADS] [CrossRef] [Google Scholar]
- Cortés, J. R., Kenney, J. D. P., & Hardy, E. 2008, ApJ, 683, 78 [NASA ADS] [CrossRef] [Google Scholar]
- Cortés, J. R., Kenney, J. D. P., & Hardy, E. 2015, ApJS, 216, 9 [NASA ADS] [CrossRef] [Google Scholar]
- Cortese, L., Gavazzi, G., Boselli, A., et al. 2006, A&A, 453, 847 [Google Scholar]
- Cortese, L., Davies, J. I., Pohlen, M., et al. 2010, A&A, 518, L49 [NASA ADS] [CrossRef] [EDP Sciences] [Google Scholar]
- Cortese, L., Ciesla, L., Boselli, A., et al. 2012a, A&A, 540, A52 [NASA ADS] [CrossRef] [EDP Sciences] [Google Scholar]
- Cortese, L., Boissier, S., Boselli, A., et al. 2012b, A&A, 544, A101 [NASA ADS] [CrossRef] [EDP Sciences] [Google Scholar]
- Cortese, L., Fritz, J., Bianchi, S., et al. 2014, MNRAS, 440, 942 [NASA ADS] [CrossRef] [Google Scholar]
- Cortijo-Ferrero, C., González Delgado, R. M., Pérez, E., et al. 2017, A&A, 607, A70 [NASA ADS] [CrossRef] [EDP Sciences] [Google Scholar]
- Cowie, L. L., & Songaila, A. 1977, Nature, 266, 501 [Google Scholar]
- Cresci, G., Vanzi, L., Telles, E., et al. 2017, A&A, 604, A101 [NASA ADS] [CrossRef] [EDP Sciences] [Google Scholar]
- Crowl, H. H., & Kenney, J. D. P. 2008, AJ, 136, 1623 [NASA ADS] [CrossRef] [Google Scholar]
- Curti, M., Cresci, G., Mannucci, F., et al. 2017, MNRAS, 465, 1384 [NASA ADS] [CrossRef] [Google Scholar]
- Daigle, O., Carignan, C., Hernandez, O., Chemin, L., & Amram, P. 2006, MNRAS, 368, 1016 [NASA ADS] [CrossRef] [Google Scholar]
- Davies, J. I., Baes, M., Bendo, G. J., et al. 2010, A&A, 518, L48 [NASA ADS] [CrossRef] [EDP Sciences] [Google Scholar]
- De Lucia, G. 2011, Astrophys. Space Sci. Proc., 27, 203 [NASA ADS] [CrossRef] [Google Scholar]
- Draine, & Li 2007, ApJ, 657, 810 [NASA ADS] [CrossRef] [Google Scholar]
- Dressler, A. 1980, ApJ, 236, 351 [NASA ADS] [CrossRef] [Google Scholar]
- Dressler, A., Oemler, A. Jr., Couch, W. J., et al. 1997, ApJ, 490, 577 [NASA ADS] [CrossRef] [Google Scholar]
- Duc, P.-A., Cuillandre, J.-C., Serra, P., et al. 2011, MNRAS, 417, 863 [NASA ADS] [CrossRef] [Google Scholar]
- Elmouttie, M., Koribalski, B., Gordon, S., et al. 1998a, MNRAS, 297, 49 [NASA ADS] [CrossRef] [Google Scholar]
- Elmouttie, M., Haynes, R. F., Jones, K. L., Sadler, E. M., & Ehle, M. 1998b, MNRAS, 297, 1202 [NASA ADS] [CrossRef] [Google Scholar]
- Engelbracht, C. W., Kundurthy, P., Gordon, K. D., et al. 2006, ApJ, 642, L127 [NASA ADS] [CrossRef] [Google Scholar]
- Epinat, B., Amram, P., Marcelin, M., et al. 2008, MNRAS, 388, 500 [NASA ADS] [CrossRef] [Google Scholar]
- Ferrarese, L., Côté, P., Cuillandre, J.-C., et al. 2012, ApJS, 200, 4 [NASA ADS] [CrossRef] [Google Scholar]
- Fossati, M., Gavazzi, G., Boselli, A., & Fumagalli, M. 2012, A&A, 544, A128 [NASA ADS] [CrossRef] [EDP Sciences] [Google Scholar]
- Fossati, M., Fumagalli, M., Boselli, A., et al. 2016, MNRAS, 455, 2028 [Google Scholar]
- Fossati, M., Mendel, J. T., Boselli, A., et al. 2018, A&A, 614, A57 [NASA ADS] [CrossRef] [EDP Sciences] [Google Scholar]
- Fritz, J., Moretti, A., Gullieuszik, M., et al. 2017, ApJ, 848, 132 [NASA ADS] [CrossRef] [Google Scholar]
- Fumagalli, M., Krumholz, M. R., Prochaska, J. X., Gavazzi, G., & Boselli, A. 2009, ApJ, 697, 1811 [NASA ADS] [CrossRef] [Google Scholar]
- Fumagalli, M., Gavazzi, G., Scaramella, R., & Franzetti, P. 2011, A&A, 528, A46 [NASA ADS] [CrossRef] [EDP Sciences] [Google Scholar]
- Fumagalli, M., Fossati, M., Hau, G. K. T., et al. 2014, MNRAS, 445, 4335 [Google Scholar]
- Gach, J.-L., Hernandez, O., Boulesteix, J., et al. 2002, PASP, 114, 1043 [NASA ADS] [CrossRef] [Google Scholar]
- Galbany, L., Anderson, J. P., Rosales-Ortega, F. F., et al. 2016, MNRAS, 455, 4087 [NASA ADS] [CrossRef] [Google Scholar]
- Galbany, L., Collett, T. E., Méndez-Abreu, J., et al. 2018, MNRAS, 479, 262 [NASA ADS] [CrossRef] [Google Scholar]
- Garrido, O., Marcelin, M., Amram, P., et al. 2005, MNRAS, 362, 127 [NASA ADS] [CrossRef] [Google Scholar]
- Gavazzi, G., Contursi, A., Carrasco, L., et al. 1995, A&A, 304, 325 [NASA ADS] [Google Scholar]
- Gavazzi, G., Catinella, B., Carrasco, L., Boselli, A., & Contursi, A. 1998, AJ, 115, 1745 [NASA ADS] [CrossRef] [Google Scholar]
- Gavazzi, G., Boselli, A., Scodeggio, M., Pierini, D., & Belsole, E. 1999, MNRAS, 304, 595 [NASA ADS] [CrossRef] [Google Scholar]
- Gavazzi, G., Boselli, A., Mayer, L., et al. 2001a, ApJ, 563, L23 [NASA ADS] [CrossRef] [Google Scholar]
- Gavazzi, G., Marcelin, M., Boselli, A., et al. 2001b, A&A, 377, 745 [NASA ADS] [CrossRef] [EDP Sciences] [Google Scholar]
- Gavazzi, G., Bonfanti, C., Sanvito, G., Boselli, A., & Scodeggio, M. 2002, ApJ, 576, 135 [NASA ADS] [CrossRef] [Google Scholar]
- Gavazzi, G., Cortese, L., Boselli, A., et al. 2003a, ApJ, 597, 210 [NASA ADS] [CrossRef] [Google Scholar]
- Gavazzi, G., Boselli, A., Donati, A., Franzetti, P., & Scodeggio, M. 2003b, A&A, 400, 451 [NASA ADS] [CrossRef] [EDP Sciences] [Google Scholar]
- Gavazzi, G., Boselli, A., van Driel, W., & O’Neil, K. 2005, A&A, 429, 439 [NASA ADS] [CrossRef] [EDP Sciences] [Google Scholar]
- Gavazzi, G., Boselli, A., Cortese, L., et al. 2006a, A&A, 446, 839 [NASA ADS] [CrossRef] [EDP Sciences] [Google Scholar]
- Gavazzi, G., O’Neil, K., Boselli, A., & van Driel, W. 2006b, A&A, 449, 929 [NASA ADS] [CrossRef] [EDP Sciences] [Google Scholar]
- Gavazzi, G., Fumagalli, M., Fossati, M., et al. 2013, A&A, 553, A89 [NASA ADS] [CrossRef] [EDP Sciences] [Google Scholar]
- Gavazzi, G., Consolandi, G., Gutierrez, M. L., Boselli, A., & Yoshida, M. 2018, A&A, 618, A130 [NASA ADS] [CrossRef] [EDP Sciences] [Google Scholar]
- Ge, C., Morandi, A., Sun, M., et al. 2018, MNRAS, submitted, [arXiv:1803.05007] [Google Scholar]
- Gunn, J. E., & Gott, J. R. III. 1972, ApJ, 176, 1 [NASA ADS] [CrossRef] [Google Scholar]
- Gwyn, S. D. J. 2008, PASP, 120, 212 [NASA ADS] [CrossRef] [Google Scholar]
- Hatt, D., Freedman, W. L., Madore, B. F., et al. 2018, ApJ, 861, 104 [NASA ADS] [CrossRef] [Google Scholar]
- Haynes, M. P., Giovanelli, R., & Chincarini, G. L. 1984, ARA&A, 22, 445 [Google Scholar]
- Hughes, T. M., Cortese, L., Boselli, A., Gavazzi, G., & Davies, J. I. 2013, A&A, 550, A115 [NASA ADS] [CrossRef] [EDP Sciences] [Google Scholar]
- Jáchym, P., Kenney, J. D. P., Ržuička, A., et al. 2013, A&A, 556, A99 [NASA ADS] [CrossRef] [EDP Sciences] [Google Scholar]
- Jáchym, P., Combes, F., Cortese, L., Sun, M., & Kenney, J. D. P. 2014, ApJ, 792, 11 [NASA ADS] [CrossRef] [Google Scholar]
- Kauffmann, G., Heckman, T. M., Tremonti, C., et al. 2003, MNRAS, 346, 1055 [Google Scholar]
- Kenney, J. D. P., & Koopmann, R. A. 1999, AJ, 117, 181 [NASA ADS] [CrossRef] [Google Scholar]
- Kenney, J. D. P., & Yale, E. E. 2002, ApJ, 567, 865 [NASA ADS] [CrossRef] [Google Scholar]
- Kenney, J. D. P., Koopmann, R. A., Rubin, V. C., & Young, J. S. 1996, AJ, 111, 152 [NASA ADS] [CrossRef] [Google Scholar]
- Kenney, J. D. P., van Gorkom, J. H., & Vollmer, B. 2004, AJ, 127, 3361 [NASA ADS] [CrossRef] [Google Scholar]
- Kenney, J. D. P., Tal, T., Crowl, H. H., Feldmeier, J., & Jacoby, G. H. 2008, ApJ, 687, L69 [Google Scholar]
- Kenney, J. D. P., Geha, M., Jáchym, P., et al. 2014, ApJ, 780, 119 [NASA ADS] [CrossRef] [Google Scholar]
- Kenney, J. D. P., Abramson, A., & Bravo-Alfaro, H. 2015, AJ, 150, 59 [NASA ADS] [CrossRef] [Google Scholar]
- Kennicutt, R. C. Jr. 1983, AJ, 88, 483 [NASA ADS] [CrossRef] [Google Scholar]
- Kennicutt, R. C. Jr. 1998, ARA&A, 36, 189 [Google Scholar]
- Kewley, L. J., Dopita, M. A., Sutherland, R. S., Heisler, C. A., & Trevena, J. 2001, ApJ, 556, 121 [Google Scholar]
- Krühler, T., Kuncarayakti, H., Schady, P., et al. 2017, A&A, 602, A85 [NASA ADS] [CrossRef] [EDP Sciences] [Google Scholar]
- Larson, R. B., Tinsley, B. M., & Caldwell, C. N. 1980, ApJ, 237, 692 [NASA ADS] [CrossRef] [Google Scholar]
- López-Cobá, C., Sánchez, S. F., Moiseev, A. V., et al. 2017, MNRAS, 467, 4951 [NASA ADS] [Google Scholar]
- Marconi, A., & Hunt, L. K. 2003, ApJ, 589, L21 [Google Scholar]
- Mei, S., Blakeslee, J. P., Côté, P., et al. 2007, ApJ, 655, 144 [NASA ADS] [CrossRef] [Google Scholar]
- Mendes de Oliveira, C., Amram, P., Quint, B. C., et al. 2017, MNRAS, 469, 3424 [NASA ADS] [CrossRef] [Google Scholar]
- Merritt, D. 1983, ApJ, 264, 24 [NASA ADS] [CrossRef] [Google Scholar]
- Mihos, J. C., Durrell, P. R., Ferrarese, L., et al. 2015, ApJ, 809, L21 [NASA ADS] [CrossRef] [Google Scholar]
- Moore, B., Lake, G., & Katz, N. 1998, ApJ, 495, 139 [NASA ADS] [CrossRef] [Google Scholar]
- Munari, U., Henden, A., Belligoli, R., et al. 2013, New Astron., 20, 30 [NASA ADS] [CrossRef] [Google Scholar]
- Noll, S., Burgarella, D., Giovannoli, E., et al. 2009, A&A, 507, 1793 [NASA ADS] [CrossRef] [EDP Sciences] [Google Scholar]
- Nulsen, P. E. J. 1982, MNRAS, 198, 1007 [Google Scholar]
- Osterbrock, D. E., & Ferland, G. J. 2006, in Astrophysics of Gaseous Nebulae and Active Galactic Nuclei, 2nd edition, eds. D. E. Osterbrock, & G. J. Ferland (Sausalito, CA: University Science Books) [Google Scholar]
- Östlin, G., Cumming, R. J., Amram, P., et al. 2004, A&A, 419, L43 [NASA ADS] [CrossRef] [EDP Sciences] [Google Scholar]
- Paudel, S., Smith, R., Duc, P.-A., et al. 2017, ApJ, 834, 66 [NASA ADS] [CrossRef] [Google Scholar]
- Poggianti, B., & Barbaro, G. 1997, A&A, 325, 1025 [Google Scholar]
- Poggianti, B. M., Moretti, A., Gullieuszik, M., et al. 2017, ApJ, 844, 48 [Google Scholar]
- Proxauf, B., Öttl, S., & Kimeswenger, S. 2014, A&A, 561, A10 [NASA ADS] [CrossRef] [EDP Sciences] [Google Scholar]
- Quilis, V., Moore, B., & Bower, R. 2000, Science, 288, 1617 [Google Scholar]
- Rich, J. A., Kewley, L. J., & Dopita, M. A. 2011, ApJ, 734, 87 [NASA ADS] [CrossRef] [Google Scholar]
- Roediger, E., & Brüggen, M. 2006, MNRAS, 369, 567 [NASA ADS] [CrossRef] [Google Scholar]
- Roediger, E., & Brüggen, M. 2007, MNRAS, 380, 1399 [NASA ADS] [CrossRef] [Google Scholar]
- Roediger, E., & Brüggen, M. 2008, MNRAS, 388, L89 [NASA ADS] [CrossRef] [Google Scholar]
- Roediger, E., & Hensler, G. 2005, A&A, 433, 875 [NASA ADS] [CrossRef] [EDP Sciences] [Google Scholar]
- Rubin, V. C., Waterman, A. H., & Kenney, J. D. P. 1999, AJ, 118, 236 [NASA ADS] [CrossRef] [Google Scholar]
- Sarazin, C. L. 1986, Rev. Mod. Phys., 58, 1 [NASA ADS] [CrossRef] [Google Scholar]
- Sarzi, M., Falcón-Barroso, J., Davies, R. L., et al. 2006, MNRAS, 366, 1151 [Google Scholar]
- Shopbell, P. L., & Bland-Hawthorn, J. 1998, ApJ, 493, 129 [NASA ADS] [CrossRef] [Google Scholar]
- Silverman, J. M., Ganeshalingam, M., Cenko, S. B., et al. 2012, ApJ, 756, L7 [NASA ADS] [CrossRef] [Google Scholar]
- Simionescu, A., Werner, N., Mantz, A., Allen, S. W., & Urban, O. 2017, MNRAS, 469, 1476 [NASA ADS] [CrossRef] [Google Scholar]
- Solanes, J. M., Manrique, A., García-Gómez, C., et al. 2001, ApJ, 548, 97 [NASA ADS] [CrossRef] [Google Scholar]
- Sorgho, A., Hess, K., Carignan, C., & Oosterloo, T. A. 2017, MNRAS, 464, 530 [NASA ADS] [CrossRef] [Google Scholar]
- Soto, K. T., Lilly, S. J., Bacon, R., Richard, J., & Conseil, S. 2016, MNRAS, 458, 3210 [NASA ADS] [CrossRef] [Google Scholar]
- Sun, M., Jones, C., Forman, W., et al. 2006, ApJ, 637, L81 [NASA ADS] [CrossRef] [Google Scholar]
- Sun, M., Donahue, M., & Voit, G. M. 2007, ApJ, 671, 190 [Google Scholar]
- Sun, M., Donahue, M., Roediger, E., et al. 2010, ApJ, 708, 946 [NASA ADS] [CrossRef] [Google Scholar]
- Tonnesen, S., & Bryan, G. L. 2009, ApJ, 694, 789 [NASA ADS] [CrossRef] [Google Scholar]
- Tonnesen, S., Bryan, G. L., & Chen, R. 2011, ApJ, 731, 98 [NASA ADS] [CrossRef] [Google Scholar]
- Vazdekis, A., Sánchez-Blázquez, P., Falcón-Barroso, J., et al. 2010, MNRAS, 404, 1639 [NASA ADS] [Google Scholar]
- Vollmer, B. 2003, A&A, 398, 525 [NASA ADS] [CrossRef] [EDP Sciences] [Google Scholar]
- Vollmer, B., Cayatte, V., Boselli, A., Balkowski, C., & Duschl, W. J. 1999, A&A, 349, 411 [NASA ADS] [Google Scholar]
- Vollmer, B., Marcelin, M., Amram, P., et al. 2000, A&A, 364, 532 [NASA ADS] [Google Scholar]
- Vollmer, B., Cayatte, V., Balkowski, C., & Duschl, W. J. 2001a, ApJ, 561, 708 [NASA ADS] [CrossRef] [Google Scholar]
- Vollmer, B., Braine, J., Balkowski, C., Cayatte, V., & Duschl, W. J. 2001b, A&A, 374, 824 [NASA ADS] [CrossRef] [EDP Sciences] [Google Scholar]
- Vollmer, B., Beck, R., Kenney, J. D. P., & van Gorkom, J. H. 2004a, AJ, 127, 3375 [NASA ADS] [CrossRef] [Google Scholar]
- Vollmer, B., Balkowski, C., Cayatte, V., van Driel, W., & Huchtmeier, W. 2004b, A&A, 419, 35 [NASA ADS] [CrossRef] [EDP Sciences] [Google Scholar]
- Vollmer, B., Huchtmeier, W., & van Driel, W. 2005a, A&A, 439, 921 [NASA ADS] [CrossRef] [EDP Sciences] [Google Scholar]
- Vollmer, B., Braine, J., Combes, F., & Sofue, Y. 2005b, A&A, 441, 473 [NASA ADS] [CrossRef] [EDP Sciences] [Google Scholar]
- Vollmer, B., Soida, M., Otmianowska-Mazur, K., et al. 2006, A&A, 453, 883 [NASA ADS] [CrossRef] [EDP Sciences] [Google Scholar]
- Vollmer, B., Soida, M., Chung, A., et al. 2008a, A&A, 483, 89 [NASA ADS] [CrossRef] [EDP Sciences] [Google Scholar]
- Vollmer, B., Braine, J., Pappalardo, C., & Hily-Blant, P. 2008b, A&A, 491, 455 [NASA ADS] [CrossRef] [EDP Sciences] [Google Scholar]
- Vollmer, B., Soida, M., Chung, A., et al. 2009, A&A, 496, 669 [NASA ADS] [CrossRef] [EDP Sciences] [Google Scholar]
- Vollmer, B., Soida, M., Braine, J., et al. 2012, A&A, 537, A143 [NASA ADS] [CrossRef] [EDP Sciences] [Google Scholar]
- Vollmer, B., Soida, M., Beck, R., et al. 2013, A&A, 553, A116 [NASA ADS] [CrossRef] [EDP Sciences] [Google Scholar]
- Weilbacher, P. M., Streicher, O., Urrutia, T., et al. 2014, Astron. Data Anal. Softw. Syst. XXIII, 485, 451 [Google Scholar]
- Whitmore, B. C., Gilmore, D. M., & Jones, C. 1993, ApJ, 407, 489 [NASA ADS] [CrossRef] [Google Scholar]
- Wilson, A. S., Shopbell, P. L., Simpson, C., et al. 2000, AJ, 120, 1325 [NASA ADS] [CrossRef] [Google Scholar]
- Wright, E. L., Eisenhardt, P. R. M., Mainzer, A. K., et al. 2010, AJ, 140, 1868 [Google Scholar]
- Yagi, M., Komiyama, Y., Yoshida, M., et al. 2007, ApJ, 660, 1209 [NASA ADS] [CrossRef] [Google Scholar]
- Yagi, M., Yoshida, M., Komiyama, Y., et al. 2010, AJ, 140, 1814 [Google Scholar]
- Yagi, M., Yoshida, M., Gavazzi, G., et al. 2017, ApJ, 839, 65 [NASA ADS] [CrossRef] [Google Scholar]
- Yoshida, M., Yagi, M., Okamura, S., et al. 2002, ApJ, 567, 118 [NASA ADS] [CrossRef] [Google Scholar]
- Zhang, B., Sun, M., Ji, L., et al. 2013, ApJ, 777, 122 [NASA ADS] [CrossRef] [Google Scholar]
All Tables
All Figures
|
Fig. 1. Pseudo-colour image of NGC 4424 obtained combining the NGVS (Ferrarese et al. 2012) optical u and g in the blue channel, the r and NB in the green, and the i and the continuum-subtracted Hα in the red. At the assumed distance of the galaxy (16.5 Mpc), 1 arcmin = 4.8 kpc. Stellar shells are not detected down to the NGVS surface brightness limit of μg = 29 mag arcsec−2. |
| In the text | |
|
Fig. 2. Continuum-subtracted Hα image of NGC 4424 with contours at Σ(Hα) = 4 × 10⁻¹⁸ erg s−1 cm−2 arcsec−2. A prominent tail is visible in the north-east direction extending from the ionised gas halo. The inset shows a contrasted image of the central regions (here on an arbitrary surface brightness scale) with prominent filaments of ionised gas. |
| In the text | |
|
Fig. 3. Multifrequency images on the same scale of the galaxy NGC 4424. Upper panels, from left to right: continuum-subtracted Hα (VESTIGE), FUV (GALEX), NUV (GALEX); lower panels: u (NGVS), IRAC 3.6 μm (Spitzer), MIPS 24 μm (Spitzer). Red contours are drawn from the u-band image at 22nd, 24th, and 26th mag arcsec−2 and highlight the truncation of the disc at different wavelengths. |
| In the text | |
|
Fig. 4. HST colour image of the galaxy NGC 4424, showing a perturbed morphology at an unequaled sensitivity and angular resolution, with plumes and filaments of dust in absorption located along the major axis of the galaxy or perpendicular to it. |
| In the text | |
|
Fig. 5. Adaptively smoothed 0.4–1.3 keV XMM image of the NGC 4424 with the HI contours (from Chung et al. 2009) superposed. Bright X-ray point sources outside of the galaxy are masked. No soft X-ray enhancement is observed in the position of the HI tail. The two arrows at the north and south of the galaxy point towards the centre of Virgo cluster A and B, respectively. Their length is proportional to the distance to M 87 and M 49. The zoomed-in region at the upper right shows the Chandra 0.5–7 keV image of the galaxy, with the Hα contours (as in Fig. 2) superposed. The small blue circle with a radius of 2″ shows the putative nuclear position without a corresponding X-ray source. An obscured X-ray source 4.9″ to the south-east of the nucleus (PS1) is detected by Chandra. |
| In the text | |
|
Fig. 6. Spaxel distribution of the Balmer decrement Hα/Hβ derived from the MUSE pixels with S/N > 5. The cross indicates the position of the nucleus, the grey contours the distribution of the Hα emitting gas (contour levels are Σ(Hα) = 5 × 10⁻¹⁷ − 10−16 erg s−1 cm−2 arcsec−2). |
| In the text | |
|
Fig. 7. Line diagnostic BPT diagrams log([OIII]λ5007/Hβ) vs. log ([NII]λ6583/Hα) (upper left panel) and log([OIII]λ5007/Hβ) vs. log ([OI]λ6300/Hα) (lower left panel) derived from MUSE pixels with S/N > 5. The different points are colour-coded according to their distance from the dashed lines defined by Kauffmann et al. (2003; upper panels) and Kewley et al. (2001; lower panels) to separate AGN from star forming regions. The grey contours show the distribution of a random sample of nuclear spectra of SDSS galaxies in the redshift range 0.01–1 and stellar mass 109–1011. The solid thick lines in the upper left panel show the expected behaviour of star forming regions as derived from the photo-ionisation models of Kewley et al. (2001) for three different metallicities (0.2, 0.4, 1 Z⊙). Lower left panel: shock models of Rich et al. (2011) for increasing shock fraction (from left to right) in a twice solar gas. Right panels: distribution of the same points colour-coded as in the left panels over the disc of the galaxy. The cross shows the centre of the galaxy, the grey contours the distribution of the Hα emitting gas. |
| In the text | |
|
Fig. 8. Velocity field (left panels) and error maps (right panels) of the gaseous (upper panels) and stellar (lower panels) components derived from the MUSE data. The black and white crosses indicate the position of the nucleus, the grey contours the distribution of the Hα emitting gas. |
| In the text | |
|
Fig. 9. Velocity dispersion (left panel) and error maps (right panel) of the gaseous component derived from the MUSE data. The cross indicates the position of the nucleus, the grey contours the distribution of the Hα emitting gas. |
| In the text | |
|
Fig. 10. Velocity field (left panels) and velocity dispersion (right panels) of the gaseous component as derived from the OHP (upper panels) and SOAR (lower panels) Fabry-Perot observations. The black and white crosses indicate the position of the nucleus, the grey contours the distribution of the Hα emitting gas. |
| In the text | |
|
Fig. 11. Far-UV to far-IR SED of the three selected regions along the disc of NGC 4424 (from east to west). In each panel the observational data and their error bars are indicated with red filled dots, the upper limit with a blue triangle; the black solid line shows the best fit model. The inset shows the colour gri RGB image of the galaxy; overlayed are the red boxes indicating the three fields used to study the SED with the CIGALE fitting code. |
| In the text | |
|
Fig. 12. Best model fit obtained with CIGALE (black) is compared to the MUSE spectrum (red) in the Hβ line after emission is removed using GANDALF. The best model has been shifted on the y-axis to match the observed spectrum. |
| In the text | |
Current usage metrics show cumulative count of Article Views (full-text article views including HTML views, PDF and ePub downloads, according to the available data) and Abstracts Views on Vision4Press platform.
Data correspond to usage on the plateform after 2015. The current usage metrics is available 48-96 hours after online publication and is updated daily on week days.
Initial download of the metrics may take a while.