Fig. 7.
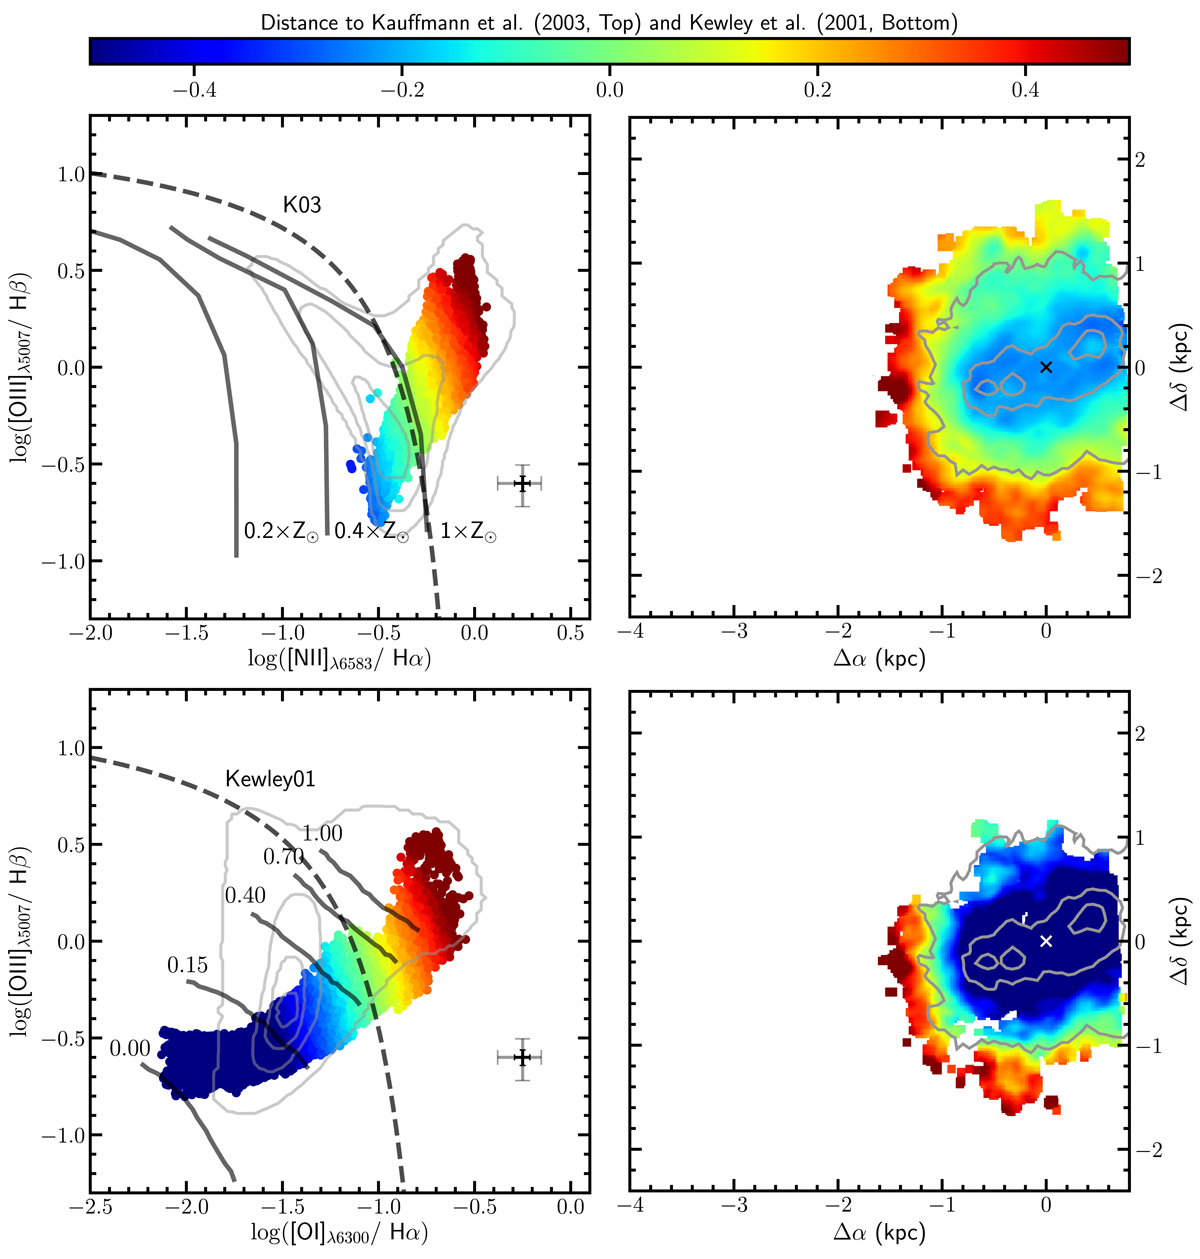
Line diagnostic BPT diagrams log([OIII]λ5007/Hβ) vs. log ([NII]λ6583/Hα) (upper left panel) and log([OIII]λ5007/Hβ) vs. log ([OI]λ6300/Hα) (lower left panel) derived from MUSE pixels with S/N > 5. The different points are colour-coded according to their distance from the dashed lines defined by Kauffmann et al. (2003; upper panels) and Kewley et al. (2001; lower panels) to separate AGN from star forming regions. The grey contours show the distribution of a random sample of nuclear spectra of SDSS galaxies in the redshift range 0.01–1 and stellar mass 109–1011. The solid thick lines in the upper left panel show the expected behaviour of star forming regions as derived from the photo-ionisation models of Kewley et al. (2001) for three different metallicities (0.2, 0.4, 1 Z⊙). Lower left panel: shock models of Rich et al. (2011) for increasing shock fraction (from left to right) in a twice solar gas. Right panels: distribution of the same points colour-coded as in the left panels over the disc of the galaxy. The cross shows the centre of the galaxy, the grey contours the distribution of the Hα emitting gas.
Current usage metrics show cumulative count of Article Views (full-text article views including HTML views, PDF and ePub downloads, according to the available data) and Abstracts Views on Vision4Press platform.
Data correspond to usage on the plateform after 2015. The current usage metrics is available 48-96 hours after online publication and is updated daily on week days.
Initial download of the metrics may take a while.