| Issue |
A&A
Volume 631, November 2019
|
|
|---|---|---|
| Article Number | A114 | |
| Number of page(s) | 10 | |
| Section | Extragalactic astronomy | |
| DOI | https://doi.org/10.1051/0004-6361/201936133 | |
| Published online | 31 October 2019 | |
Evidence for ram-pressure stripping in a cluster of galaxies at z = 0.7⋆,⋆⋆
1
Aix Marseille Univ., CNRS, CNES, LAM, Marseille, France
e-mail: This email address is being protected from spambots. You need JavaScript enabled to view it.
, This email address is being protected from spambots. You need JavaScript enabled to view it.
2
IRAP, Université de Toulouse, CNRS, CNES, UPS, Toulouse, France
3
Leiden Observatory, Leiden University, PO Box 9513, 2300 RA Leiden, The Netherlands
4
Instituto de Astrofísica e Ciências do Espaço, Universidade do Porto, CAUP, Rua das Estrelas, 4150-762 Porto, Portugal
5
Univ Lyon, Univ. Lyon1, ENS de Lyon, CNRS, Centre de Recherche Astrophysique de Lyon UMR5574, 69230 Saint-Genis-Laval, France
6
Stockholm University, Department of Astronomy and Oskar Klein Centre for Cosmoparticle Physics, AlbaNova, University Centre, 10691 Stockholm, Sweden
7
Leibniz-Institut für Astrophysik Potsdam (AIP), An der Sternwarte 16, 14482 Potsdam, Germany
Received:
19
June
2019
Accepted:
11
September
2019
Abstract
Multi-Unit Spectroscopic Explorer (MUSE) observations of the cluster of galaxies CGr32 (M200 ≃ 2 × 10¹⁴ M⊙) at z = 0.73 reveal the presence of two massive star-forming galaxies with extended tails of diffuse gas detected in the [O II]λλ3727–3729 Å emission-line doublet. The tails, which have a cometary shape with a typical surface brightness of a few 10−18 erg s−1 cm−2 arcsec−2, extend up to ≃100 kpc (projected distance) from the galaxy discs, and are not associated with any stellar component. All this observational evidence suggests that the gas was removed during a ram-pressure stripping event. This observation is thus the first evidence that dynamical interactions with the intracluster medium were active when the Universe was only half its present age. The density of the gas derived using the observed [O II]λ3729/[O II]λ3726 line ratio implies a very short recombination time, suggesting that a source of ionisation is necessary to keep the gas ionised within the tail.
Key words: galaxies: clusters: general / galaxies: clusters: individual: CGr32 / galaxies: evolution / galaxies: interactions / galaxies: ISM / galaxies: high-redshift
The reduced datacube is also available at the CDS via anonymous ftp to cdsarc.u-strasbg.fr (130.79.128.5) or via http://cdsarc.u-strasbg.fr/viz-bin/cat/J/A+A/631/A114
Based on observations made with ESO telescopes at the Paranal Observatory under programmes 097.A-0254, 100.A-0607, 101.A-0282.
© A. Boselli et al. 2019
 Open Access article, published by EDP Sciences, under the terms of the Creative Commons Attribution License (http://creativecommons.org/licenses/by/4.0), which permits unrestricted use, distribution, and reproduction in any medium, provided the original work is properly cited.
1. Introduction
Since the seminal work of Dressler (1980), it has become evident that the environment plays a major role in shaping galaxy evolution. High-density regions such as rich clusters of galaxies are mainly composed of early-type objects, (ellipticals and lenticulars) while the field is dominated by late-type, star-forming systems. In these dense regions, the fraction of quiescent galaxies increases with decreasing redshift (e.g. Dressler et al. 1997). It is still unclear which, among the different mechanisms proposed in the literature – gravitational interactions (Merritt 1983; Byrd & Valtonen 1990; Moore et al. 1998) or hydrodynamic interactions with the hot (T ≃ 107 − 108 K) and dense (ρICM ≃ 10−3 cm−3, e.g. Sarazin 1986) intracluster medium, (ICM; Gunn & Gott 1972; Cowie & Songaila 1977; Nulsen 1982; Larson et al. 1980) whose contribution might change at different cosmic epochs, is at the origin of these observed differences (Boselli & Gavazzi 2006, 2014).
In the local Universe, where high sensitivity multi-frequency observations are available, allowing the detection of the different stellar components and gas phases (cold, ionised, hot) with a spectacular angular resolution, it is becoming evident that within structures as massive as M200 ≥ 1014 M⊙, ram-pressure stripping is the dominant process responsible for the quenching of the star-formation activity of disc galaxies (Boselli & Gavazzi 2006). The most convincing evidence comes from the recent, very deep observations of nearby clusters using narrow-band filters centred around the Hα Balmer recombination line, which revealed the presence of extended (up to ≃100 kpc) low surface brightness (Σ(Hα)≃10−18 erg s−1 cm−1 arcsec−2) tails of ionised gas. The cometary shape of the tails and the lack of any associated diffuse tidal structure rule out any gravitational perturbation, which would affect the gaseous and the stellar component at the same time. This undoubtedly means that the ionised gas tail is formed after the interaction of the galaxy interstellar medium (ISM) with the ICM. The most striking examples were first found in the nearby cluster, A1367, by Gavazzi et al. (2001), (see also Boselli & Gavazzi 2014; Gavazzi et al. 2017; Consolandi et al. 2017) and are now becoming common in other clusters such as Norma (Zhang et al. 2013), Coma (Yagi et al. 2007, 2010, 2017; Fossati et al. 2012; Gavazzi et al. 2018), and Virgo (Yoshida et al. 2002; Kenney et al. 2008; Boselli et al. 2016a, 2018a,b; Fossati et al. 2018). Tails of stripped material have also been observed in H I (Chung et al. 2007; Scott et al. 2012), in CO (Jáchym et al. 2013, 2014, 2017), and in X-rays (Sun et al. 2006, 2007, 2010), indicating that the other gas phases can also be perturbed during the interaction. Ram-pressure stripping as the dominant mechanism is also suggested by the relative distribution in clusters of gas-deficient and star-forming galaxies (Gavazzi et al. 2013; Boselli et al. 2014b), by the outside-in radial truncation of the different components of the ISM (Cayatte et al. 1990, 1994; Cortese et al. 2010, 2012; Boselli et al. 2014a), and the star-forming disc (Koopmann et al. 2001; Boselli & Gavazzi 2006; Boselli et al. 2006, 2015; Fossati et al. 2013), and by the abrupt truncation of the star-formation activity of cluster galaxies (Boselli et al. 2016b; Fossati et al. 2018).
The statistical importance of ram-pressure stripping, which is proportional to ρICMV2 (where V is the velocity of the galaxy within the cluster, and ρICM is the density of the ICM), was expected to decrease at earlier epochs, when clusters of galaxies were first assembling through the accretion of smaller groups (Gnedin 2003; De Lucia et al. 2012). At this time, the reduced density of the ICM and lower velocity dispersion typical of lower-mass dark matter halos would have favoured gravitational interactions able to modify the structural properties of the perturbed galaxies. These gravitationally perturbed objects are probably the progenitors of massive lenticulars observed in nearby clusters (e.g. Boselli & Gavazzi 2006). The transformation of galaxies at higher redshift via gravitational perturbations in lower-density structures before their accretion into massive clusters (pre-processing) is also corroborated by the typical age of the stellar populations of lenticulars, their perturbed star-formation history, and their distribution in high-density regions at different epochs (Dressler et al. 1997; Dressler 2004; Poggianti et al. 1999, 2006).
Despite the fact that the aforementioned evolutionary picture is now becoming clearer, we still do not know at which epoch and under which conditions gravitational perturbations were superseded by hydrodynamic interactions of galaxies with the ICM. Although massive clusters were significantly less numerous in the past, the physical conditions encountered by infalling systems were similar to those present in local clusters, characterised by similar ρICM gas densities (Giodini et al. 2013; McDonald et al. 2017). It is thus conceivable that ram-pressure episodes were already present at early epochs. Due to obvious observational limits, direct evidence for ongoing ram-pressure stripping at higher redshift is still lacking. Cortese et al. (2007) discovered two galaxies in two clusters at z ≃ 0.2 with extended tails of star-forming regions that are now generally referred to as jellyfish galaxies (e.g. Poggianti et al. 2017). Since then, another ∼ fifty objects with similar characteristics have been found in deep Hubble Space Telescope (HST) images of clusters at 0.3 ≤ z ≤ 0.7 (Owers et al. 2012; Ebeling et al. 2014; McPartland et al. 2016). Since it is selected in the optical bands, however, where the emission is dominated by stars of intermediate age, a jellyfish morphology is not direct proof of an ongoing ram-pressure stripping episode (Cortese et al. 2007). In ram-pressure stripped galaxies, star-formation in the tail is not ubiquitous (e.g. Boselli et al. 2016a), and whenever observed, it is generally localised in very compact H II regions dominated by young stellar populations mainly emitting in the UV bands. Extended and asymmetric low surface brightness structures in the optical bands are due to tidal tails. The only clear example of galaxies undergoing ram-pressure stripping at intermediate redshift comes from deep Subaru narrow-band imaging observations of the cluster Abell 851 at z = 0.4 (Yagi et al. 2015). Indirect evidence at z = 0.7 comes from the reduced gas content (Betti et al. 2019), and the extended Hα ionised gas emission (Vulcani et al. 2016) observed in galaxies located in high-density regions.
The search for galaxies undergoing a ram-pressure stripping event in high-z clusters is now possible thanks to the advent of new-generation instruments in the radio millimetric and optical domains. The extraordinary sensitivity of ALMA allows the detection of low-column density tails of molecular gas stripped from perturbed cluster galaxies. The results obtained in the local Universe, however, suggest that the cold gas, once stripped and in contact with the hot surrounding ICM, rapidly changes phase, becoming ionised via different possible mechanisms, such as heat conduction, shocks, or magneto hydrodynamic waves (Tonnesen & Bryan 2010, 2012; Boselli et al. 2016a; Gavazzi et al. 2018). The ionised gas phase can be detected by IFU spectrographs, provided that their sensitivity is sufficient to reach a surface brightness as low as ∼10−18 erg s−1 cm−1 arcsec−2, the typical limiting surface brightness of Multi-Unit Spectroscopic Explorer (MUSE) after ∼ one hour of exposure.
As part of the MUSE Guaranteed Time Observations (GTO), we recently undertook a spectroscopic survey of intermediate redshift (0.25 < z < 0.85) groups and clusters (MAGIC: MUSE-gAlaxy Groups In Cosmos, Epinat et al., in prep.). During this survey, we detected two star-forming galaxies in the COSMOS cluster 32 (Knobel et al. 2012) at z = 0.73 with extended (up to ≃100 kpc in projected distance) tails of ionised gas, without any stellar counterpart in the deep optical images. This observation is thus the first evidence of an ongoing ram-pressure stripping event at z > 0.5. This paper is structured as follows; in Sect. 2, we briefly describe the cluster, in Sect. 3, the observations, and the data reduction. The analysis of the MUSE data is given in Sect. 4, and the results are discussed in Sect. 5, and summarised in the conclusion. We assume a ΛCDM cosmology with H0 = 70 km s−1, ΩM = 0.7, and ΩΛ = 0.3.
2. The galaxies ID 345 and ID 473 in the cluster CGr32
Initially identified as a group, the COSMOS cluster 32 (CGr32; Knobel et al. 2012) shows properties typical of cluster of galaxies (Table 1) CGr32 is located at a redshift of z = 0.73, and is part of the COSMOS Wall described by Iovino et al. (2016) (see Fig. 1). Thanks to the new MUSE observations, 105 galaxies have been identified as cluster members. We determined cluster membership based on the spatial and redshift distributions thanks to a friends-of-friends algorithm using a linking length of 450 kpc, and a velocity separation of 500 km s−1 (Epinat et al., in prep.). The cluster has a velocity dispersion of ≃930 km s−1 using all galaxies detected with MUSE, a radius of R200 ≃ 1.0 Mpc, and a dynamical mass of M200 ≃ 2.3 × 10¹⁴ M⊙ inferred from X-ray observations (ID 10220 in Gozaliasl et al. 2019), and is thus comparable to a fairly massive cluster like Virgo in the local Universe. The fraction of star-forming galaxies (∼50%)1 is close to the typical fraction observed in similar clusters at that redshift (Dressler et al. 1997), and to that of the spiral-rich Virgo cluster (48%, Boselli et al. 2014b). The galaxies studied in this work (ID 345 and ID 473) are two edge-on spirals located at ≃200–220 kpc from the cluster centre (see Table 2) coherently identified as the peak of galaxy and hot-gas density in both the MUSE data (Epinat et al., in prep.), and in the XMM-Newton/Chandra X-rays data (Finoguenov et al. 2007; George et al. 2011; Gozaliasl et al. 2019, and this work – see Table 1 and Sect. 3.2). The asymmetric velocity distribution of galaxy members and a significantly larger velocity dispersion of the star-forming galaxies (σSF = 1085 km s−1) with respect to the quiescent objects (σQ = 697 km s−1) suggest infall into the cluster (Colless & Dunn 1996), as is expected for a cluster still in formation (Fig. 2). The galaxies ID 345 and ID 473 (Fig. 3) have a relative line-of-sight velocity with respect to the cluster of ΔVID 345 = −824 km s−1 and ΔVID 473 = −1903 km s−1, and are thus crossing the cluster from the back. Despite its large line-of-sight velocity, ID 473 has a high probability of being a real member of the cluster. Using more stringent parameters for the friends-of-friends algorithm as low as 375 kpc and 400 km s−1, as suggested by Iovino et al. (2016), it still remains a member.
Properties of the cluster CGr32.
Properties of the two galaxies with tails.
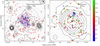 |
Fig. 1. Distribution of galaxies within the cluster CGr32. Left panel: 6′ × 6′ HST ACS (F814W filter, logarithmic scale, arbitrary units) map of COSMOS region, including the CGr32 cluster of galaxies. Spectroscopically identified cluster members within the MUSE data are indicated with blue circles, and galaxies in the Iovino et al. (2016) and Knobel et al. (2012) catalogues within the same redshift range (0.71685 ≤ z ≤ 0.74378) are indicated with red squares. Contours show the X-ray gas distribution (XMM-Newton, 0.5–2 keV, Finoguenov et al. 2007), smoothed with a two-pixel Gaussian. The grey dashed circle represents R200. Right panel: close-up of the region mapped with MUSE. Galaxies are colour coded according to their stellar mass (Epinat et al., in prep.), and those without mass estimates due to blending in broad-band images are shown with black circles. The black star indicates the barycentre of the MUSE cluster members, the black plus sign is the centre quoted by Iovino et al. (2016), and the black cross indicates the X-ray centre of Gozaliasl et al. (2019). The tails of ionised gas are indicated with a blue contour (Σ([OII]) = 1.5 × 10⁻¹⁸ erg s−1 cm−2 arcsec−2). |
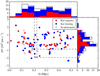 |
Fig. 2. Phase-space diagram of galaxies in cluster CGr32 determined using the barycentre of the cluster members identified spectroscopically with MUSE as the cluster centre. Quiescent galaxies are indicated with red-filled dots, star-forming objects with blue-filled dots. Black open circles show blended galaxies with unavailable broad-band photometry. The galaxies ID 345 and ID 473 are indicated with “S” and “N”, respectively. |
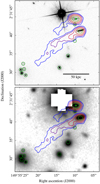 |
Fig. 3. F814W HST ACS (top) and i′-band Suprime-Cam (bottom) images of galaxies ID 345 (south) and ID 473 (north) in cluster CGr32. Other cluster members are shown with green circles. Contours show the [O II] flux map obtained using a Gaussian smoothing of 3 pixels FWHM at a level of Σ([OII]) = 1.5, 3.3, 7.4, 16.3, 36.1, 80.0 × 10⁻¹⁸ erg s−1 cm−2 arcsec−2. Both images (oriented as in the sky, north is up, east on the left) show the lack of any optical counterpart along the tail. |
3. Observations and data reduction
3.1. MUSE spectroscopy
Details of the MUSE observations and data reduction will be presented in a dedicated paper (MAGIC survey paper, Epinat et al., in prep.). Here, we briefly summarise the main steps. The observations of CGr32 were obtained during MUSE-GTO as part of the MAGIC project (Epinat et al., in prep., PI: T. Contini). Three fields were necessary to map the cluster core. An equal observing time of 4.35 h was spent on each field over three observing runs: 1 h per field without adaptive optics (AO) in April 2016 (Programme ID 097.A-0254), 3.3 h per field with AO in March (3.3 h in total, Programme ID 100.A-0607) and April 2018 (6.7 h in total, Programme ID 101.A-0282). For each run, the observing block sequence consisted of four 900 s exposures, each taken after rotating the field by 90°.
For each of the three fields, we produced a single reduction combining all exposures with and without AO. The reduction was performed using the MUSE standard pipeline v1.6 (Weilbacher et al. 2012, 2014; Weilbacher 2015). The data reduction process generates data cubes with a spatial sampling of 0.2″ and a spectral sampling of 1.25 Å. The spatial extent of each field is of one square arcminute, and the spectrum ranges from 4750 Å to 9350 Å.
The point spread function (PSF) of the combined exposures was estimated on each field from a Gaussian fit to the stars present in each datacube. The average full width at half maximum (FWHM) at λ = 6450 Å ranges from 0.60″ to 0.72″ depending on the field. The two galaxies with tails are visible on the same field, which has an FWHM of 0.60″.
We derived [O II]2 flux (Fig. 3) and kinematics (Fig. 4) maps for the two galaxies with tails using CAMEL3 (Epinat et al. 2012), which fits any emission line using a Gaussian function and a polynomial continuum to any pixel of a datacube, after a Gaussian spatial smoothing with an FWHM of 3 × 3 pixels and using a continuum of degree one, mainly to account for the continuum of the strong star in the field, which is close to the two galaxies. We also extracted the same maps with a Gaussian spatial smoothing of 4 × 4 pixels FWHM in order to define masks where the tails are detected in [O II]. The masks were defined using both a flux threshold of 7.5 × 10⁻¹⁹ erg s−1 cm−2 arcsec−2 (1.5 times the surface brightness limit in the smoothed [O II] map) and a criterion on kinematics of the detected structure to remove regions with velocity discontinuities larger than ≈200 km s−1. An additional mask was applied to hide the emission from other galaxies in the group. These final masks were used to produce integrated spectra (and their variance spectra) for both galaxies and associated tails (cf. Fig. 5). The velocity amplitude over these galaxies and tails is ∼400 km s−1, which would broaden emission lines in the spectra integrated over the masks, and thus decrease the signal to noise ratio. Therefore, in order to remove large-scale velocity variations, each pixel is set, before integration, at rest wavelengths using the spatially resolved velocity field shown in Fig. 4. The residual broadening resulting from the uncertainties in the velocity field is ∼30−50 km s−1, which is below the spectral resolution of the MUSE data (see Bacon et al. 2017) over the whole spectral range shown in Fig. 5. The continuum resulting from the bright star was removed from the galaxy ID 473 and its tail spectra by scaling the absorption lines of the star spectrum. For the tail, a residual continuum signal from both the star and a background galaxy was also removed. In the tails, the [O II] doublet flux was then measured as the sum of the spectrum around a narrow spectral window centred on the line, which corresponds to a velocity amplitude of 600 km s−1 around each side of the lines. Uncertainties were determined over the same range from the variance spectrum. The observed fluxes in the tail are given in Table 2. We also measured the mean [O II] doublet ratio within the tail. The mean ratio in the tail of ID 345, the only one where the signal is sufficiently high to make this velocity correction possible, is [O II]λ3729/[O II]λ3726 = 1.15 ± 0.06. It is important to remember, however, that this is a light-weighted mean, probably biased towards the emission of the brightest regions, possibly associated with compact, but unresolved, H II regions. If we try to measure the [O II] doublet ratio pixel per pixel along the tail, its ratio is [O II]λ3729/[O II]λ3726 ≃ 1.5 in more than 50% of the pixels. We also tried to measure Hβ and [O III]λ5007 Å line fluxes in the tails using the masks defined for the [O II] doublet. We obtained a ∼1.5-σ detection of Hβ on the integrated spectrum of the tail associated to ID 345 (fID 345(Hβ) = 7.76 ± 5.25 × 10⁻¹⁸ erg s−1 cm−2), and an upper limit in the tail of ID 473 (σID 473(Hβ) = 1.92 × 10⁻¹⁸ erg s−1 cm−2), as well as upper limits in both tails for the [O III] line (σID 345([OIII]) = 5.23 and σID 473([OIII]) = 2.03 in units of 10−18 erg s−1 cm−2).
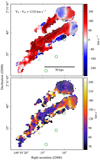 |
Fig. 4. Top panel: velocity fields of the tails obtained using a Gaussian smoothing of 3 pixels FWHM. The two subsystems have been put at rest frames, so that they can be compared on the same figure. Bottom panel: velocity dispersion map of the tail obtained using a Gaussian smoothing of 3 pixels FWHM. The contours correspond to [O II] flux emission as in Fig. 3. The green circles indicate the position of other cluster member galaxies. |
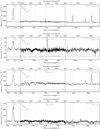 |
Fig. 5. MUSE integrated spectra corrected for variations in the velocity field of galaxy ID 473 (upper panel), its tail (upper middle panel), galaxy ID 345 (lower middle panel), and its tail (lower panel). The associated standard deviation, which is shifted below zero for clarity, is shown in grey. The main lines at the redshift of the sources are indicated with grey dotted vertical lines. An emission around 7500 Å associated with a background [O II] emitter is observed in the spectra of ID 473’s tail. Fluctuations in the spectra of the tails are due to imperfect bright-star continuum subtraction and faint background sources. |
For the two galaxies, we first removed the stellar continuum using pPXF (Cappellari & Emsellem 2004) with the MILES stellar population synthesis library (Falcón-Barroso et al. 2011). We then determined fluxes of Hβ, Hγ, [O II] and [O III] using the same method as for the tails.
3.2. Other data
CGr32 is inside the COSMOS field (Scoville et al. 2007) and has therefore been observed in many bands. We used the HST Advanced Camera for Surveys (ACS) image of the field observed with the F814W filter for a morphological analysis of the two galaxies with GALFIT (Peng et al. 2002), while the Subaru Prime Focus Camera (Suprime-Cam) image in the i′-band (Taniguchi et al. 2007), the deepest available for this field with a limiting surface brightness of 28 mag arcsec−2, was used to search for any possible red stellar population counterpart in the galaxy tails. We also used the XMM-Newton data for the determination of the density profile of the hot ICM. For this purpose, we used the COSMOS mosaic image in the 0.5–2 keV band (Hasinger et al. 2007; Finoguenov et al. 2007) for illustration purposes in Fig. 1, and the OBSID 0203361701 archive data for the extraction of the hot gas density distribution. This is the longest exposure (∼32 ksec) covering CGr32 within the inner 10 arcmin of the FoV. The data were processed following the methodology presented in Pratt et al. (2007) and Bartalucci et al. (2017). The 3D density profile is derived from the surface brightness profile (extracted at the position of the X-ray centre reported in Table 1) using a non-parametric deconvolution and deprojection method with regularisation (Croston et al. 2006, see Fig. 6 and Sect. 5).
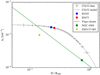 |
Fig. 6. Normalised radial profile of intra-cluster electron density of CGr32 (data as grey points and best fit as a grey solid line) derived from XMM-Newton observation compared to that of the Virgo cluster (green solid line) derived from Suzaku and Planck data (Simionescu et al. 2017). The blue and red dots, the green square, and the yellow star indicate the position of the galaxies ID 345, ID 473 in CGr32, NGC 4569 in Virgo, and ESO 137-001 in Norma, respectively. Norma R500 was estimated using the Sun et al. (2009) mass-temperature relation with kT = 6 keV. |
We determined galaxy parameters, such as stellar mass, star-formation rate (SFR), and extinction, from spectral energy distribution models using the FAST code (Kriek et al. 2009) as described in Epinat et al. (2018) for a similar dataset in the COSMOS field with deep imaging data from the UV to the near-IR. Stellar masses and SFRs are calculated assuming a Chabrier (2003) IMF. The spectrum of ID 345 exhibits asymmetric shapes of the emission lines [O III]λλ4959,5007 and Hβ, which could be explained by a contribution from an AGN. The presence of an AGN is also suggested by its strong observed radio emission at 1.4 GHz (0.115 mJy – Schinnerer et al. 2010 – corresponding to a rest-frame luminosity L(1.4 GHz) = 4 × 10²³ W Hz−1 derived assuming a nonthermal spectral index α = 0.8 – Condon 1992). Should such an AGN indeed be present, this could bias the SFR derived from the SED fitting. For the galaxy ID 473, where the photometry is highly contaminated by a nearby star, the stellar mass is just a rough estimate. For this galaxy, the SFR was determined using two different methods, the first one from the Hβ emission line corrected for dust attenuation using the Balmer decrement, the second one from the observed [O II] line using the Moustakas et al. (2006) calibration.
4. Analysis
4.1. Physical properties
The MUSE observations of the cluster reveal the presence of an extended tail of ionised gas detected in the [O II] line associated with the two galaxies ID 345 and ID 473, as depicted in Fig. 3. The two tails, which extend from the galaxy discs in the south-east direction, are 13.4″ (97 kpc) and 4.7″ (34 kpc) long (projected distance), and 2.9″ (21 kpc) and 2.1″ (15 kpc) wide (see Table 2). The deep optical images of the cluster do not show any stellar counterpart associated with the extended ionised gas tail (Fig. 3) down to a surface brightness limit of ≃28 mag arcsec−2 in the i′-band. The orientation of the tails, which in both cases is parallel to the stellar disc major axis, also indicates that the gas stripping occurs edge-on. Figure 5 shows the spectra of the galaxies and their tails.
We can compare the properties of the tails to those observed in local galaxies. Unfortunately, at this redshift, the Hα line is outside the spectral domain of MUSE, while Hβ is only barely detected (1.5-σ detection) in the tail of ID 345 and undetected in ID 473, we thus have to derive the intensity of the [O II] line and convert it into Hα assuming a standard [O II]/Hα ratio. Spectroscopic observations of the tails of ionised gas in ram-pressure stripped galaxies of the local Universe are limited to the spectral domain λ ≥ 4000−9000 Å (Yoshida et al. 2004, 2012; Fossati et al. 2016; Poggianti et al. 2017), preventing any estimate of this ratio from local measurement. The only direct measurement of the [O II]/Hα ratio in the stripped material of local galaxies is the value derived by Cortese et al. (2006) around some gravitationally perturbed galaxies in the cluster A1367 ([O II]/Hα ≃ 2). We do not expect the physical properties of the stripped gas, which is not associated with any stellar component and is probably embedded in a similarly hot and dense ICM, to differ significantly from those observed in A1367. This value is consistent with the value derived using the 1.5-σ detection of Hβ in the tail of ID 345 ([O II]/Hβ = 14.6) and the 3-σ upper limit in ID 473 ([O II]/Hβ ≥ 4.6), and adopting Hα/Hβ = 2.86, if we make the reasonable assumption that the dust attenuation is negligible. We thus derive the Hα luminosity assuming [O II]/Hα = 2 (L(Hα) = 1.3 × 1041 erg s−1 for ID 345 and L(Hα) = 2.5 × 1040 erg s−1 for ID 473) and the mean surface brightness of the tails (Σ(Hα) = 1.5 × 10⁻¹⁸ erg s−1 arcsec−2 for ID 345 and Σ(Hα) = 1.3 × 10⁻¹⁸ erg s−1 arcsec−2 for ID 473). These numbers, which are close to the detection limits of modern instrumentation, are comparable to those observed in the nearby Universe. Due to cosmological surface brightness dimming, however, when transformed to physical units, both Hα luminosities and surface brightnesses are a factor of ∼10 higher than those measured in local systems.
We can also use the [O II]λ3729/[O II]λ3726 line ratio to derive the gas density within the tails. For a mean value of [O II]λ3729/[O II]λ3726 = 1.15 ± 0.06 measured on the integrated spectrum of the tail of ID 345, the corresponding electron density is ne ≃ 200 cm−3. As mentioned in Sect. 3.1, however, this is a light-weighted mean, and is thus probably biased towards the brightest and highest density regions, unresolved in the MUSE data. Indeed, this gas density perfectly matches that observed in star-forming regions of galaxies at z ≃ 2 (Sanders et al. 2016). The typical line ratio measured pixel per pixel in the diffuse tail is [O II]λ3729/[O II]λ3726 ≃ 1.5, corresponding to a gas density ne ≲ 10 cm−3 (Osterbrock & Ferland 2006). This upper limit is consistent with the gas density derived from the [S II]λ6716/[S II]λ6731 line ratio measured in the diffuse tails of local galaxies, or independently with geometrical considerations (e.g. Fossati et al. 2016; Boselli et al. 2016a). As in Boselli et al. (2016a) and Fossati et al. (2016), we can also estimate the typical recombination time of the ionised gas,
 (1)
(1)
where αA is the total recombination coefficient (αA = 4.2 × 10⁻¹³ cm3 s−1; Osterbrock & Ferland 2006). For ne = 10 cm−3, τrec ≃ 104 yr, a very short time compared to the travel time of the tail (τtravel ≃ 108 yr).
This very short recombination time suggests that, as in local galaxies, a source of gas excitation within the tail must be present. In the case where photoionisation, which requires the presence of star-forming regions within the tail, is lacking, other ionising mechanisms include thermal conduction, magneto hydrodynamics waves, and shocks (Fossati et al. 2016; Boselli et al. 2016a). The presence of shock-ionised gas is suggested by the high [O II]/[O III]λ5007 ratio observed in the tails ([O II]/[O III]λ5007 ≳ 7 and 4.5 in ID 345 and ID 473, respectively, Dopita & Sutherland 1995). Part of the stripped gas might still be in other phases such as cold HI, or hot-gas emitting in X-rays, as suggested by simulations (Tonnesen & Bryan 2010, 2012).
4.2. Kinematical properties
Figure 4 shows the velocity field and the velocity dispersion map of the ionised gas over the two perturbed galaxies and along the tails. The velocity field of both galaxies is very symmetric, and the difference between the receding and approaching sides of both almost edge-on rotating (> 70°) discs is ∼300 km s−1. In addition, the size of the two galaxies is quite similar, which suggests that they have a comparable dynamical mass (cf. Table 2). The velocity of the gas is fairly constant along the tails, and is a bit higher than that of the associated galaxies, which means that the gas is decelerated in the tail, confirming its stripped-gas origin. This difference is higher for the northern galaxy ID 473 (ΔV ∼ 100 km s−1). The low velocities (in blue) associated with a higher velocity dispersion in the southern tail are caused by the overlap of the tail with a galaxy of the cluster with a lower velocity than the tail (cf. Fig. 3). The velocity dispersion of the gas is high in the southern galaxy ID 345 (∼131 km s−1), which seems to host an active galactic nucleus (based on broad lines and a high [O III]λ5007/Hβ ratio around 3.5 on the integrated spectrum). It is lower (∼75 km s−1) in the northern galaxy ID 473, while the velocity dispersion of the gas along both tails is fairly high (∼80 km s−1). It should be noted, however, that this is a light-weighted estimate of the velocity dispersion of the gas within the tails. It is comparable to the median dispersion along tails (∼90 km s−1) determined on the velocity dispersion map (see Fig. 4), but much more uncertain, due to the low signal-to-noise. Similar velocity dispersions have been observed within the tail of local galaxies (e.g. ESO 137-001, Fumagalli et al. 2014.)
5. Discussion
The presence of long tails of ionised gas without any old stellar counterpart suggests that the two galaxies are now undergoing a ram-pressure stripping episode. The derived density, mass, and recombination time of ionised gas stripped during the interaction, as well as the shape and size of the tail associated to the two galaxies ID 345 and ID 473, are very similar to those observed in the massive spiral NGC 4569 in the Virgo cluster, or ESO 137-001 in the Norma (A3627) cluster. The conditions for gas stripping via ram pressure, ρICMV2 > 2πGΣgas Σstar (Gunn & Gott 1972), where Σgas and Σstar are the density of gas and stars over the disc of the galaxy, can be compared to those encountered in these nearby counterparts. Indeed, the velocity dispersion of the cluster CGr32 (⟨Vcluster⟩≃930 km s−1) is close to that of Virgo (⟨Vcluster⟩≃800 km s−1, Boselli et al. 2014b) and Norma (⟨Vcluster⟩≃925 km s−1, Sun et al. 2010), where ram-pressure stripping is active.
We use the radial profile of the intracluster electron density, ne, derived from XMM-Newton data (see Sect. 3.2) to estimate ne at the position of the two target galaxies (Fig. 6). The azimuthal mean densities of the hot intracluster gas at the position of the two galaxies ID 345 and ID 473, are ne = 1.7 × 10⁻³ and ne = 1.6 × 10⁻³ cm−3, respectively. These densities are comparable to those encountered in similar clusters in the redshift range z = 0.7 to z = 0 (Giodini et al. 2013; McDonald et al. 2017).
These electron densities can also be compared to those measured in the Virgo cluster at a similar radial distance from the cluster core (ne ≃ 2 × 10⁻³ cm−3 at 100 kpc, ne ≃ 10−3 cm−3 at 200 kpc), or at the distance of NGC 4569 (ne ≃ 2 × 10⁻⁴ cm−3 at 500 kpc)4 as derived from Suzaku and Planck data by Simionescu et al. (2017). They can also be compared to those in the Norma cluster at the distance of ESO 137-001 (ne ≃ 10−3 cm−3 at 180 kpc, Sun et al. 2010). The conditions encountered by the galaxies ID 345 and ID 473 in the cluster CGr32, very similar to those observed in similar objects in the local Universe, are optimal for an efficient ram-pressure stripping event. The gas column density over the disc of the two galaxies is probably higher than those present in ESO 137-001 and NGC 4569, while the stellar density is probably lower, just because they are observed at much earlier epochs (z = 0.7). In particular, we recall that NGC 4569 is a bulge-dominated Sa galaxy. The relative absolute line-of-sight velocities with respect to the mean velocity of the cluster are VID 345 − ⟨VCGr32⟩= − 824 km s−1 and VID 473 − ⟨VCGr32⟩= − 1903 km s−1. The projected extension of the ionised gas tails suggests that the galaxies are also moving on the plane of the sky, thus these values should be considered as lower limits. These numbers can also be compared to the relative line-of-sight velocity of NGC 4569 with respect to Virgo, VNGC 4569 − ⟨VVirgo⟩ = 1176 km s−1, ESO 137-001 with respect to Norma, VESO 137−001 − ⟨VNorma⟩ = 191 km s−1, and UGC 6697 with respect to A1367, VUGC 6697 − ⟨VA1367⟩ = 132 km s−1. This simple comparison suggests that, as in their local counterparts, ID 345 and ID 473 are suffering a ram-pressure stripping event. It is also worth mentioning that one of the two galaxies, ID 345, shows prominent Balmer absorption lines (see Fig. 5), typical in objects suffering an abrupt variation in star-formation activity. Its position above the main sequence (at z = 0.7 main sequence galaxies of Mstar ∼ 1010 M⊙ have star-formation rates SFR ∼ 10 M⊙ yr−1, Whitaker et al. 2014) suggests that this galaxy might have undergone a moderate starburst phase induced by the compression of the gas along the disc (e.g. Bekki 2014). The decrease in activity indicated by the prominent Balmer absorption lines might result after gas ablation, which in a ram-pressure stripping event occurs outside-in, and reduces the activity of star-formation in the outer disc, as indeed observed in local galaxies (e.g. Boselli et al. 2006, 2016b; Fossati et al. 2018). We can also mention that the edge-on orientation of the galaxies on the plane of the sky, and in the direction of the stripping, favours the detection of the optically thin ablated gas just for projection effects.
The parallel orientation of the tails of the two galaxies is, however, striking. It is very unlikely that these two objects are members of a group, and are thus gravitationally interacting while infalling into the cluster. Their relative velocity is very high (VID 473 − VID 345 = 1079 km s−1), thus the duration of the tidal encounter is too short to induce important modifications (Boselli & Gavazzi 2006). Furthermore, if both galaxies were members of the same infalling group, they would be spiralling around the centre of gravity, producing twisted tails, as observed in the blue infalling group in A1367 (Cortese et al. 2006; Fossati et al. 2019). We remark that both tails are oriented from the galaxies to the south-east, the same direction of the filamentary structure joining the cluster CGr32 to the COSMOS Wall (Iovino et al. 2016). This might indicate that both galaxies have been accreted from this structure and have just crossed the cluster. Their difference in velocity might just indicate that they come from a different region of the COSMOS Wall, which seems to extend over several Mpc along the line-of-sight (Iovino et al. 2016).
If the gas keeps the dynamical imprint of the region from where it has been stripped and is decelerated by the interaction with the hot ICM, as observed in local edge-on galaxy UGC 6697 in A1367 (Consolandi et al. 2017), Fig. 4 can be interpreted as follows: in the northern galaxy ID 473 the gas is decelerated in the tail with respect to the galaxy, which means that the trajectory of the galaxy within the cluster is not on the plane of the sky, but rather on the line of sight, thus, the galaxy is crossing the cluster from the background. This could explain why the tail is relatively short compared to that of ID 345. In the southern galaxy ID 345, the less pronounced velocity offset between the galaxy and the tail, and the extension of the tail, suggest that the trajectory of the galaxy within the cluster is mainly on the plane of the sky. The observed large velocities along the tail may be a due to a combination of gas in the tail being decelerated, and gas being stripped from the receding side of the galaxy. The two galaxies show a relatively high velocity dispersion of gas both in their discs and in the tails (∼100 km s−1). Given their almost edge-on trajectories, this could result from the contribution of gas stripped from both the approaching and receding sides of the rotating disc, whose contribution cannot be resolved because of beam smearing, as observed in the edge-on galaxy UGC 6697 in A1367 (Consolandi et al. 2017). We notice, however, that the velocity dispersion of the gas in the tail is smaller than the maximal rotational difference between the two sides of both galaxies (∼150–200 km s−1). To conclude, ID 345 has probably already passed the pericentre, while ID 473 is a fresh infaller as suggested by its position in the phase-space diagram. Galaxies with properties similar to ID 345 (eccentric position in the phase-space and tails oriented toward the cluster centre), although unusual, are also present in local clusters (e.g. NGC 4569, Boselli et al. 2014b, 2016a).
We can also compare the properties of the two galaxies to the most recent results from cosmological hydrodynamic simulations, and in particular to the predictions of IllustrisTNG (Yun et al. 2019), which are perfectly tuned for a comparison with our target, since they have been obtained for simulated galaxies (Mstar ≥ 109.5 M⊙) and clusters (1013 M⊙ ≤ M200 ≤ 1014.6 M⊙) of similar mass. These simulations indicate that galaxies with tails of stripped gas due to ram-pressure stripping are frequent in clusters with a redshift z < 0.6. About 30% of the disc galaxies have such a cometary shape in the gaseous component5, with a very week dependence on redshift. They also show that these objects are more frequent at intermediate to large clustercentric radii (r/R200 ≥ 0.25, which corresponds to ≃250–400 kpc for the cluster CGr32), in galaxies with a high velocity with respect to the mean velocity of the cluster, and in more massive clusters. The simulations also show that the orientation of the tail, which generally traces the trajectory of the galaxy within the high-density region, does not depend on the relative position of the galaxy with respect to the cluster centre. ID 345 and ID 473 are located at ≃200 kpc in projection from the cluster core, and have tails oriented almost towards the cluster centre, and a high velocity along the line of sight with respect to that of the cluster, and thus match all the properties of perturbed galaxies in the simulations.
6. Conclusion
As part of the MUSE-gAlaxy Groups In Cosmos (MAGIC) GTO programme, we observed the cluster of galaxies CGr32 (M200 ≃ 2 × 10¹⁴ M⊙) at z = 0.73. The MUSE observations reveal the presence of two massive (Mstar ≃ 1010 M⊙) galaxies with extended low-surface brightness tails of diffuse gas detected in the [O II] emission-line doublet. The cometary shape of the tails, and the lack of any diffuse stellar counterpart in the very deep Suprime-Cam images, clearly indicate that the two galaxies are undergoing a ram-pressure stripping event. This result is thus the first evidence that the dynamical interaction between the cold galaxy ISM with the hot and dense ICM, which is probably the dominant perturbing mechanism in high-density environments in the local Universe, was also active at earlier epochs, when the Universe was only half its present age. This result is consistent with the predictions of the most recent cosmological simulations of galaxy evolution.
The density of the gas within the tail derived using the [O II]λ3729/[O II]λ3726 line ratio indicates that the recombination time, τrec ≃ 104 yr, is very short compared to the travel time of the tail, τtravel ≃ 108 yr, as is often observed in local galaxies. This suggests that a source of gas excitation must be present within the tail. To conclude, this work is further confirmation that the extraordinary IFU capabilities of MUSE in terms of field of view and sensitivity can be successfully used to extend local studies to the high redshift Universe, thus opening a new era in the study of the role of the environment on galaxy evolution.
The distinction between quiescent and star-forming galaxies is made from their distribution in the main sequence diagram as suggested by Barro et al. (2017), and consistently with Boselli et al. (2014b). Stellar masses and star-formation rates have been derived as described in Sect. 3.2.
Hereafter [O II] refers to the [O II]λλ3727–3729 Å emission-line doublet.
The electron density of the ICM at the distance of NGC 4569 is significantly different to the one reported in Boselli et al. (2016a), which was based on old ROSAT data.
Since these simulations do not discriminate between the different gas phases, it is not astonishing that the fraction of galaxies with observed tails in the ionised gas is significantly lower than 30%.
Acknowledgments
We thank the anonymous referee for constructive comments and suggestions. This work was supported by the Programme National Cosmology et Galaxies (PNCG) of CNRS/INSU with INP and IN2P3, co-funded by CEA and CNES. This work has been carried out thanks to the support of the ANR FOGHAR (ANR-13-BS05-0010-02), the OCEVU Labex (ANR-11-LABX-0060) and the A*MIDEX project (ANR-11-IDEX-0001-02) funded by the “Investissements d’Avenir” French government programme managed by the ANR. VA acknowledges the COLCIENCIAS (Colombia) PhD fellowship programme No. 756-2016. JB acknowledges support by FCT/MCTES through national funds by grant UID/FIS/04434/2019 and through Investigador FCT Contract No. IF/01654/2014/CP1215/CT0003. This work made use of observations obtained with XMM-Newton, an ESA science mission with instruments and contributions directly funded by ESA Member States and NASA.
References
- Bacon, R., Conseil, S., Mary, D., et al. 2017, A&A, 608, A1 [NASA ADS] [CrossRef] [EDP Sciences] [Google Scholar]
- Barro, G., Faber, S. M., Koo, D. C., et al. 2017, ApJ, 840, 47 [NASA ADS] [CrossRef] [Google Scholar]
- Bartalucci, I., Arnaud, M., Pratt, G. W., et al. 2017, A&A, 598, A61 [NASA ADS] [CrossRef] [EDP Sciences] [Google Scholar]
- Bekki, K. 2014, MNRAS, 438, 444 [NASA ADS] [CrossRef] [Google Scholar]
- Betti, S. K., Pope, A., Scoville, N., et al. 2019, ApJ, 874, 53 [NASA ADS] [CrossRef] [Google Scholar]
- Boselli, A., & Gavazzi, G. 2006, PASP, 118, 517 [NASA ADS] [CrossRef] [Google Scholar]
- Boselli, A., & Gavazzi, G. 2014, A&ARv, 22, 74 [NASA ADS] [CrossRef] [Google Scholar]
- Boselli, A., Boissier, S., Cortese, L., et al. 2006, ApJ, 651, 811 [NASA ADS] [CrossRef] [Google Scholar]
- Boselli, A., Cortese, L., Boquien, M., et al. 2014a, A&A, 564, A67 [NASA ADS] [CrossRef] [EDP Sciences] [Google Scholar]
- Boselli, A., Voyer, E., Boissier, S., et al. 2014b, A&A, 570, A69 [NASA ADS] [CrossRef] [EDP Sciences] [Google Scholar]
- Boselli, A., Fossati, M., Gavazzi, G., et al. 2015, A&A, 579, A102 [NASA ADS] [CrossRef] [EDP Sciences] [Google Scholar]
- Boselli, A., Cuillandre, J. C., Fossati, M., et al. 2016a, A&A, 587, A68 [NASA ADS] [CrossRef] [EDP Sciences] [Google Scholar]
- Boselli, A., Roehlly, Y., Fossati, M., et al. 2016b, A&A, 596, A11 [NASA ADS] [CrossRef] [EDP Sciences] [Google Scholar]
- Boselli, A., Fossati, M., Consolandi, G., et al. 2018a, A&A, 620, A164 [Google Scholar]
- Boselli, A., Fossati, M., Ferrarese, L., et al. 2018b, A&A, 614, A56 [NASA ADS] [CrossRef] [EDP Sciences] [Google Scholar]
- Byrd, G., & Valtonen, M. 1990, ApJ, 350, 89 [NASA ADS] [CrossRef] [Google Scholar]
- Cappellari, M., & Emsellem, E. 2004, PASP, 116, 138 [NASA ADS] [CrossRef] [Google Scholar]
- Cayatte, V., van Gorkom, J. H., Balkowski, C., & Kotanyi, C. 1990, AJ, 100, 604 [NASA ADS] [CrossRef] [Google Scholar]
- Cayatte, V., Kotanyi, C., Balkowski, C., & van Gorkom, J. H. 1994, AJ, 107, 1003 [NASA ADS] [CrossRef] [Google Scholar]
- Chabrier, G. 2003, PASP, 115, 763 [Google Scholar]
- Chung, A., van Gorkom, J. H., Kenney, J. D. P., & Vollmer, B. 2007, ApJ, 659, L115 [NASA ADS] [CrossRef] [Google Scholar]
- Colless, M., & Dunn, A. M. 1996, ApJ, 458, 435 [NASA ADS] [CrossRef] [Google Scholar]
- Condon, J. J. 1992, ARA&A, 30, 575 [NASA ADS] [CrossRef] [MathSciNet] [Google Scholar]
- Consolandi, G., Gavazzi, G., Fossati, M., et al. 2017, A&A, 606, A83 [NASA ADS] [CrossRef] [EDP Sciences] [Google Scholar]
- Contini, T., Epinat, B., Bouché, N., et al. 2016, A&A, 591, A49 [NASA ADS] [CrossRef] [EDP Sciences] [Google Scholar]
- Cortese, L., Gavazzi, G., Boselli, A., et al. 2006, A&A, 453, 847 [Google Scholar]
- Cortese, L., Marcillac, D., Richard, J., et al. 2007, MNRAS, 376, 157 [NASA ADS] [CrossRef] [Google Scholar]
- Cortese, L., Davies, J. I., Pohlen, M., et al. 2010, A&A, 518, L49 [NASA ADS] [CrossRef] [EDP Sciences] [Google Scholar]
- Cortese, L., Ciesla, L., Boselli, A., et al. 2012, A&A, 540, A52 [NASA ADS] [CrossRef] [EDP Sciences] [Google Scholar]
- Cowie, L. L., & Songaila, A. 1977, Nature, 266, 501 [Google Scholar]
- Croston, J. H., Arnaud, M., Pointecouteau, E., & Pratt, G. W. 2006, A&A, 459, 1007 [NASA ADS] [CrossRef] [EDP Sciences] [Google Scholar]
- De Lucia, G., Weinmann, S., Poggianti, B. M., Aragón-Salamanca, A., & Zaritsky, D. 2012, MNRAS, 423, 1277 [NASA ADS] [CrossRef] [Google Scholar]
- Dopita, M. A., & Sutherland, R. S. 1995, ApJ, 455, 468 [NASA ADS] [CrossRef] [Google Scholar]
- Dressler, A. 1980, ApJ, 236, 351 [NASA ADS] [CrossRef] [Google Scholar]
- Dressler, A. 2004, in Clusters of Galaxies: Probes of Cosmological Structure and Galaxy Evolution, eds. J. S.Mulchaey, A.Dressler, & A.Oemler, 206 [Google Scholar]
- Dressler, A., Oemler, A., Couch, W. J., et al. 1997, ApJ, 490, 577 [NASA ADS] [CrossRef] [Google Scholar]
- Ebeling, H., Stephenson, L. N., & Edge, A. C. 2014, ApJ, 781, L40 [Google Scholar]
- Epinat, B., Tasca, L., Amram, P., et al. 2012, A&A, 539, A92 [NASA ADS] [CrossRef] [EDP Sciences] [Google Scholar]
- Epinat, B., Contini, T., Finley, H., et al. 2018, A&A, 609, A40 [NASA ADS] [CrossRef] [EDP Sciences] [Google Scholar]
- Falcón-Barroso, J., Sánchez-Blázquez, P., Vazdekis, A., et al. 2011, A&A, 532, A95 [NASA ADS] [CrossRef] [EDP Sciences] [Google Scholar]
- Finoguenov, A., Guzzo, L., Hasinger, G., et al. 2007, ApJS, 172, 182 [NASA ADS] [CrossRef] [Google Scholar]
- Fossati, M., Gavazzi, G., Boselli, A., & Fumagalli, M. 2012, A&A, 544, A128 [NASA ADS] [CrossRef] [EDP Sciences] [Google Scholar]
- Fossati, M., Gavazzi, G., Savorgnan, G., et al. 2013, A&A, 553, A91 [NASA ADS] [CrossRef] [EDP Sciences] [Google Scholar]
- Fossati, M., Fumagalli, M., Boselli, A., et al. 2016, MNRAS, 455, 2028 [Google Scholar]
- Fossati, M., Mendel, J. T., Boselli, A., et al. 2018, A&A, 614, A57 [NASA ADS] [CrossRef] [EDP Sciences] [Google Scholar]
- Fossati, M., Fumagalli, M., Gavazzi, G., et al. 2019, MNRAS, 484, 2212 [NASA ADS] [CrossRef] [Google Scholar]
- Fumagalli, M., Fossati, M., Hau, G. K. T., et al. 2014, MNRAS, 445, 4335 [Google Scholar]
- Gavazzi, G., Boselli, A., Mayer, L., et al. 2001, ApJ, 563, L23 [NASA ADS] [CrossRef] [Google Scholar]
- Gavazzi, G., Fumagalli, M., Fossati, M., et al. 2013, A&A, 553, A89 [NASA ADS] [CrossRef] [EDP Sciences] [Google Scholar]
- Gavazzi, G., Consolandi, G., Yagi, M., & Yoshida, M. 2017, A&A, 606, A131 [NASA ADS] [CrossRef] [EDP Sciences] [Google Scholar]
- Gavazzi, G., Consolandi, G., Gutierrez, M. L., Boselli, A., & Yoshida, M. 2018, A&A, 618, A130 [NASA ADS] [CrossRef] [EDP Sciences] [Google Scholar]
- George, M. R., Leauthaud, A., Bundy, K., et al. 2011, ApJ, 742, 125 [NASA ADS] [CrossRef] [Google Scholar]
- Giodini, S., Lovisari, L., Pointecouteau, E., et al. 2013, Space Sci. Rev., 177, 247 [NASA ADS] [CrossRef] [Google Scholar]
- Gnedin, O. Y. 2003, ApJ, 589, 752 [NASA ADS] [CrossRef] [Google Scholar]
- Gozaliasl, G., Finoguenov, A., Tanaka, M., et al. 2019, MNRAS, 483, 3545 [NASA ADS] [CrossRef] [Google Scholar]
- Gunn, J. E., & Gott, III, R., 1972, ApJ, 176, 1 [NASA ADS] [CrossRef] [Google Scholar]
- Hasinger, G., Cappelluti, N., Brunner, H., et al. 2007, ApJS, 172, 29 [NASA ADS] [CrossRef] [Google Scholar]
- Iovino, A., Petropoulou, V., Scodeggio, M., et al. 2016, A&A, 592, A78 [NASA ADS] [CrossRef] [EDP Sciences] [Google Scholar]
- Jáchym, P., Kenney, J. D. P., Ržuička, A., et al. 2013, A&A, 556, A99 [NASA ADS] [CrossRef] [EDP Sciences] [Google Scholar]
- Jáchym, P., Combes, F., Cortese, L., Sun, M., & Kenney, J. D. P. 2014, ApJ, 792, 11 [NASA ADS] [CrossRef] [Google Scholar]
- Jáchym, P., Sun, M., Kenney, J. D. P., et al. 2017, ApJ, 839, 114 [NASA ADS] [CrossRef] [Google Scholar]
- Kenney, J. D. P., Tal, T., Crowl, H. H., Feldmeier, J., & Jacoby, G. H. 2008, ApJ, 687, L69 [Google Scholar]
- Knobel, C., Lilly, S. J., Iovino, A., et al. 2012, ApJ, 753, 121 [NASA ADS] [CrossRef] [Google Scholar]
- Koopmann, R. A., Kenney, J. D. P., & Young, J. 2001, ApJS, 135, 125 [NASA ADS] [CrossRef] [Google Scholar]
- Kriek, M., van Dokkum, P. G., Labbé, I., et al. 2009, ApJ, 700, 221 [NASA ADS] [CrossRef] [Google Scholar]
- Larson, R. B., Tinsley, B. M., & Caldwell, C. N. 1980, ApJ, 237, 692 [NASA ADS] [CrossRef] [Google Scholar]
- McDonald, M., Allen, S. W., Bayliss, M., et al. 2017, ApJ, 843, 28 [NASA ADS] [CrossRef] [Google Scholar]
- McPartland, C., Ebeling, H., Roediger, E., & Blumenthal, K. 2016, MNRAS, 455, 2994 [NASA ADS] [CrossRef] [Google Scholar]
- Merritt, D. 1983, ApJ, 264, 24 [NASA ADS] [CrossRef] [Google Scholar]
- Moore, B., Lake, G., & Katz, N. 1998, ApJ, 495, 139 [NASA ADS] [CrossRef] [Google Scholar]
- Moustakas, J., Kennicutt, R. C., & Tremonti, C. A. 2006, ApJ, 642, 775 [NASA ADS] [CrossRef] [Google Scholar]
- Nulsen, P. E. J. 1982, MNRAS, 198, 1007 [Google Scholar]
- Osterbrock, D. E., & Ferland, G. J. 2006, Astrophysics of Gaseous Nebulae and Active Galactic Nuclei (Sausalito: University Science Books) [Google Scholar]
- Owers, M. S., Couch, W. J., Nulsen, P. E. J., & Randall, S. W. 2012, ApJ, 750, L23 [Google Scholar]
- Peng, C. Y., Ho, L. C., Impey, C. D., & Rix, H.-W. 2002, AJ, 124, 266 [Google Scholar]
- Poggianti, B. M., Smail, I., Dressler, A., et al. 1999, ApJ, 518, 576 [NASA ADS] [CrossRef] [Google Scholar]
- Poggianti, B. M., von der Linden, A., De Lucia, G., et al. 2006, ApJ, 642, 188 [NASA ADS] [CrossRef] [Google Scholar]
- Poggianti, B. M., Moretti, A., Gullieuszik, M., et al. 2017, ApJ, 844, 48 [Google Scholar]
- Pratt, G. W., Böhringer, H., Croston, J. H., et al. 2007, A&A, 461, 71 [NASA ADS] [CrossRef] [EDP Sciences] [Google Scholar]
- Sanders, R. L., Shapley, A. E., Kriek, M., et al. 2016, ApJ, 816, 23 [Google Scholar]
- Sarazin, C. L. 1986, Rev. Mod. Phys., 58, 1 [NASA ADS] [CrossRef] [Google Scholar]
- Schinnerer, E., Sargent, M. T., Bondi, M., et al. 2010, ApJS, 188, 384 [NASA ADS] [CrossRef] [Google Scholar]
- Scott, T. C., Cortese, L., Brinks, E., et al. 2012, MNRAS, 419, L19 [NASA ADS] [CrossRef] [Google Scholar]
- Scoville, N., Aussel, H., Brusa, M., et al. 2007, ApJS, 172, 1 [NASA ADS] [CrossRef] [Google Scholar]
- Simionescu, A., Werner, N., Mantz, A., Allen, S. W., & Urban, O. 2017, MNRAS, 469, 1476 [NASA ADS] [CrossRef] [Google Scholar]
- Sun, M., Jones, C., Forman, W., et al. 2006, ApJ, 637, L81 [NASA ADS] [CrossRef] [Google Scholar]
- Sun, M., Donahue, M., & Voit, G. M. 2007, ApJ, 671, 190 [Google Scholar]
- Sun, M., Voit, G. M., Donahue, M., et al. 2009, ApJ, 693, 1142 [NASA ADS] [CrossRef] [Google Scholar]
- Sun, M., Donahue, M., Roediger, E., et al. 2010, ApJ, 708, 946 [NASA ADS] [CrossRef] [Google Scholar]
- Taniguchi, Y., Scoville, N., Murayama, T., et al. 2007, ApJS, 172, 9 [NASA ADS] [CrossRef] [Google Scholar]
- Tonnesen, S., & Bryan, G. L. 2010, ApJ, 709, 1203 [NASA ADS] [CrossRef] [Google Scholar]
- Tonnesen, S., & Bryan, G. L. 2012, MNRAS, 422, 1609 [NASA ADS] [CrossRef] [Google Scholar]
- Vulcani, B., Treu, T., Schmidt, K. B., et al. 2016, ApJ, 833, 178 [NASA ADS] [CrossRef] [Google Scholar]
- Weilbacher, P. 2015, in Science Operations 2015: Science Data Management– An ESO/ESA Workshop, 1 [Google Scholar]
- Weilbacher, P. M., Streicher, O., Urrutia, T., et al. 2012, in Software and Cyberinfrastructure for Astronomy II, SPIE Conf. Ser., 8451, 84510B [CrossRef] [Google Scholar]
- Weilbacher, P. M., Streicher, O., Urrutia, T., et al. 2014, in Astronomical Data Analysis Software and Systems XXIII, eds. N. Manset, & P. Forshay, ASP Conf. Ser., 485, 451 [Google Scholar]
- Whitaker, K. E., Franx, M., Leja, J., et al. 2014, ApJ, 795, 104 [NASA ADS] [CrossRef] [MathSciNet] [Google Scholar]
- Yagi, M., Komiyama, Y., Yoshida, M., et al. 2007, ApJ, 660, 1209 [NASA ADS] [CrossRef] [Google Scholar]
- Yagi, M., Yoshida, M., Komiyama, Y., et al. 2010, AJ, 140, 1814 [Google Scholar]
- Yagi, M., Gu, L., Koyama, Y., et al. 2015, AJ, 149, 36 [NASA ADS] [CrossRef] [Google Scholar]
- Yagi, M., Yoshida, M., Gavazzi, G., et al. 2017, ApJ, 839, 65 [NASA ADS] [CrossRef] [Google Scholar]
- Yoshida, M., Yagi, M., Okamura, S., et al. 2002, ApJ, 567, 118 [NASA ADS] [CrossRef] [Google Scholar]
- Yoshida, M., Ohyama, Y., Iye, M., et al. 2004, AJ, 127, 90 [NASA ADS] [CrossRef] [Google Scholar]
- Yoshida, M., Yagi, M., Komiyama, Y., et al. 2012, ApJ, 749, 43 [NASA ADS] [CrossRef] [Google Scholar]
- Yun, K., Pillepich, A., Zinger, E., et al. 2019, MNRAS, 483, 1042 [NASA ADS] [CrossRef] [Google Scholar]
- Zhang, B., Sun, M., Ji, L., et al. 2013, ApJ, 777, 122 [NASA ADS] [CrossRef] [Google Scholar]
All Tables
All Figures
|
Fig. 1. Distribution of galaxies within the cluster CGr32. Left panel: 6′ × 6′ HST ACS (F814W filter, logarithmic scale, arbitrary units) map of COSMOS region, including the CGr32 cluster of galaxies. Spectroscopically identified cluster members within the MUSE data are indicated with blue circles, and galaxies in the Iovino et al. (2016) and Knobel et al. (2012) catalogues within the same redshift range (0.71685 ≤ z ≤ 0.74378) are indicated with red squares. Contours show the X-ray gas distribution (XMM-Newton, 0.5–2 keV, Finoguenov et al. 2007), smoothed with a two-pixel Gaussian. The grey dashed circle represents R200. Right panel: close-up of the region mapped with MUSE. Galaxies are colour coded according to their stellar mass (Epinat et al., in prep.), and those without mass estimates due to blending in broad-band images are shown with black circles. The black star indicates the barycentre of the MUSE cluster members, the black plus sign is the centre quoted by Iovino et al. (2016), and the black cross indicates the X-ray centre of Gozaliasl et al. (2019). The tails of ionised gas are indicated with a blue contour (Σ([OII]) = 1.5 × 10⁻¹⁸ erg s−1 cm−2 arcsec−2). |
| In the text | |
|
Fig. 2. Phase-space diagram of galaxies in cluster CGr32 determined using the barycentre of the cluster members identified spectroscopically with MUSE as the cluster centre. Quiescent galaxies are indicated with red-filled dots, star-forming objects with blue-filled dots. Black open circles show blended galaxies with unavailable broad-band photometry. The galaxies ID 345 and ID 473 are indicated with “S” and “N”, respectively. |
| In the text | |
|
Fig. 3. F814W HST ACS (top) and i′-band Suprime-Cam (bottom) images of galaxies ID 345 (south) and ID 473 (north) in cluster CGr32. Other cluster members are shown with green circles. Contours show the [O II] flux map obtained using a Gaussian smoothing of 3 pixels FWHM at a level of Σ([OII]) = 1.5, 3.3, 7.4, 16.3, 36.1, 80.0 × 10⁻¹⁸ erg s−1 cm−2 arcsec−2. Both images (oriented as in the sky, north is up, east on the left) show the lack of any optical counterpart along the tail. |
| In the text | |
|
Fig. 4. Top panel: velocity fields of the tails obtained using a Gaussian smoothing of 3 pixels FWHM. The two subsystems have been put at rest frames, so that they can be compared on the same figure. Bottom panel: velocity dispersion map of the tail obtained using a Gaussian smoothing of 3 pixels FWHM. The contours correspond to [O II] flux emission as in Fig. 3. The green circles indicate the position of other cluster member galaxies. |
| In the text | |
|
Fig. 5. MUSE integrated spectra corrected for variations in the velocity field of galaxy ID 473 (upper panel), its tail (upper middle panel), galaxy ID 345 (lower middle panel), and its tail (lower panel). The associated standard deviation, which is shifted below zero for clarity, is shown in grey. The main lines at the redshift of the sources are indicated with grey dotted vertical lines. An emission around 7500 Å associated with a background [O II] emitter is observed in the spectra of ID 473’s tail. Fluctuations in the spectra of the tails are due to imperfect bright-star continuum subtraction and faint background sources. |
| In the text | |
|
Fig. 6. Normalised radial profile of intra-cluster electron density of CGr32 (data as grey points and best fit as a grey solid line) derived from XMM-Newton observation compared to that of the Virgo cluster (green solid line) derived from Suzaku and Planck data (Simionescu et al. 2017). The blue and red dots, the green square, and the yellow star indicate the position of the galaxies ID 345, ID 473 in CGr32, NGC 4569 in Virgo, and ESO 137-001 in Norma, respectively. Norma R500 was estimated using the Sun et al. (2009) mass-temperature relation with kT = 6 keV. |
| In the text | |
Current usage metrics show cumulative count of Article Views (full-text article views including HTML views, PDF and ePub downloads, according to the available data) and Abstracts Views on Vision4Press platform.
Data correspond to usage on the plateform after 2015. The current usage metrics is available 48-96 hours after online publication and is updated daily on week days.
Initial download of the metrics may take a while.