Fig. 1.
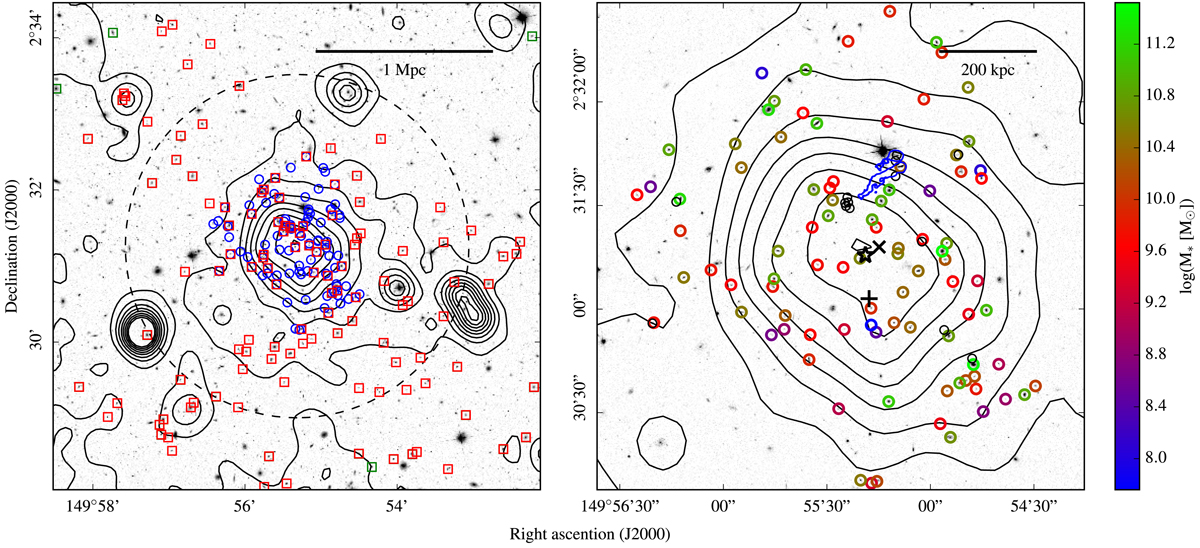
Distribution of galaxies within the cluster CGr32. Left panel: 6′ × 6′ HST ACS (F814W filter, logarithmic scale, arbitrary units) map of COSMOS region, including the CGr32 cluster of galaxies. Spectroscopically identified cluster members within the MUSE data are indicated with blue circles, and galaxies in the Iovino et al. (2016) and Knobel et al. (2012) catalogues within the same redshift range (0.71685 ≤ z ≤ 0.74378) are indicated with red squares. Contours show the X-ray gas distribution (XMM-Newton, 0.5–2 keV, Finoguenov et al. 2007), smoothed with a two-pixel Gaussian. The grey dashed circle represents R200. Right panel: close-up of the region mapped with MUSE. Galaxies are colour coded according to their stellar mass (Epinat et al., in prep.), and those without mass estimates due to blending in broad-band images are shown with black circles. The black star indicates the barycentre of the MUSE cluster members, the black plus sign is the centre quoted by Iovino et al. (2016), and the black cross indicates the X-ray centre of Gozaliasl et al. (2019). The tails of ionised gas are indicated with a blue contour (Σ([OII]) = 1.5 × 10⁻¹⁸ erg s−1 cm−2 arcsec−2).
Current usage metrics show cumulative count of Article Views (full-text article views including HTML views, PDF and ePub downloads, according to the available data) and Abstracts Views on Vision4Press platform.
Data correspond to usage on the plateform after 2015. The current usage metrics is available 48-96 hours after online publication and is updated daily on week days.
Initial download of the metrics may take a while.