Fig. 11.
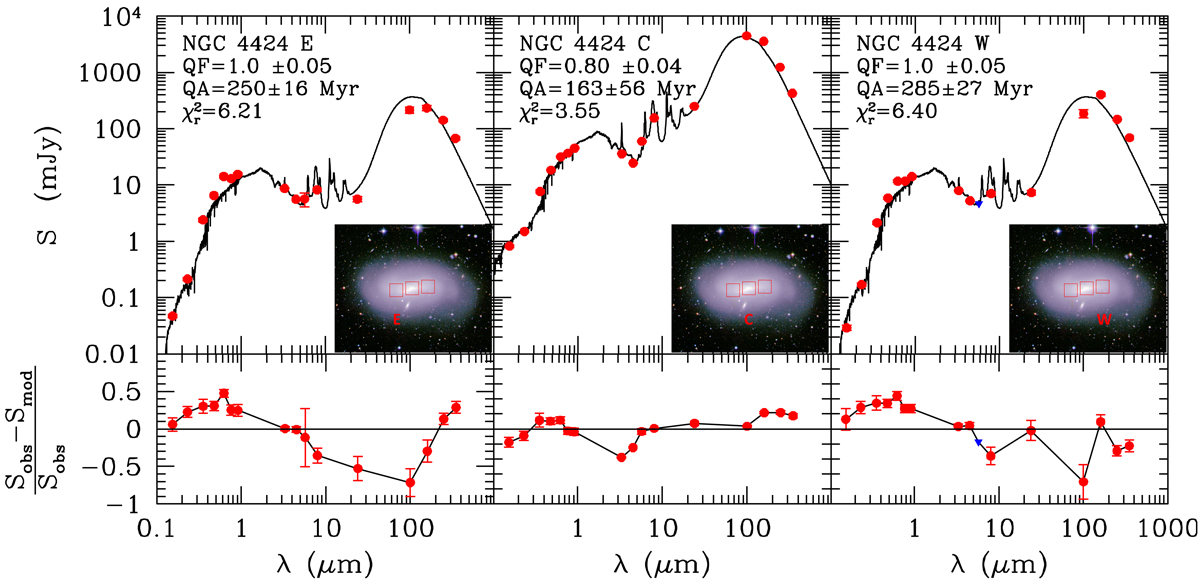
Far-UV to far-IR SED of the three selected regions along the disc of NGC 4424 (from east to west). In each panel the observational data and their error bars are indicated with red filled dots, the upper limit with a blue triangle; the black solid line shows the best fit model. The inset shows the colour gri RGB image of the galaxy; overlayed are the red boxes indicating the three fields used to study the SED with the CIGALE fitting code.
Current usage metrics show cumulative count of Article Views (full-text article views including HTML views, PDF and ePub downloads, according to the available data) and Abstracts Views on Vision4Press platform.
Data correspond to usage on the plateform after 2015. The current usage metrics is available 48-96 hours after online publication and is updated daily on week days.
Initial download of the metrics may take a while.