Free Access
Fig. 8.
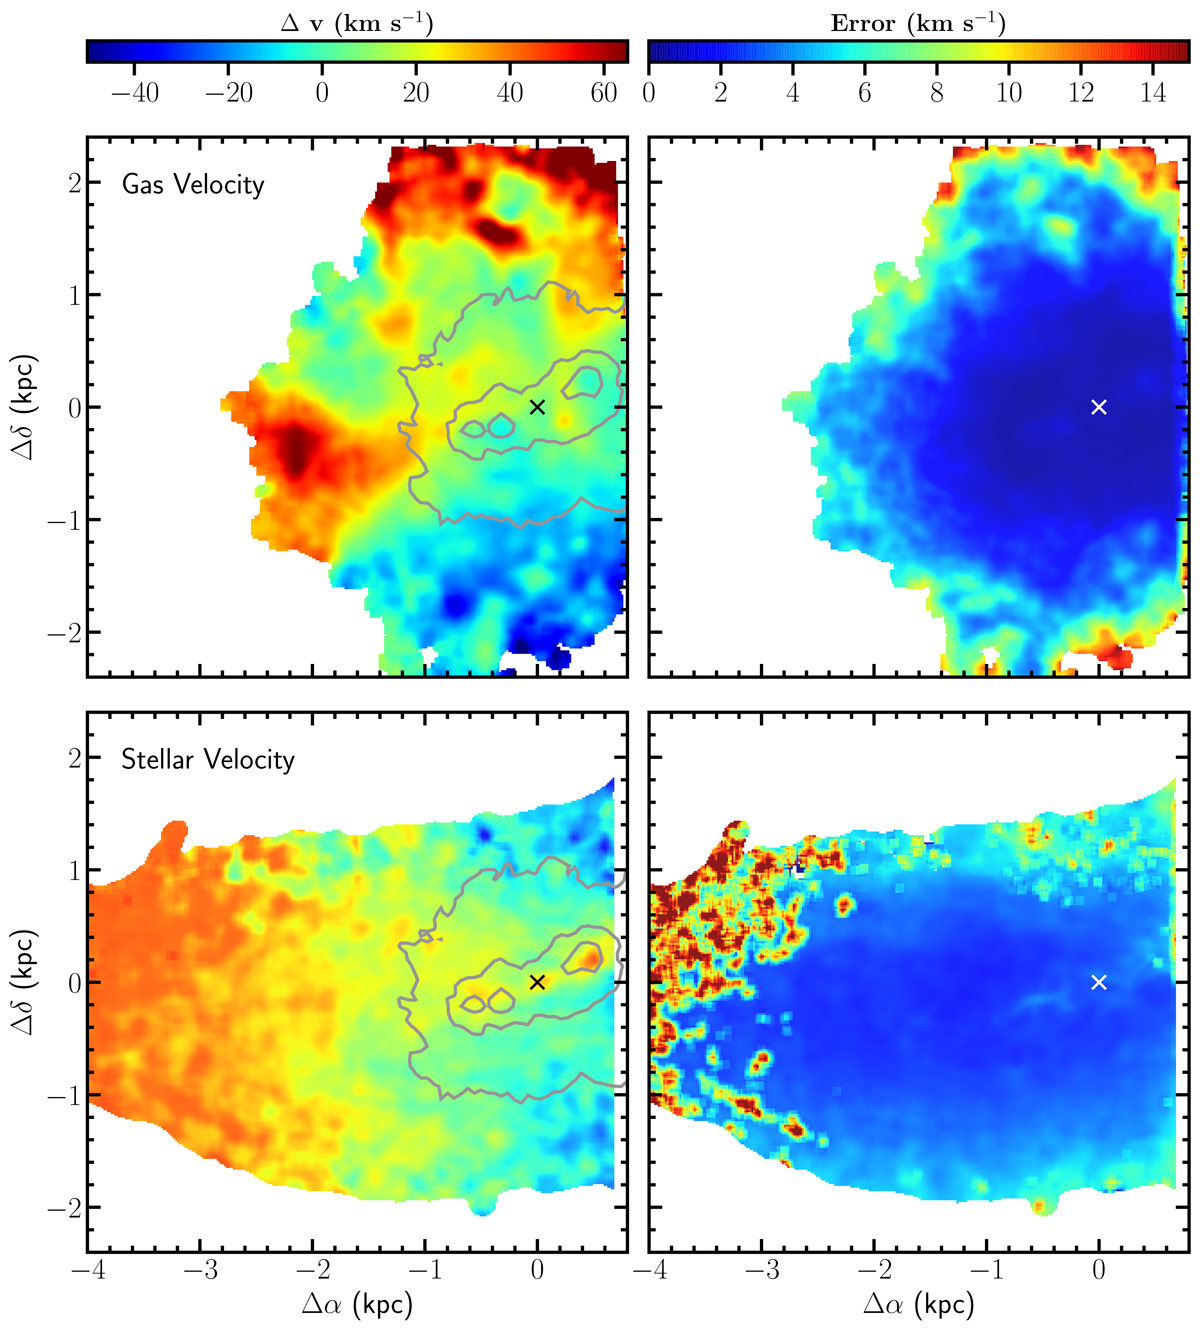
Velocity field (left panels) and error maps (right panels) of the gaseous (upper panels) and stellar (lower panels) components derived from the MUSE data. The black and white crosses indicate the position of the nucleus, the grey contours the distribution of the Hα emitting gas.
Current usage metrics show cumulative count of Article Views (full-text article views including HTML views, PDF and ePub downloads, according to the available data) and Abstracts Views on Vision4Press platform.
Data correspond to usage on the plateform after 2015. The current usage metrics is available 48-96 hours after online publication and is updated daily on week days.
Initial download of the metrics may take a while.