Fig. A.1
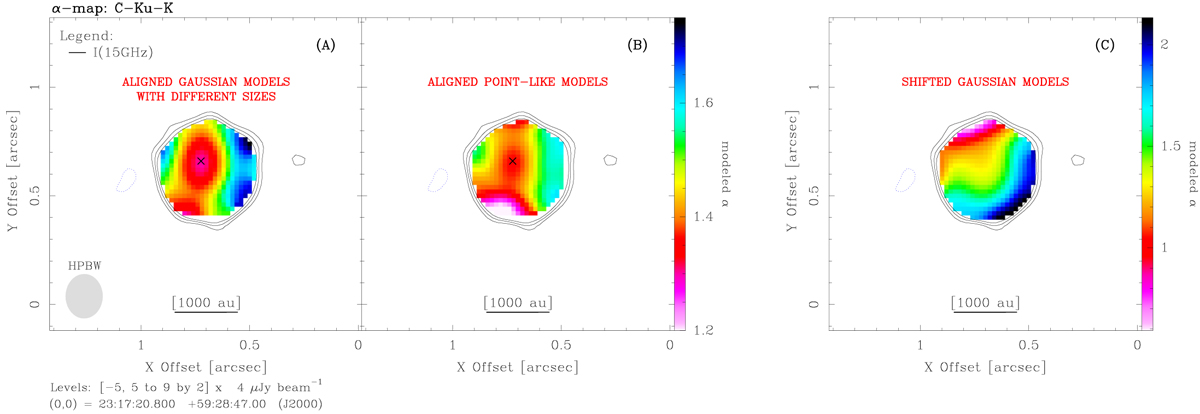
Simulated spectral index maps for field G111.24−1.24 in Fig. A.2. Labels and symbols as in Fig. 1. Panels a–c: spectral index maps (colors) obtained assuming three different source models at the C, Ku, and K bands. Black contours are those of the observed average brightness map for a direct comparison with Fig. A.2. The cross in panels a and b indicate the peak position of the observed C-band emission.
Current usage metrics show cumulative count of Article Views (full-text article views including HTML views, PDF and ePub downloads, according to the available data) and Abstracts Views on Vision4Press platform.
Data correspond to usage on the plateform after 2015. The current usage metrics is available 48-96 hours after online publication and is updated daily on week days.
Initial download of the metrics may take a while.