Fig. 5
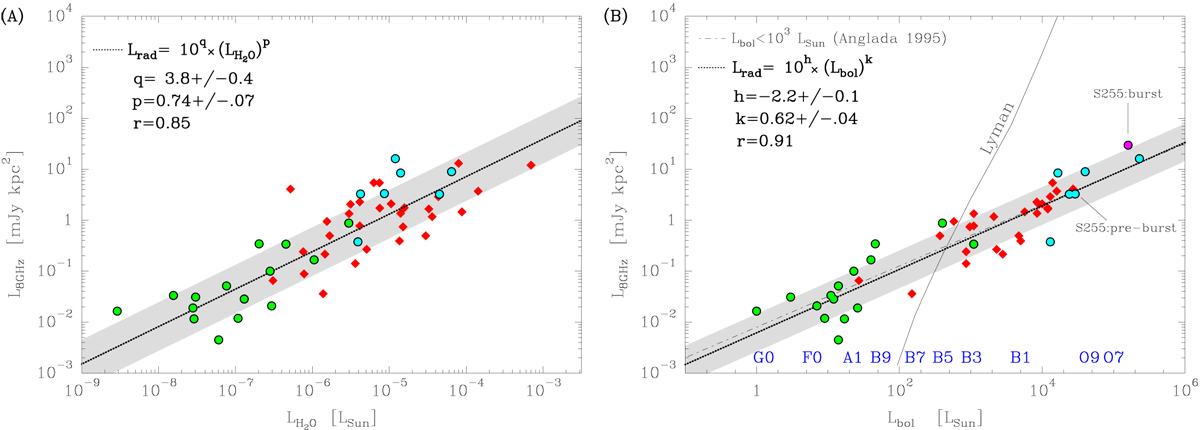
Dependence of the radio luminosity of the POETS sample on the H2O maser (panel a) and bolometric (panel b) luminosities (Sect. 4.5). Radio continuum luminosities have been normalized to 8 GHz for comparison with previous works, and a logarithmic scale is used. Panel a: red diamonds indicate the POETS sample (Table 1); cyan circles denote additional H2O maser sites associated with luminous, prototypical radio thermal jets (Table 3); green circles represent low-luminosity H2O maser sites (from Furuya et al. 2003). The dotted bold line traces the χ2 fit to the sample distribution; the gray shadow shows the dispersion (1σ) about the best fit. The parameters and uncertainties of the best fit, q and p, are reported in the upper left, together with the linear correlation coefficient of the distribution (r). Panel b: same symbols as in panela. The parameters of the best fit, h and k, are to be compared with, e.g., Anglada et al. (2015); Purser et al. (2016). The best fit to the low-mass radio jet luminosites is drawn with a dash-dotted line (from Anglada 1995). The solid line traces the ionized flux expected from the Lyman continuum of ZAMS stars earlier than B8 (seeSect. 4.5). For ZAMS stars, spectral types, corresponding to a given luminosity, are indicated in blue near the lower axis (from Thompson 1984). The pink circle indicates the bolometric and radio luminosities of source S255 NIRS3 during its recent accretion burst, for comparison (Caratti o Garatti et al. 2017; Cesaroni et al. 2018).
Current usage metrics show cumulative count of Article Views (full-text article views including HTML views, PDF and ePub downloads, according to the available data) and Abstracts Views on Vision4Press platform.
Data correspond to usage on the plateform after 2015. The current usage metrics is available 48-96 hours after online publication and is updated daily on week days.
Initial download of the metrics may take a while.