Fig. 4
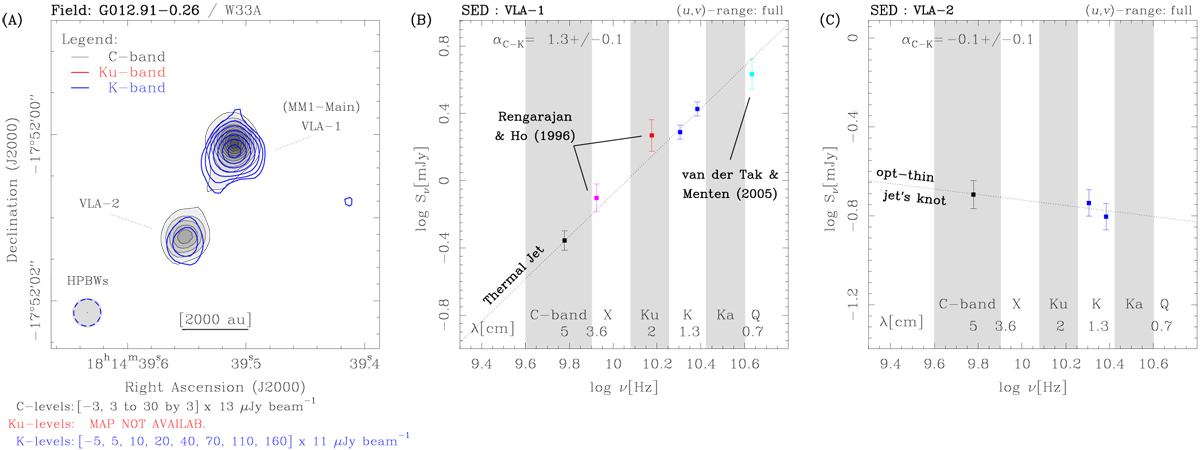
Example of radio thermal jet (VLA–1) with nearby knot (VLA–2): H2O maser site G012.91−0.26 or W33A (Sect. 4.4). Labels and symbols as in Fig. 1. Two radio continuum sources are detected at both C and K bands along a position angle of approximately 152° (panel a): the brightest emission coincides in position with the brightest millimeter source in the dusty core MM1. Panelsb and c: we fitted the spectral index of sources VLA–1 and VLA–2 with the measured fluxes at C and K bands, after dividing the K-band observations into two sub-bands, each spanning 4 GHz. Panelb: fluxes reported in the literature at X (pink), Ku (red), and Q (cyan) bands are consistent with a single linear slope, i.e., from 4 to 43 GHz. The radio continuum emission associated with W33A–MM1 can be interpreted as a thermal jet, whose components VLA–1 and VLA–2 indicate the ionized gas closest to the driving source, namely, MM1-main, and a knot of shocked gas along the jet direction, respectively.
Current usage metrics show cumulative count of Article Views (full-text article views including HTML views, PDF and ePub downloads, according to the available data) and Abstracts Views on Vision4Press platform.
Data correspond to usage on the plateform after 2015. The current usage metrics is available 48-96 hours after online publication and is updated daily on week days.
Initial download of the metrics may take a while.