Fig. 3
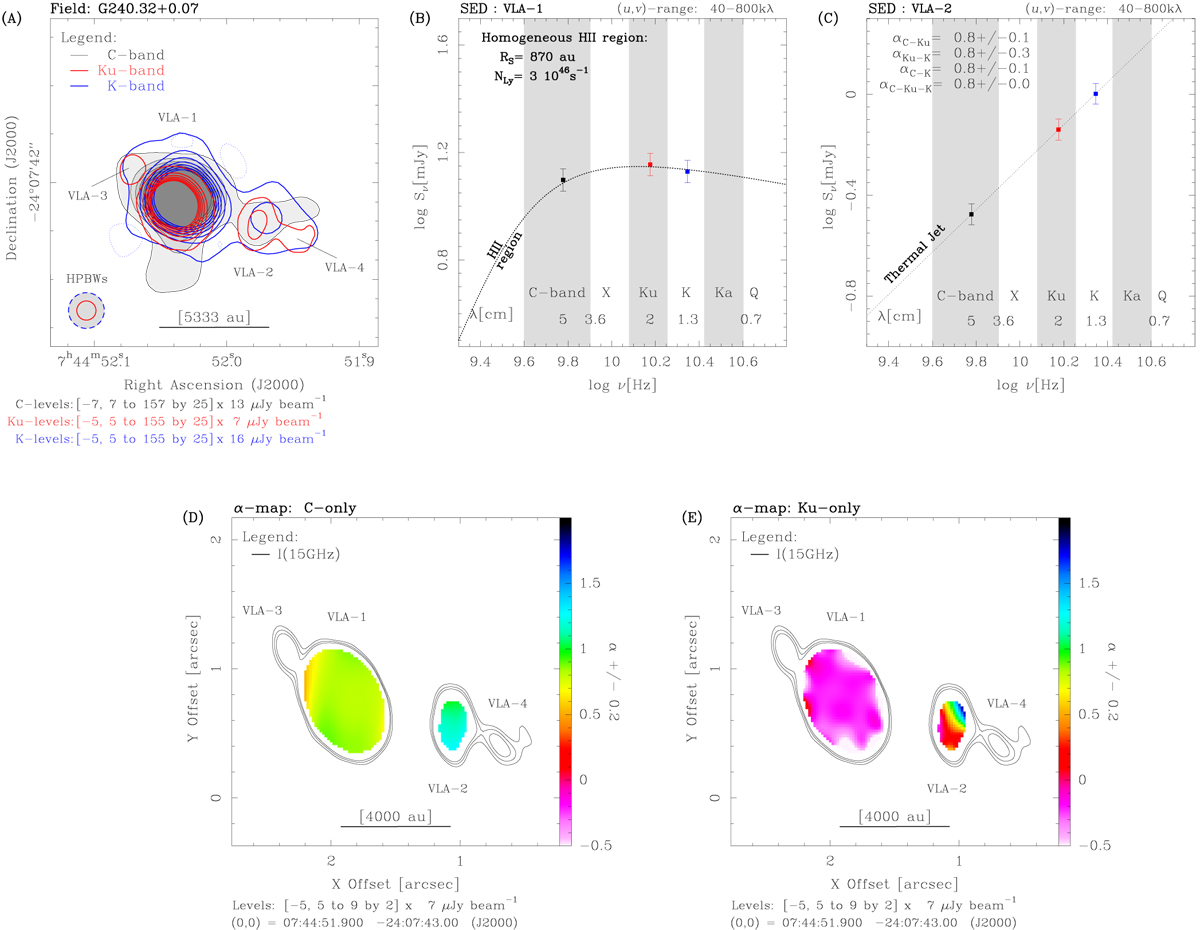
Example of radio thermal jet (VLA–2) near a HCH II region (VLA–1): H2O maser site G240.32+0.07 (Sect. 4.3). Labels and symbols as in Fig. 1. The SED of source VLA–1 was fitted with a model of homogeneous H II region (panelb) with Strömgren radius of 870 au and number of Lyman photons of 3 × 1046 s−1. This model accurately reproduces the observed fluxes at each band. Thanks to the high S/N, in panels d and e we can determine the spectral index maps of the C and Ku bands separately with an uncertainty better than ±0.2. The average brightness map (contours) is that of the Ku band in both panels d and e, for comparison. The spectral index maps trace the turnover of the continuum spectrum for source VLA–1 from α = 1.0–6.0 between 4 and 8 GHz (paneld) to α = –0.1 above 15 GHz (panele).
Current usage metrics show cumulative count of Article Views (full-text article views including HTML views, PDF and ePub downloads, according to the available data) and Abstracts Views on Vision4Press platform.
Data correspond to usage on the plateform after 2015. The current usage metrics is available 48-96 hours after online publication and is updated daily on week days.
Initial download of the metrics may take a while.