Fig. 2
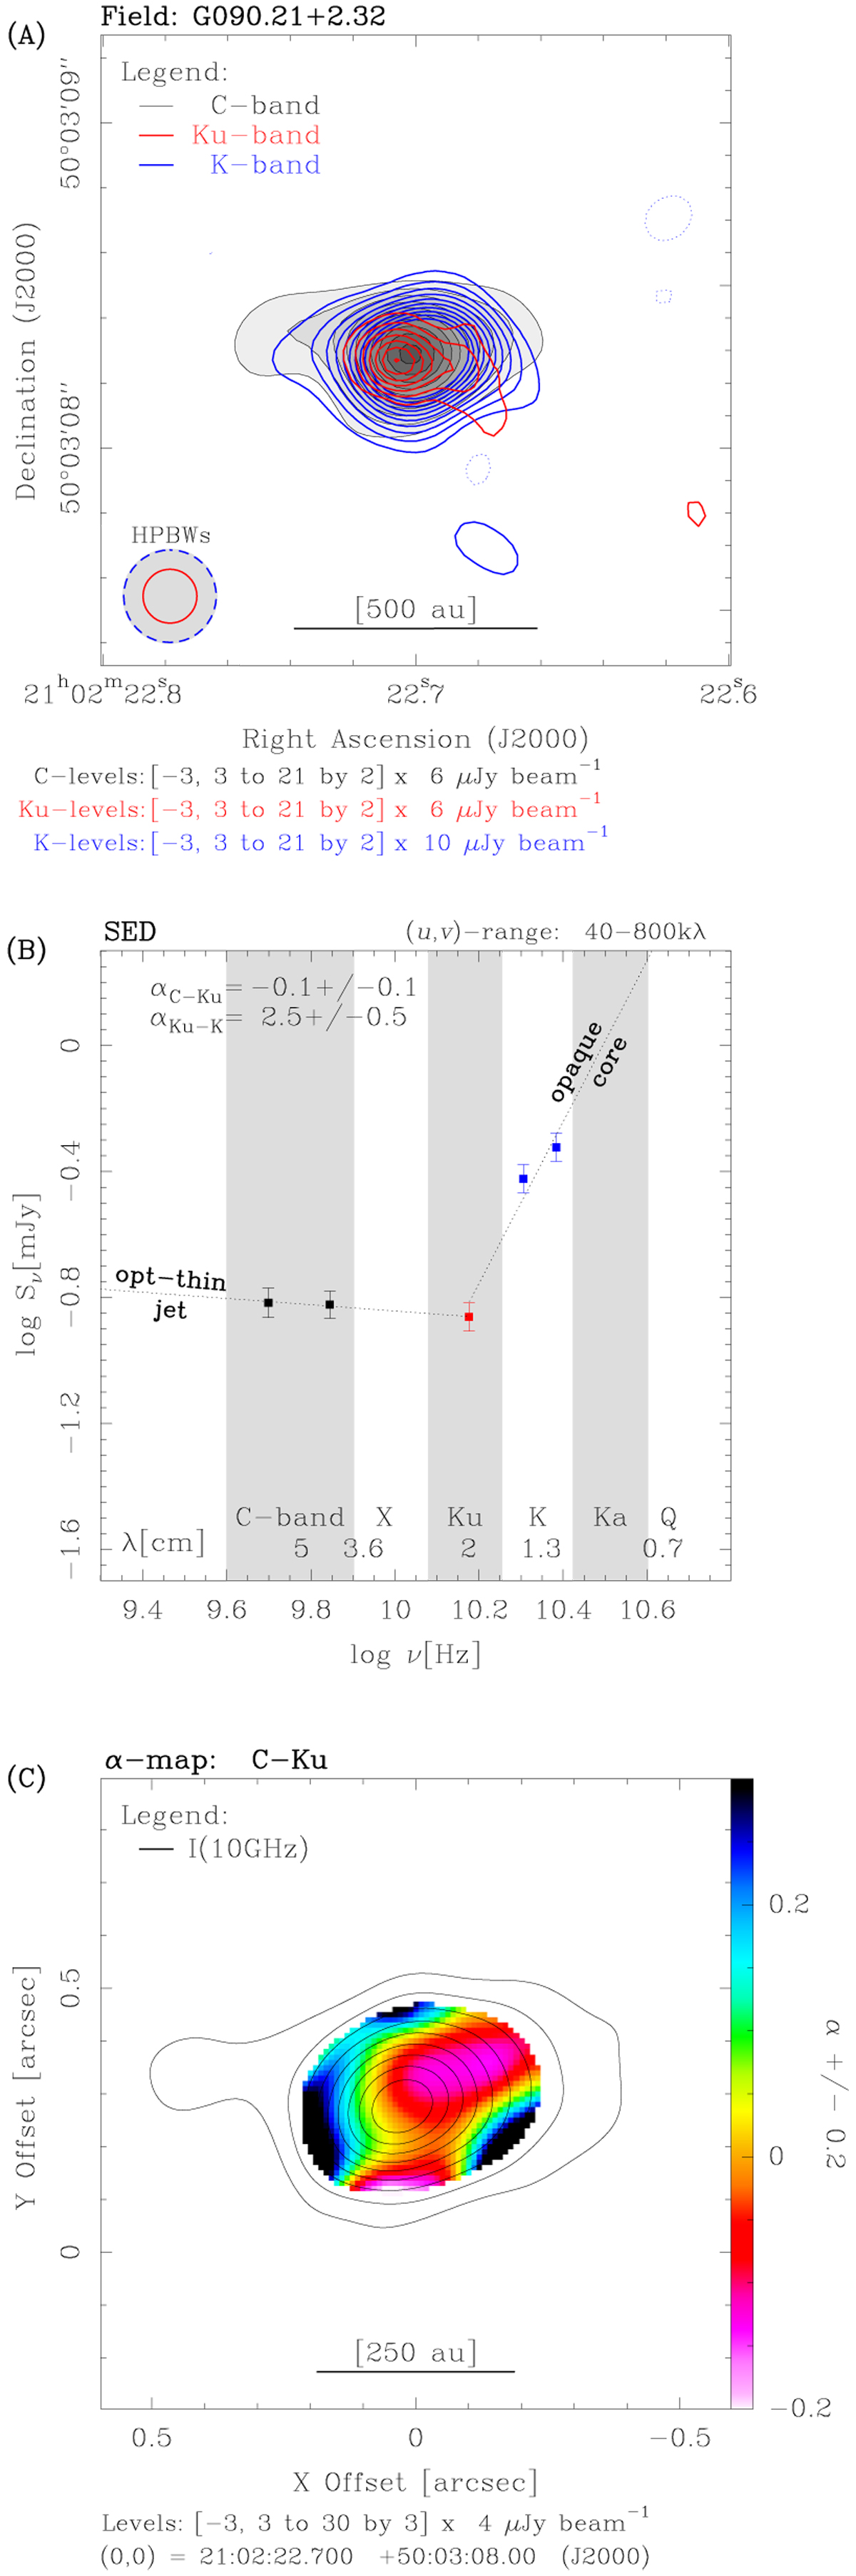
Example of optically thin thermal jet emission: H2O maser site G090.21+2.32 (Sect. 4.2). Labels and symbols as in Fig. 1. Panelb: we divided the C and K bands in twosub-bands to show that the spectral index within each band is consistent with the spectral index interpolated to the Ku-band frequency. The SED shows a region of optically thin (resolved) emission below 15 GHz and a region of optically thick (compact) emission above 15 GHz. The spectral index map of panelc was computed within the (linear) range of optically thin emission (C and Ku bands only).
Current usage metrics show cumulative count of Article Views (full-text article views including HTML views, PDF and ePub downloads, according to the available data) and Abstracts Views on Vision4Press platform.
Data correspond to usage on the plateform after 2015. The current usage metrics is available 48-96 hours after online publication and is updated daily on week days.
Initial download of the metrics may take a while.