Fig. 1
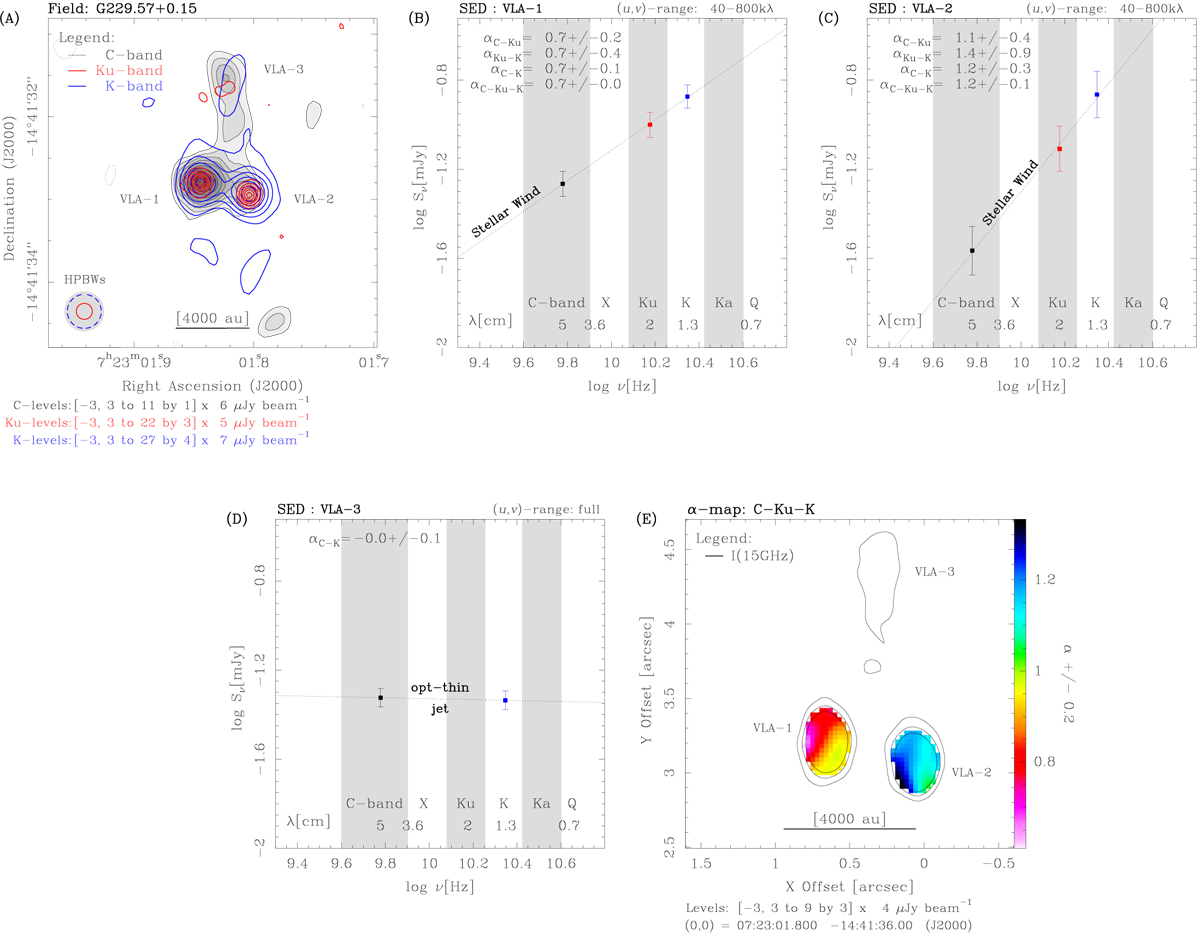
Example of stellar wind emission from a double system: H2O maser site G229.57+0.15 (Sect. 4.1). Panela: superposition of the VLA maps for the C- (grayscale/black contours), Ku- (red), and K-band (blue) emission (Sect. 3.1). Contour levels, at multiples of the 1σ rms, are indicated in the footnote. Synthesized beams for each band are shown in the bottom left corner. A scale bar in units of au is drawn near the bottom axis. Three distinct continuum sources are identified and labeled VLA–1, VLA–2, and VLA–3 from the brightest to the faintest. Panelsb–d: spectral energy distribution for the three sources identified in panela separately (Sect. 3.2). Each plot shows the logarithm of the integrated flux (in mJy) as a function of the logarithm of the observed frequency (in Hz). Various frequency bands are labeled near the bottom axis together with the reference wavelength; gray shades indicate the boundary of each band. For each band combination, the linear spectral index value (α) and its uncertainty are specified in the upper left corner. The common range of uv distances (e.g., 40–800 kλ in panelb and full uv range in panel d) used to compute the integrated fluxes among the bands is indicated in the upper right. Panele: color map of the linear spectral index (α) computed with the MFS algorithm of the task clean of CASA (Sect. 3.3). Frequency bands used to fit the spectralindex are listed on top; spectral index values are quantified by the right-hand wedge. The uncertainty on α is indicated in the wedge label; this value is an upper limit that holds at the 7σ contour of the average brightness map (black contours). Contour levels of the average brightness map, at multiples of the 1σ rms, are indicated in the footnote; the central frequency (ν0) of the average brightness map is specified in the legend. The absolute coordinates of (0,0) offset are indicated in the footnote (see Table 1). Radio continuum components and the scale bar as in panela.
Current usage metrics show cumulative count of Article Views (full-text article views including HTML views, PDF and ePub downloads, according to the available data) and Abstracts Views on Vision4Press platform.
Data correspond to usage on the plateform after 2015. The current usage metrics is available 48-96 hours after online publication and is updated daily on week days.
Initial download of the metrics may take a while.