| Issue |
A&A
Volume 619, November 2018
|
|
|---|---|---|
| Article Number | A35 | |
| Number of page(s) | 14 | |
| Section | Catalogs and data | |
| DOI | https://doi.org/10.1051/0004-6361/201730717 | |
| Published online | 07 November 2018 | |
86 GHz SiO maser survey of late-type stars in the Inner Galaxy
IV. SiO emission and infrared data for sources in the Scutum and Sagittarius-Carina arms, 20° < l < 50°⋆
1
Key Laboratory for Researches in Galaxies and Cosmology, University of Science and Technology of China, Chinese Academy of Sciences, Hefei, Anhui, 230026 PR China
e-mail: This email address is being protected from spambots. You need JavaScript enabled to view it.
2
Leiden Observatory, PO Box 9513 2300 RA Leiden, The Netherlands
3
National Radio Astronomy Observatory, PO Box 0 Socorro NM, 87801 USA
4
Institut d’Astrophysique de Paris CNRS, 98bis Boulevard Arago, 75014 Paris, France
5
Max-Planck-Institut für Radioastronomie, Auf dem Hügel 69, 53121 Bonn, Germany
Received:
1
March
2017
Accepted:
11
May
2018
Abstract
We present an 86 GHz SiO (v = 1, J = 2 → 1) maser search toward late-type stars located within |b|< 0.°5 and 20° < l < 50°. This search is an extension at longer longitudes of a previously published work. We selected 135 stars from the MSX catalog using color and flux criteria and detected 92 (86 new detections). The detection rate is 68%, the same as in our previous study. The last few decades have seen the publication of several catalogs of point sources detected in infrared surveys (MSX, 2MASS, DENIS, ISOGAL, WISE, GLIMPSE, AKARI, and MIPSGAL). We searched each catalog for data on the 444 targets of our earlier survey and for the 135 in the survey reported here. We confirm that, as anticipated, most of our targets have colors typical of oxygen-rich asymptotic giant branch (AGB) stars. Only one target star may have already left the AGB. Ten stars have colors typical of carbon-rich stars, meaning a contamination of our sample with carbon stars ≲1.7%.
Key words: circumstellar matter / stars: AGB and post-AGB / stars: late-type / Galaxy: kinematics and dynamics / catalogs / masers
The full Table 3 is only available in electronic form at the CDS via anonymous ftp to cdsarc.u-strasbg.fr (130.79.128.5) or via http://cdsarc.u-strasbg.fr/viz-bin/qcat?J/A+A/619/A35
MM is currently employed by the University of Science and Technology of China. This works was partially carried out during her Ph.D. Thesis (2000–2004) in Leiden.
© ESO 2018
1. Introduction
Asymptotic giant branch (AGB) stars are rare, but they are among the brightest stars at infrared wavelengths. They lose mass at rates from 10−9M⊙ yr−1 up to 10−4M⊙ yr−1, and are often surrounded by circumstellar envelopes where maser emission from SiO, H2O, and OH may arise. Maser observations provide information on the angular distribution and accurate line-of-sight velocities of AGB stars. A number of maser surveys have been carried out to measure stellar line-of-sight velocities toward the inner Galaxy (e.g., Lindqvist et al. 1992; Blommaert et al. 1994; Sevenster et al. 2001, 1997a, b; Sjouwerman et al. 1998; Izumiura et al. 1999; Deguchi et al. 2000a, b). These surveys were mostly aimed at the detection of OH/IR stars1. About 800 OH/IR stars were detected with the first largescale blind surveys at 1612 MHz by Sevenster et al. (e.g.,1997a, b, 2001). Kinematic modelings of that data allowed for constraints on the Galactic bar’s properties and yielded quantitative parameters of the bar (e.g., Sevenster 1999; Debattista et al. 2002; Habing et al. 2006).
Stars on the AGB also emit SiO maser emission at 43 and 86 GHz and more stars show this maser than that of OH (Habing et al. 2006). SiO-maser surveys have been carried out around the years 2000–2002 with the Nobeyama telescope (Deguchi et al. 2000b). These surveys mainly targeted IRAS point sources and suffered from significant confusion near the Galactic plane. Large infrared surveys of the Galactic plane with less confusion than IRAS were already available at the beginning of the year 2000, when we embarked on a search for 86 GHz SiO masers directed at targets selected from the ISOGAL (Omont et al. 2003; Schuller et al. 2003) and MSX catalogs (Egan et al. 1999, 2003). We detected 255 SiO maser lines in 444 targets in the area |b|< 0.°5 and −4° < l < + 30° (Messineo et al. 2002).The targets were selected to be complementary to the previous OH/IR surveys, in other words, sources with the reddest mid- and near-infrared colors were excluded.
In 2003, an additional dataset of SiO masers at 86 GHz was obtained to extend the survey to longer longitudes (20° < l < 50°). A kinematic analysis of this dataset, together with that of Messineo et al. (2002), is presented in Habing et al. (2006). In this paper we publish the list of these 92 SiO maser detections between 20° < l < 50°. We also discuss the infrared properties of all our 444 previous targets and the 135 new targets as they are found in the new infrared surveys, MSX, 2MASS, DENIS, ISOGAL, WISE, GLIMPSE, AKARI, and MIPSGAL.
In Sect. 2, we present the target selection and radio observations of the 135 new targets, and in Sect. 3 the identifications of counterparts from available large infrared surveys of the 444 + 135 targets in the Galactic plane. In Sect. 4, we briefly describe the detection rate and properties of the newly detected SiO maser lines, and in Sect. 5 we discuss the infrared colors of all 579 targeted stars. Finally, a summary is provided in Sect. 6.
2. 86 GHz SiO masers in the 2003 IRAM campaign
In our previous paper, we color-selected bright ([15]< 3.4 mag) stars in the ISOGAL [15] versus (Ks < SPSDOUBLEDOLLAR > −[15]) diagram, and ISOGAL [15] versus ([7]–[15]) diagram, so as to exclude the reddest sources since those usually do not show SiO but OH maser emission; we defined a similar selection with MSX colors and fluxes. Sources for the 2003 SiO observations were selected from Version 1.2 of the Midcourse Space Experiment point source catalog (MSX-PSC, Egan et al. 1999) by following the color criteria of our previous paper. Flux densities in D-band (14.65 μm) range from 0.56 Jy (3.78 mag) to 2.12 Jy (2.34 mag). A number of 127 targets are observed for the first time; eight targets are reobservations of targets in Messineo et al. (2002). Due to visibility limits from the IRAM 30-m telescope, there is a lower limit to the target longitude of about −4°. We restricted the latitude mostly to the limits −0∘̣5 and 0∘̣5. Locations of the targets are shown in Fig. 1. Evidence of variability is available from DENIS/2MASS near-infrared measurements; the majority of our targets are long-period variables (see Messineo et al. 2004).
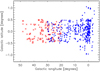 |
Fig. 1. Galactic coordinates of the new targets (red crosses). For comparison the targets in Messineo et al. (2002) (blue dots) are also shown. |
The observations were carried out with the IRAM 30-m telescope on Pico Veleta in Spain between October and November 2003, under the proposal number 021–03 (30 h). Telescope settings and observational strategy were the same as described in Messineo et al. (2002). Two receivers were used to observe the two orthogonal linear polarizations. To each receiver, we attached the low-resolution analog filter bank with a resolution of 3.5 km s−1 and a coverage of 890 km s−1 and in parallel the autocorrelator with a resolution of 1.1 km s−1 and a bandwidth 973 km s−1. The IRAM beam at 86 GHz has a full width at half-maximum (FWHM) of 29″. The observations were made in wobbler switching mode, with the wobbler throw varying between 100″ and 200″. Integration times ranged from 10 to 24 min per source; the average spectral noise is 0.012 K with a σ = 0.003 K. The conversion factor from antenna temperatures to flux densities is 6.2 Jy K−1. Typically, the SiO maser line has a width of a few km s−1; therefore, the line is not resolved in the spectra from the filter bank (one or two channels). We considered, as a detection, only lines simultaneously detected in the spectra from the filter bank and in those from the autocorrelator. Data analysis was carried out with the CLASS program within the GILDAS software. Maser parameters, such as velocities, FWHMs, and integrated area below the line emission (A), were estimated by fitting the detected lines with a Gaussian function.
Table D.1 lists the 92 detections at 86 GHz (86 new detections), while Table 1 lists the 43 non-detected targets (41 observed for the first time). The spectra of the detected targets are shown in Fig. A.1. Since the lists by Messineo et al. (2002) contain 444 targets, Table D.1 begins with the identifier number 445.
Sources not detected at 86 GHz.
3. Infrared counterparts to the targets searched for SiO masers
We searched for available mid-infrared data for the 127 new targets as well as for the 444 targets of Messineo et al. (2002). We used the final MSX release (version 2.3, catalog V/114 in CDS, Egan et al. 2003), the ISOGAL catalog (Schuller et al. 2003; Omont et al. 2003), the GLIMPSE catalog (catalog II/328 in CDS, Churchwell et al. 2009; Benjamin et al. 2003), the AllWISE Data Release (catalog II/328 in CDS, Wright et al. 2010; Cutri et al. 2013), the AKARI/IRC All-Sky Survey point source catalog v.1.0 (Ishihara et al. 2010), and the MIPSGAL 24 μm catalog by Gutermuth & Heyer (2015).
The targets had been selected from MSX catalog Version 1.2, which has an astrometric accuracy of ∼2″ (resolution of 18″̣3, Egan et al. 1999). For comparison, the targets selected from the ISOGAL catalog of Messineo et al. (2002) had a sub arcsecond accuracy (resolution of 1″, Messineo et al. 2004). Since 2MASS sources have been astrometrically cross-correlated with WISE and GLIMPSE targets, we can now check the earlier 2MASS matches to the MSX sources (see Appendix B). The MSX camera had a spatial resolution of 18″̣3, while the beam of the IRAM 30-m telescope had a FWHM of 29″. MSX counterparts were found within 14″̣5 for 566 of the 571 targets. Excluding the upper limits we have 280 targets with good measurements in all four MSX bands. MSX magnitudes are obtained adopting the following zero-points: 58.49 Jy in the A band (8.26 μm), 26.51 Jy in C-band (12.12 μm), 18.29 Jy in D band, (14.65 μm), and 8.80 Jy in E band (21.41 μm) (Egan et al. 1999). WISE has a resolution of 6″, and a final astrometric accuracy better than 0″̣5. It imaged the sky at 3.4 μm (W1-band), 4.6 μm (W2-band), 12 μm (W3-band), and 22 μm (W4-band) with a sensitivity of 0.08, 0.11, 1, and 6 mJy, and typical saturation thresholds at 0.18, 0.36, 0.88, and 12 Jy. 93% of our targets have unique WISE matches within 10″̣0. A few MSX sources were resolved by WISE into several components; two WISE matches were available for 5% of the targets. The closest match was retained, which is also, in all but two cases, the brightest match in the W3 band (see Appendix B). For the Galactic Infrared Midplane Survey Ext- raordinaire (GLIMPSE), the Infrared Array Camera (IRAC) on board of the Spitzer Space Observatory was used to image the plane of the Galaxy at 3.6, 4.5, 5.8, and 8.0 μm with a spatial resolution of 1″̣2, and a sensitivity of 0.2, 0.2, 0.6, and 0.4 mJy and saturation thresholds of 180, 190, 570, and 470 mJy. MSX measurements in the 8 μm (band-A) range from 6.35 to 2.08 mag, with a Gaussian peak at 3.55 mag and a σ = 0.80 mag. We considered only GLIMPSE stars with [8.0]< 6.0 mag as safe identifications. A second iteration with a fainter threshold was not needed. GLIMPSE counterparts were found for 76% of the targets using a search radius of 10″ and selecting the closest. For 63% of the targets, the MSX, WISE, and GLIMPSE selected counterparts are unique within the search radius. For targets selected from the MSX catalog, with the 2MASS magnitudes and positions, we searched for additional IJKs magnitudes from the DENIS catalog (using a search radius of 2″, Epchtein et al. 1994), and IJKs, 7 μm, and 15 μm magnitudes from the combined DENIS-ISOGAL catalog (Omont et al. 2003; Schuller et al. 2003). The 24 μm Spitzer MIPSGAL survey has a spatial resolution of 6″ and a sensitivity from 1.3 mJy to 2 Jy; we found 518 counterparts within a search radius of 10″. Finally, we searched for AKARI/IRC data at 9 μm and 18 μm (Ishihara et al. 2010), and found matches for 473 targets with a search radius of 3″̣5. Mid-infrared associations were verified with GLIMPSE charts and with a visual inspection of the stellar energy distribution (SED). In addition, we inspected UKIDSS images (Lucas et al. 2008), which were available for 536 of the 571 targets. All but eight targets appeared as single saturated stars in K-band and well centered on the 2MASS position. The collected available infrared measurements of the targets are provided in Table D.2 together with the positions from the 2MASS catalog (Skrutskie et al. 2006).
4. SiO maser results
We searched for SiO maser emission at 86 GHz toward our sample of 135 stars and detected 92 SiO maser lines, of which 91 are new detections at 86 GHz. The resulting detection rate is 68% and that compares very well with that in our earlier survey Messineo et al. (66%, 2002).
4.1. Single epoch detection rate and repeated observations
Star #243 (Vlsr = 110.2 km s−1) coincides with the entry #243 in Messineo et al. (2002), and stars #462 (Vlsr = 33.0 km s−1), #505 (Vlsr = 72.1 km s−1), and #511 (Vlsr = 6.9 km s−1) were detected at 43 GHz by Deguchi et al. (2004) and Deguchi et al. (2010); for each star, measured velocities agree within 1 km s−1. Interestingly, stars #416, #418, #432, #435, #440, #441, and #444 were unsuccessfully searched for SiO emission by Messineo et al. (2002). Five out of these seven stars not detected in the first epoch had a detectable flux during the second epoch of 86 GHz observations. This implies that 90% of the targets in Messineo et al. (2002) are probably masing stars. In the second epoch the rms noise was lower by a factor of ≈1.3. Flux densities of SiO maser lines are known to vary in phase with the infrared amplitude of the stellar pulsation (e.g., Alcolea et al. 1999). Since the selected sample is made out of long-period variables (Messineo et al. 2004), this single epoch detection rate provides only a lower limit to the actual number of stars capable of hosting SiO masers.
4.2. FWHM of maser lines and candidate RSGs
The 86 GHz maser emission originates in the envelopes of O-rich (Mira-type) AGB stars, as well as in the envelopes of red supergiants (RSGs). Weaker SiO maser emission is found in semiregular AGB stars (Alcolea et al. 1990). The central star has an extended shell, generated by the strong pulsations where the SiO maser activity takes place. Figure 2 shows the distribution of the FWHMs in comparison to our previous study. Both distributions are compatible with each other, with the FWHM peaking at 4.9 km s−1 with a scatter of σ = 2.7 km s−1, and the mean equivalent width (i.e., fitted area/peak) peaking at 4.7 km s−1 with a scatter of σ = 2.0 km s−1. There is also a tail with broader FWHMs (> 7 km s−1).
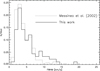 |
Fig. 2. Histogram of the SiO maser line widths. The solid line shows the distribution of the SiO masers presented in this work; the dotted line those previously published by Messineo et al. (2002). The numbers have been scaled to the total number (444) in the previous study and to the number 135 in the present study |
Cooler RSGs with large amplitudes can also be strong SiO emitters, and their SiO maser luminosity is comparable to that of AGB stars (Alcolea et al. 1990). SiO masers associated with RSGs have larger widths (e.g., Verheyen et al. 2012; Le Bertre & Nyman 1990; Alcolea et al. 1990). Alcolea et al. (1999) performed a six-year period monitoring of SiO maser lines and concluded that SiO maser emission contains several 1–2 km s−1 peaks over a range of 10 km s−1 in LPV-giants or 20–40 km s−1 in supergiants. With this statistical argument it should be possible to identify candidate RSGs. However, in many cases lines were detected at the 2.5–3 σ level and it is likely that most of the broad lines are the results of low signal-to-noise observations. The quoted errors in Table D.1 are the errors of the analytic fit with a Gaussian function. As expected, the broader lines are predominantly detected at lower antenna temperatures. By comparing the new sample with the old (Messineo et al. 2002), there is an excess of broader lines between 10° and 50° of longitudes. 14% of masers located at longitudes > 20° has broader lines, but only 5% with longitudes < 20°. Between longitudes 25° and 35°, at the near-end side of the bar, there is a concentration of massive starburst clusters and those are rich in RSG stars (e.g., and references therein Messineo et al. 2016). A small excess contamination of RSGs is therefore expected at these longitudes (see Appendix C). The nature of objects with apparently broader lines is discussed in Appendix B.
5. Infrared color diagnostics
Because of their low latitudes and low fluxes, the targets have upper limits at 60 μm and the classical IRAS color-color diagram cannot be used to characterise their envelopes (Sect. 6 of Messineo et al. 2004). Sevenster (2002) derived useful diagnostics for OH/IR stars by analysing the MSX colors [A]–[C] and [D]–[E]. In the plane defined D–E versus A–C (Fig. 3 of Sevenster 2002), objects of different evolutionary status reside in different areas in the diagram. OH/IR stars reside in the area A–C < 1.8 mag and D–E < 1.5 mag (Quadrant III); planetary nebulae (PNe) and post-AGB stars (objects in transition to PNe) populate the area D–E > 1.5 mag (Quadrants I and II). Our old and new targets are plotted in Fig. 3 in such a diagram, together with known post-AGB stars and PNe from Ortiz et al. (2005). As expected, almost all of our objects are located in Quadrant III, which is the classical region of AGB stars. Only two targets are located in Quadrant II and could have left the AGB already: the SiO emitter #53 and the non-detection #331.
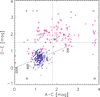 |
Fig. 3. Diagram of targeted stars in the MSX A–C versus D–E colors. Upper limits and blends have been removed. Targets are marked with blue filled circles (detections) and empty circles (non-detections). As illustration we plot also the positions of astrophysically related objects. Triangles indicate the location of the PNe and diamond symbols that of post-AGB (transitional) objects provided by Ortiz et al. (2005). The long-dashed line marks the locus of a blackbody (Fν) with a temperature from 2200 K to 200 K. |
We carefully inspected the quality of measurements and visually inspected the mid-infrared images of these candidate post-AGBs (see Fig. 4). Despite the good flags in the MSX bands both appear located in the halo of a nearby bright 20 μm source, indicating a questionable photometric measurement. We conclude therefore that a contamination of our sample with post-AGB stars and PNe is negligible.
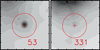 |
Fig. 4. MIPSGAL 24 μm 1′ × 1′ maps of the two targets located in Quadrant II of Fig. 3. Images have been bytescaled with a minimum at zero and a maximum at 500 MJy/sr (#53) or 1900 MJy/sr (#331). North is up and east to the left. The IRAM pointing positions are marked with circles of radius 14″̣5. The final retained 2MASS positions are marked with crosses. |
Color-color diagrams can be used also to search for different chemistry in our sample. Ortiz et al. (2005) showed that carbon stars can be identified in a 2MASS-MSX A–D versus Ks–A diagram. In Fig. 5, we show such a diagram with our targets from Table D.2 together with carbon stars, post-AGB stars, and PNe from Ortiz et al. (2005). There are ten candidate C-rich stars in our sample, #223, #403, #407, #424, #436, #439, #443, #520, #556, and #568, which fall below the separation line dividing O-rich and C-rich stars in Fig. 5. Two stars, #223 and #520, are masing at 86 GHz indicating an O-rich chemistry. Indeed, #520 is also observed by AKARI and has a [9]–[18] color typical of O-rich stars (Ishihara et al. 2011). We conclude that the non-simultaneity of the near-infrared and mid-infrared measurements yields some spurious C-rich stars.
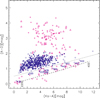 |
Fig. 5. 2MASS-MSX Ks– A versus A–D diagram of targets. SiO maser detections are marked with blue filled circles and non-detections with blue empty circles. Upper limits and blends have been removed. Identification numbers are as in Table D.2. The dotted line marks the separation between O-rich and C-rich shells found by Ortiz et al. (2005). The long-dashed line represents a blackbody (Fν) with temperature from 2200 to 400 K. New candidate C-type stars from our survey (see text) are labeled. For comparison Ks–A versus A–D values of the carbon stars analyzed by Ortiz et al. (2005) are overplotted with+++ magenta crosses, transitional objects with diamonds, and PNe with triangles. |
6. Summary
We have reported on 92 SiO maser detections at 86 GHz, which were made with the IRAM 30-m single dish in 2003. This dataset along with the 271 detections by Messineo et al. (2002) was used as probe of the Galactic barred potential in the work by Habing et al. (2006). The 2003 detections are located between 20° and 50° of longitude, and yield a detection rate of 68%, similar to that reported by Messineo et al. (2002). Since no archival copy exists of this dataset, here, we make them available.
We performed identifications of the 135 targets presented in this work and of the 444 of Messineo et al. (2002) in the MSX, WISE, MIPSGAL, GLIMPSE, 2MASS, DENIS, ISOGAL and AKARI catalogs. The sample is made of Mira-like stars, and a fraction of 74% of stars shows photometric variability in at least one of the band.
We used the collected measurements to confirm their O-rich nature, as initially designed. For example, we analyze the A–D versus Ks–A diagram to separate O- and C-rich stars, and found 1.7% of them could be C-rich stars. The D–E versus A–C plane allows us to separate normal AGB stars from post-AGB stars and PNe. Only one masing star, #53, is marginally deviating from the locus of normal AGB stars in this diagram.
AGB stars with OH maser emission in the 1612 MHz line, mostly undetected at visual wavelengths, but bright in the IR.
Acknowledgments
IRAM is supported by INSU/CNRS (France), MPG (Germany) and IGN (Spain). ISOGAL is based on observations with ISO, an ESA project with instruments funded by ESA Member States (especially the PI countries: France, Germany, the Netherlands and the United Kingdom) and with the participation of ISAS and NASA. DENIS is a joint effort of several Institutes mostly located in Europe. It has been supported mainly by the French Institut National des Sciences de l’Univers, CNRS, and French Education Ministry, the European Southern Observatory, the State of Baden-Wuerttemberg, and the European Commission under networks of the SCIENCE and Human Capital and Mobility programs, the Landessternwarte, Heidelberg and Institut d’Astrophysique de Paris. This publication makes use of data products from the Two Micron All Sky Survey, which is a joint project of the University of Massachusetts and the Infrared Processing and Analysis Center/California Institute of Technology, funded by the National Aeronautics and Space Administration and the National Science Foundation. This work is based on observations made with the Spitzer Space Telescope, which is operated by the Jet Propulsion Laboratory, California Institute of Technology under a contract with NASA. This research made use of data products from the Midcourse Space Experiment, the processing of which was funded by the Ballistic Missile Defence Organization with additional support from the NASA Office of Space Science. This publication makes use of data products from WISE, which is a joint project of the University of California, Los Angeles, and the Jet Propulsion Laboratory/California Insti- tute of Technology, funded by the National Aeronautics and Space Administration. This work is based in part on data obtained as part of the UKIRT Infrared Deep Sky Survey. This research has made use of the SIMBAD data base, operated at CDS, Strasbourg, France. This research made use of Montage, funded by the National Aeronautics and Space Administration’s Earth Science Technology Office, Computational Technnologies Project, under Cooperative Agreement Number NCC5-626 between NASA and the California Institute of Technology. The code is maintained by the NASA/IPAC Infrared Science Archive. AKARI is a JAXA project with the participation of the European Space Agency (ESA). The work of MM from 2000 to 2004 was funded by the Netherlands Research School for Astronomy (NOVA) through a network 2 Ph.D. stipend. We thank Dr. Sevenster M. N. for stimulating discussion on Galaxy morphology and masing stars; she was a visiting fellow of the Leiden Observatory from 2002 to 2004. This work was partially supported by the Fundamental Research Funds for the Central Universities in China, and USTC grant KY2030000054. The National Radio Astronomy Observatory is a facility of the National Science Foundation operated under cooperative agreement by Associated Universities, Inc. We thank the referees of this paper.
References
- Alcolea, J., Bujarrabal, V.,& Gomez-Gonzalez, J.1990, A&A, 231, 431 [NASA ADS] [Google Scholar]
- Alcolea, J., Pardo, J. R., Bujarrabal, V., et al. 1999, A&AS, 139, 461 [NASA ADS] [CrossRef] [EDP Sciences] [Google Scholar]
- Benjamin, R. A., Churchwell, E., Babler, B. L., et al. 2003, PASP, 115, 953 [NASA ADS] [CrossRef] [Google Scholar]
- Blommaert, J. A. D. L., van Langevelde, H. J.,& Michiels, W. F. P.1994, A&A, 287, 479 [NASA ADS] [Google Scholar]
- Cabrera-Lavers, A., Garzón, F., Hammersley, P. L., Vicente, B.,& González-Fernández, C.2006, A&A, 453, 371 [NASA ADS] [CrossRef] [EDP Sciences] [Google Scholar]
- Churchwell, E., Babler, B. L., Meade, M. R., et al. 2009, PASP, 121, 213 [NASA ADS] [CrossRef] [Google Scholar]
- Clark, J. S., Negueruela, I., Davies, B., et al. 2009, A&A, 498, 109 [NASA ADS] [CrossRef] [EDP Sciences] [Google Scholar]
- Cutri, R.M.,& et al. 2013, VizieR Online Data Catalog: II/328. [Google Scholar]
- Debattista, V. P., Gerhard, O.,& Sevenster, M. N.2002, MNRAS, 334, 355 [NASA ADS] [CrossRef] [Google Scholar]
- Deguchi, S., Fujii, T., Izumiura, H., et al. 2000a, ApJS, 128, 571 [NASA ADS] [CrossRef] [Google Scholar]
- Deguchi, S., Fujii, T., Izumiura, H., et al. 2000b, ApJS, 130, 351 [NASA ADS] [CrossRef] [Google Scholar]
- Deguchi, S., Fujii, T., Glass, I. S., et al. 2004, PASJ, 56, 765 [NASA ADS] [Google Scholar]
- Deguchi, S., Nakashima, J.I., Zhang, Y., et al. 2010, PASJ, 62, 391 [NASA ADS] [CrossRef] [Google Scholar]
- Egan, M.P., Price, S.D., Moshir, M., et al. 1999, Air Force Research Lab., Technical Rep. [Google Scholar]
- Egan, M.P., Price, S.D., Kraemer, K.E., et al. 2003, VizieR Online Data Catalog: V/114. [Google Scholar]
- Epchtein, N., de Batz, B., Copet, E., et al. 1994, Ap&SS, 217, 3 [NASA ADS] [CrossRef] [Google Scholar]
- Felli, M., Testi, L., Schuller, F.,& Omont, A.2002, A&A, 392, 971 [NASA ADS] [CrossRef] [EDP Sciences] [Google Scholar]
- Gutermuth, R. A.,& Heyer, M.2015, AJ, 149, 64 [NASA ADS] [CrossRef] [Google Scholar]
- Habing, H. J., Sevenster, M. N., Messineo, M., van de Ven, G.,& Kuijken, K.2006, A&A, 458, 151 [NASA ADS] [CrossRef] [EDP Sciences] [Google Scholar]
- Halpern, J. P.,& Gotthelf, E. V.2007, ApJ, 669, 579 [NASA ADS] [CrossRef] [Google Scholar]
- Iben, I.,& Renzini, A.1983, ARA&A, 21, 271 [NASA ADS] [CrossRef] [Google Scholar]
- Ishihara, D., Onaka, T., Kataza, H., et al. 2010, A&A, 514, A1 [NASA ADS] [CrossRef] [EDP Sciences] [Google Scholar]
- Ishihara, D., Kaneda, H., Onaka, T., et al. 2011, A&A, 534, A79 [NASA ADS] [CrossRef] [EDP Sciences] [Google Scholar]
- Izumiura, H., Deguchi, S., Fujii, T., et al. 1999, ApJS, 125, 257 [NASA ADS] [CrossRef] [Google Scholar]
- Jura, M.,& Kleinmann, S. G.1990, ApJS, 73, 769 [NASA ADS] [CrossRef] [Google Scholar]
- Kwok, S., Volk, K.,& Bidelman, W. P.1997, ApJS, 112, 557 [NASA ADS] [CrossRef] [MathSciNet] [Google Scholar]
- Le Bertre, T.,& Nyman, L.-A.1990, A&A, 233, 477 [NASA ADS] [Google Scholar]
- Lindqvist, M., Winnberg, A., Habing, H. J.,& Matthews, H. E.1992, A&AS, 92, 43 [NASA ADS] [Google Scholar]
- López-Corredoira, M., Garzón, F., Beckman, J. E., et al. 1999, AJ, 118, 381 [NASA ADS] [CrossRef] [Google Scholar]
- Lucas, P. W., Hoare, M. G., Longmore, A., et al. 2008, MNRAS, 391, 136 [NASA ADS] [CrossRef] [Google Scholar]
- Messineo, M., Habing, H. J., Sjouwerman, L. O., Omont, A.,& Menten, K. M.2002, A&A, 393, 115 [NASA ADS] [CrossRef] [EDP Sciences] [Google Scholar]
- Messineo, M., Habing, H. J., Menten, K. M., Omont, A.,& Sjouwerman, L. O.2004, A&A, 418, 103 [NASA ADS] [CrossRef] [EDP Sciences] [Google Scholar]
- Messineo, M., Habing, H. J., Menten, K. M., et al. 2005, A&A, 435, 575 [NASA ADS] [CrossRef] [EDP Sciences] [Google Scholar]
- Messineo, M., Zhu, Q., Menten, K. M., et al. 2016, ApJ, 822, L5 [NASA ADS] [CrossRef] [Google Scholar]
- Messineo, M., Zhu, Q., Menten, K. M., et al. 2017, ApJ, 836, 65 [NASA ADS] [CrossRef] [Google Scholar]
- Nagata, T., Hyland, A. R., Straw, S. M., Sato, S.,& Kawara, K.1993, ApJ, 406, 501 [NASA ADS] [CrossRef] [Google Scholar]
- Negueruela, I., González-Fernández, C., Marco, A., Clark, J. S.,& Martínez-Núñez, S.2010, A&A, 513, A74 [NASA ADS] [CrossRef] [EDP Sciences] [Google Scholar]
- Negueruela, I., González-Fernández, C., Marco, A.,& Clark, J. S.2011, A&A, 528, A59 [Google Scholar]
- Omont, A., Gilmore, G. F., Alard, C., et al. 2003, A&A, 403, 975 [NASA ADS] [CrossRef] [EDP Sciences] [Google Scholar]
- Ortiz, R., Lorenz-Martins, S., Maciel, W. J.,& Rangel, E. M.2005, A&A, 431, 565 [NASA ADS] [CrossRef] [EDP Sciences] [Google Scholar]
- Reid, M. J., Menten, K. M., Zheng, X. W., et al. 2009, ApJ, 700, 137 [NASA ADS] [CrossRef] [Google Scholar]
- Schuller, F., Ganesh, S., Messineo, M., et al. 2003, A&A, 403, 955 [NASA ADS] [CrossRef] [EDP Sciences] [Google Scholar]
- Sevenster, M. N.1999, MNRAS, 310, 629 [NASA ADS] [CrossRef] [Google Scholar]
- Sevenster, M. N.2002, AJ, 123, 2772 [NASA ADS] [CrossRef] [Google Scholar]
- Sevenster, M.N., Chapman, J.M., Habing, H.J., Killeen, N.E.B.,& Lindqvist, M.1997a, A&AS, 122, [Google Scholar]
- Sevenster, M. N., Chapman, J. M., Habing, H. J., Killeen, N. E. B.,& Lindqvist, M.1997b, A&AS , 124 [Google Scholar]
- Sevenster, M. N., van Langevelde, H. J., Moody, R. A., et al. 2001, A&A, 366, 481 [NASA ADS] [CrossRef] [EDP Sciences] [Google Scholar]
- Sjouwerman, L. O., van Langevelde, H. J., Winnberg, A.,& Habing, H. J.1998, A&AS, 128, 35 [NASA ADS] [CrossRef] [EDP Sciences] [Google Scholar]
- Skrutskie, M. F., Cutri, R. M., Stiening, R., et al. 2006, AJ, 131, 1163 [NASA ADS] [CrossRef] [Google Scholar]
- Verheyen, L., Messineo, M.,& Menten, K. M.2012, A&A, 541, A36 [NASA ADS] [CrossRef] [EDP Sciences] [Google Scholar]
- Wright, E. L., Eisenhardt, P. R. M., Mainzer, A. K., et al. 2010, AJ, 140, 1868 [NASA ADS] [CrossRef] [Google Scholar]
- Yamamura, I., Makiuti, S., Ikeda, N.. et al. 2010, VizieR Online Data Catalog: II/298, [Google Scholar]
Appendix A Spectra
The spectra of targets with detected SiO maser are shown in Fig. A.1.
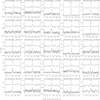 |
Fig. A.1. IRAM spectra of 86 GHz SiO maser lines. Each panel shows at the bottom the spectrum obtained with the autocorrelator (1.1 km s−1), and at the top that obtained with the filter bank (3.5 km s−1, offset from zero). The line-of-sight velocity listed in Table D.1 is indicated with a small vertical bar at the top of each panel. The conversion factor between antenna temperatures and flux densities is 6.2 Jy K−1. |
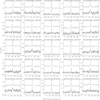 |
Fig. A.1. continued. |
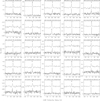 |
Fig. A.1. continued. |
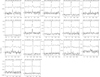 |
Fig. A.1. continued. |
Appendix B Notes to the infrared catalogs
2MASS matches were provided by the two catalogs WISE and GLIMPSE. We generally adopted the AllWISE Data Release, which has an improved astrometry, but, the number of targets was in only the earlier WISE All-Sky Data Release. When 2MASS matches were missed by GLIMPSE (mostly due to saturation effects), we inspected the images (GLIMPSE, WISE, and 2MASS) and retained the WISE matches. We inspected the images and retained the GLIMPSE values when 2MASS matches had been missed by WISE (mostly due to saturation effects and crowding). We retained the 2MASS matches provided by GLIMPSE for targets #58, #78, #320, #342, and #493. One near-infrared star (#39) is resolved by UKIDSS into two similarly bright stars. UKIDSS data were used to revise the positions and magnitudes of #58, #320, and #413 because they were blended or missed in 2MASS. We assigned UKIDSS magnitudes for four entries without 2MASS data (#224, #298, #423, and #536).
In Messineo et al. (2004) 2MASS, ISOGAL, and MSX (v1.2) counterparts have already been provided for the 444 stars in Messineo et al. (2002). The MSX magnitudes tabulated in this paper differ from those in Messineo et al. (2004) because there we used an earlier version of the MSX catalog. We compared the Ks measurements listed by Messineo et al. (2004) with those in Table D.2 and found only five 2MASS mismatches (targets #77, #90, #227, #347, and #424) and the updated seven Ks values with measurements from the UKIDSS catalog. Masers #77 and #78 were detected in the same beam. The maser with the stronger flux was associated with the pointed star ISOGAL−J174618.9-284439. The fainter maser #77 had been included in Messineo et al. (2004) and had been associated with the only star detected at #7 μm by ISOGAL about 12″̣5 away. The GLIMPSE catalog allows us to revise this association with the closer GLIMPSE star G000.2444−00.0294 (5″̣2 away, [8.0] = 4.93 mag and Ks = 7.78 mag). Stars #21 and #22 are double detections within the same pointing, identified with two ISOGAL point sources. The two masers #64 and #65 were both detected when pointing toward the mid-infrared source ISOGAL−J174528.8-284734. Possible fainter stars (≈8 mag) falling in the IRAM beam are detected in the 8 μm GLIMPSE images; however, they are below [8.0] = 8.0 mag, while the average brightness of our SiO masing stars is [8.0] = 4.2 mag with a σ = 0.6 mag.
The WISE counterparts were searched within 10″, and the closest was retained. We found 28 cases of multiple stars within the search radius. The closest match was the brightest in the W3 band in all cases but #110 and #405. The reddest Ks < SPSDOUBLEDOLLAR > −W3 match was not the closest in the cases of stars #21 (9.4″ away), #35 (6.7″ away), #43 (9.7″ away), #110 (8.0″ away), #173 (6″̣6 away) #207 (7″̣8 away), #228 (6″̣1 away), #289 (9″̣5 away), #324 (4″̣4 away), #354 (4″̣7 away), #405 (9″̣1 away), #479 (9″̣8 away), #482 (9″̣8 away), #502 (9″̣6 away), #545 (8″̣3 away), and #548 (8″̣7 away). We searched for AKARI/FIS data at 65, 90, and 140 μm (Yamamura et al. 2010), but, unfortunately, matches were available only for three targets (#251, #451, and #537).
Appendix C Contamination RSGs
To asses the nature of a few suspect broad and multipeaked maser lines, which are reported in Sect. 4.2, we estimated luminosities and distances. Extinction corrections are as in Messineo et al. (2005). Bolometric magnitudes were computed by integrating the dereddened flux densities, Fν(ν) over frequency ν with linear interpolations and by extrapolating to Fν = 0 = 0 and at the upper end with a blackbody curve. The low-frequency extrapolation is insignificant since it contains a negligible fraction of the total flux (3% in average). When both DENIS and 2MASS datasets were available, we averaged the two estimates to attenuate the effect of variability; the average difference being 0.036 mag with σ= 0.31 mag.
In Table C.1, we list Mbol values of the brighest stars. The list is useful because it contains probable RSG stars, but infrared spectroscopy is needed to firmly unveil the nature of those bright stars. The Table collects the brighest stars from five computations with different assumptions on distances.
-
Group 1: Previously known RSGs included in the sample.
-
Group 2: Stars located in the central 5° of longitude which are brighter than the AGB limit, Mbol < −7.2 mag, when a distance modulus of 14.5 mag is assumed.
-
Group 3: Brighest stars with longitude > 20° for which kinematic near distances are used.
-
Group 4: Brighest stars with longitude < 20° and classified as foreground to the bar and bulge in Messineo et al. (2005). For these stars, kinematic distances are assumed.
-
Group 5: List of all remaining targets with FWHM > 9 km s−1.
-
Group 1: The sample contains two spectroscopically identified RSGs, #436 and #444 (Jura & Kleinmann 1990; Messineo et al. 2017), and two photometrically identified RSGs, #483 and #535 (Clark et al. 2009; Negueruela et al. 2010). Only star #483 (l = 29°) is a maser detection; it has a velocity Vlsr = 66.89 km s−1, and Mbol = −5.63 mag.
-
Group 2: For the 251 targets located within the inner 5° in longitude, we initially assume a distance of 8.0 kpc. The bulk of targets have Mbol from −4.5 to −6.0 mag as expected for thermally pulsing AGB stars. A bright tail in the luminosity distribution suggests that a few RSGs are included in the sample. A number of 17 stars (7% of targets within 5°) are brighter than Mbol = −7.2 mag, which is the classical AGB limit (Iben & Renzini 1983). Ten of them are likely to be foreground stars, because their total extinction is lower than the average interstellar extinction of surrounding stars (Messineo et al. 2005). The remaining seven bright sources (#31, #75, #92, #116, #128, #294, and #310) with average Mbol < −7.2 mag have total extinction very close to that measured from surrounding stars, therefore, Mbol does not depend on the choice of AKs. For stars, #31, #92, #128, and #294, infrared spectra are analyzed in the work by Messineo et al. (2017). Stars #31 (Mbol(2MASS) = −7.47 and Mbol(DENIS) = −7.17 mag) and #128 ( Mbol (2MASS) = −7.94 and Mbol(DENIS) = −6.49 mag) have some water absorption which suggests AGB stars. Stars #92 and #294 have a low water content and broad CO bands that are typical of RSGs. Their Mbol(2MASS) are −8.22 and −7.76 mag. Star #92 (Vlsr = 119 km s−1) is already classified as a RSG by Nagata et al. (1993) and Messineo et al. (2017).
-
Group 3: Using kinematic distances (Reid et al. 2009), their Mbol values do not exceed the AGB limit. We note that in Group 2 most of the stars have Mbol from −4.5 to −6.0 mag. We are able to locate eight bright stars at l > 20° with Mbol < − 6.0 mag (i.e., 7% of detections at l > 20°).
-
Group 4: Stars defined as foreground by Messineo et al. (2005) may include some RSGs. Their AKs values is smaller than that of the average of surrounding stars. Indeed, Mbol estimated for stars #15 and #129 approach the AGB limit.
-
Group 5: Most of the remaining stars with FWHMs > 9 km s−1 have Mbol values larger than −5.5 mag. We estimate that the RSG contamination is ≲7% (Table C.1). With our signal-to-noise it is not possible to use the FWHM of maser lines to establish luminosity classes; however, candidate RSGs have in average broader lines. For example, at l > 20° 15% of the detections have broad FWHMs (> 9 km s−1), but only 7% of the detections are candidate RSGs (25% of which have FWHMs > 9 km s−1).
Luminosities of bright targets and of targets with broad maser lines.
Appendix D Additional tables
Sources with detected 86 GHz SiO maser emission.
continued.
Infrared measurements of the targeted stars.
All Tables
All Figures
|
Fig. 1. Galactic coordinates of the new targets (red crosses). For comparison the targets in Messineo et al. (2002) (blue dots) are also shown. |
| In the text | |
|
Fig. 2. Histogram of the SiO maser line widths. The solid line shows the distribution of the SiO masers presented in this work; the dotted line those previously published by Messineo et al. (2002). The numbers have been scaled to the total number (444) in the previous study and to the number 135 in the present study |
| In the text | |
|
Fig. 3. Diagram of targeted stars in the MSX A–C versus D–E colors. Upper limits and blends have been removed. Targets are marked with blue filled circles (detections) and empty circles (non-detections). As illustration we plot also the positions of astrophysically related objects. Triangles indicate the location of the PNe and diamond symbols that of post-AGB (transitional) objects provided by Ortiz et al. (2005). The long-dashed line marks the locus of a blackbody (Fν) with a temperature from 2200 K to 200 K. |
| In the text | |
|
Fig. 4. MIPSGAL 24 μm 1′ × 1′ maps of the two targets located in Quadrant II of Fig. 3. Images have been bytescaled with a minimum at zero and a maximum at 500 MJy/sr (#53) or 1900 MJy/sr (#331). North is up and east to the left. The IRAM pointing positions are marked with circles of radius 14″̣5. The final retained 2MASS positions are marked with crosses. |
| In the text | |
|
Fig. 5. 2MASS-MSX Ks– A versus A–D diagram of targets. SiO maser detections are marked with blue filled circles and non-detections with blue empty circles. Upper limits and blends have been removed. Identification numbers are as in Table D.2. The dotted line marks the separation between O-rich and C-rich shells found by Ortiz et al. (2005). The long-dashed line represents a blackbody (Fν) with temperature from 2200 to 400 K. New candidate C-type stars from our survey (see text) are labeled. For comparison Ks–A versus A–D values of the carbon stars analyzed by Ortiz et al. (2005) are overplotted with+++ magenta crosses, transitional objects with diamonds, and PNe with triangles. |
| In the text | |
|
Fig. A.1. IRAM spectra of 86 GHz SiO maser lines. Each panel shows at the bottom the spectrum obtained with the autocorrelator (1.1 km s−1), and at the top that obtained with the filter bank (3.5 km s−1, offset from zero). The line-of-sight velocity listed in Table D.1 is indicated with a small vertical bar at the top of each panel. The conversion factor between antenna temperatures and flux densities is 6.2 Jy K−1. |
| In the text | |
|
Fig. A.1. continued. |
| In the text | |
|
Fig. A.1. continued. |
| In the text | |
|
Fig. A.1. continued. |
| In the text | |
Current usage metrics show cumulative count of Article Views (full-text article views including HTML views, PDF and ePub downloads, according to the available data) and Abstracts Views on Vision4Press platform.
Data correspond to usage on the plateform after 2015. The current usage metrics is available 48-96 hours after online publication and is updated daily on week days.
Initial download of the metrics may take a while.