Free Access
Fig. 2.
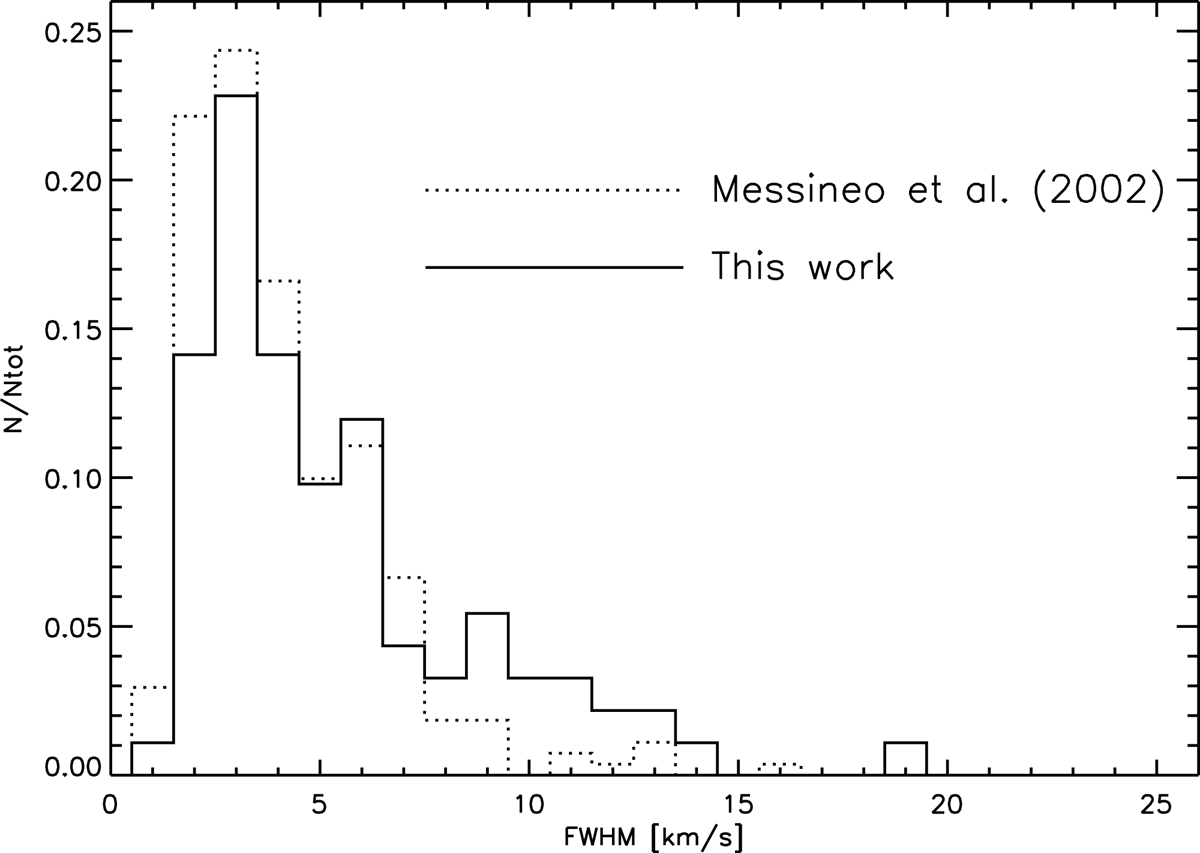
Histogram of the SiO maser line widths. The solid line shows the distribution of the SiO masers presented in this work; the dotted line those previously published by Messineo et al. (2002). The numbers have been scaled to the total number (444) in the previous study and to the number 135 in the present study
Current usage metrics show cumulative count of Article Views (full-text article views including HTML views, PDF and ePub downloads, according to the available data) and Abstracts Views on Vision4Press platform.
Data correspond to usage on the plateform after 2015. The current usage metrics is available 48-96 hours after online publication and is updated daily on week days.
Initial download of the metrics may take a while.