Fig. 4.
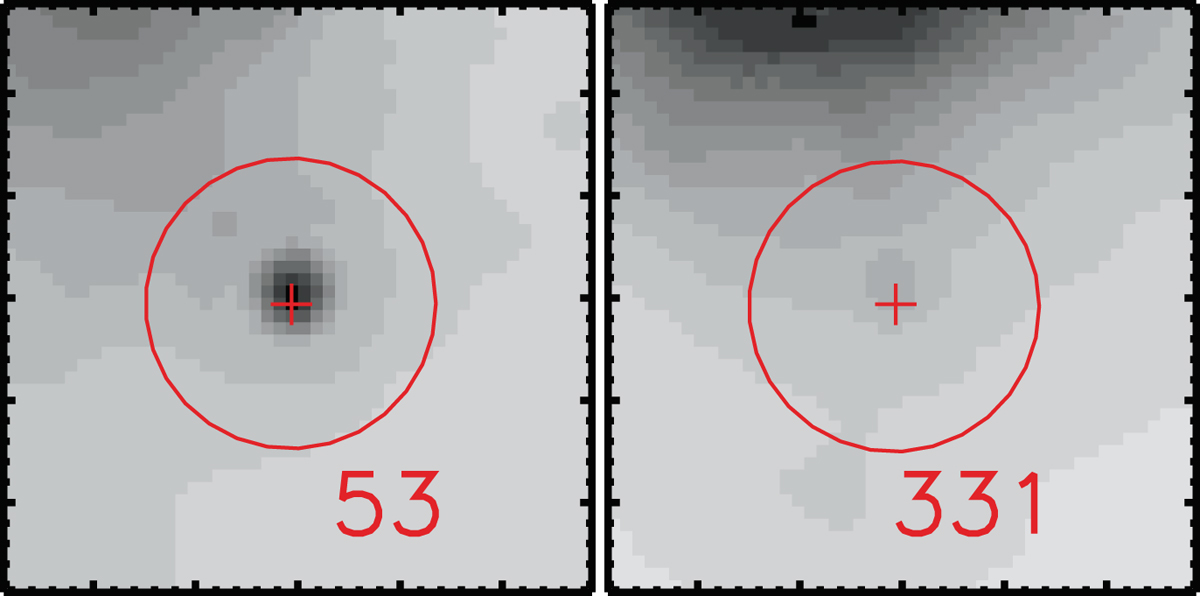
MIPSGAL 24 μm 1′ × 1′ maps of the two targets located in Quadrant II of Fig. 3. Images have been bytescaled with a minimum at zero and a maximum at 500 MJy/sr (#53) or 1900 MJy/sr (#331). North is up and east to the left. The IRAM pointing positions are marked with circles of radius 14″̣5. The final retained 2MASS positions are marked with crosses.
Current usage metrics show cumulative count of Article Views (full-text article views including HTML views, PDF and ePub downloads, according to the available data) and Abstracts Views on Vision4Press platform.
Data correspond to usage on the plateform after 2015. The current usage metrics is available 48-96 hours after online publication and is updated daily on week days.
Initial download of the metrics may take a while.