| Issue |
A&A
Volume 618, October 2018
|
|
|---|---|---|
| Article Number | A128 | |
| Number of page(s) | 16 | |
| Section | Extragalactic astronomy | |
| DOI | https://doi.org/10.1051/0004-6361/201833052 | |
| Published online | 19 October 2018 | |
Spectroscopic characterization of the protocluster of galaxies around 7C 1756+6520 at z ~ 1.4⋆
1
INAF – Osservatorio Astrofisico di Arcetri, Largo E. Fermi 5, 50125 Firenze, Italy
e-mail: casasola@arcetri.astro.it
2
LERMA, Observatoire de Paris, CNRS, PSL Univ., Sorbonne Univ. and Collège de France, Paris, France
3
European Southern Observatory, Alonso de Córdova 3107, Casilla 19, Santiago 19001, Chile
4
Instituto de Radioastronomía y Astrofísica, UNAM, Campus Morelia, AP 3-72, 58089, Mexico
5
Dipartimento di Fisica e Astronomia, Università di Padova, vicolo dell’ Osservatorio 3, 35122 Padova, Italy
6
INAF – Astronomical Observatory of Padova, vicolo dell’Osservatorio 5, 35122 Padova, Italy
7
INAF – Istituto di Radioastronomia, Via Piero Gobetti 101, 40129 Bologna, Italy
Received:
19
March
2018
Accepted:
23
June
2018
Aims. The aim of this paper is the spectroscopic study of 13 galaxies belonging to the field of the protocluster associated with the radio galaxy 7C 1756+6520 at z = 1.4156. In particular, we focus on the characterization of the nuclear activity.
Methods. This analysis has been performed on rest-frame optical spectra taken with the Large Binocular Telescope, using the spectrograph LUCI, which is operative in the near-infrared domain. The adopted spectral coverage allowed us to observe emission lines such as Hα, Hβ, [O III]λ 5007 Å, and [N II]λ 6583 Å at the redshift of the central radio galaxy. We observed the central part of the protocluster, which is suitable to include the radio galaxy, several spectroscopically confirmed active galactic nuclei (AGN) belonging to the protocluster, and other objects that might be members of the protocluster.
Results. For four previously identified protocluster members, we derived the redshift by detecting emission lines that have never detected before for these galaxies. We identified a new protocluster member and eight new possible protocluster members. The stacked spectrum of the galaxies in which we detected the [O III]λ 5007 Å emission line revealed the second line of the [O III] doublet at 4959 Å and the Hβ line, which confirms that they belong to the protocluster. By collecting all members identified so far in this work and other members from the literature, we defined 31 galaxies, including the central radio galaxy, around the redshift 1.4152 ± 0.056. This corresponds to peculiar velocities ≲5000 km s−1 with respect to the radio galaxy. The position versus velocity phase-space diagram suggests that three AGN of the protocluster and the central radio galaxy might be a virialized population that has been coexisting for a long time in the densest core region of this forming structure. This protocluster is characterized by a high fraction of AGN (~23%). For one of them, AGN1317, we produced two so-called Baldwin, Phillips & Terlevich (BPT) diagrams. The high fraction of AGN and their distribution within the protocluster seem to be consistent with predictions of some theoretical models on AGN growth and feedback. These models are based on galaxy interactions and ram pressure as triggers of AGN activity.
Conclusions. The high fraction of AGN belonging to the protocluster suggests that they were likely triggered at the same time, maybe by the ongoing formation of the protocluster. Observations of AGN in this protocluster and in other distant clusters will help clarifying whether the resulting high fraction of AGN is unusual or typical for such structures at high redshift. Our next step will be analyses of previously acquired high-resolution radio data of the central radio galaxy to derive information on the nature of the radio galaxy and connect it with its cosmic evolution.
Key words: galaxies: clusters: individual: 7C 1756+6520 / galaxies: evolution / galaxies: formation
Based on data acquired using the Large Binocular Telescope (LBT). The LBT is an international collaboration among institutions in the United States, Italy and Germany. LBT Corporation partners are: The University of Arizona on behalf of the Arizona university system; Istituto Nazionale di Astrofisica, Italy; LBT Beteiligungsgesellschaft, Germany, representing the Max-Planck Society, the Astrophysical Institute Potsdam, and Heidelberg University; The Ohio State University, and The Research Corporation, on behalf of The University of Notre Dame, University of Minnesota and University of Virginia.
© ESO 2018
1. Introduction
Galaxy clusters provide an efficient tool for deriving cosmological parameters and for studying galaxy formation and evolution. As the largest collapsed structures in the Universe with total masses of up to 1015M⊙ (e.g., Arnaud 2009), the cosmic history of galaxy clusters is sensitive to key cosmological parameters (e.g., Voit 2005; Vikhlinin et al. 2009; Stern et al. 2010). Galaxy clusters allow us to study large populations of early-type galaxies, which provide stringent tests on galaxy evolution models in the current hierarchical formation paradigm (Renzini 2006), because they are the most massive galaxies with the oldest stellar populations (at least out to redshift z ~ 2).
Over the past three decades, considerable effort has been devoted to discovering ever more distant galaxy clusters using different observational methods (see Rosati et al. 2002, for a review). X-ray selection of galaxy clusters has been central in several studies, as it naturally provides gravitationally bound systems with a relatively simple selection function. However, only few clusters are currently confirmed at z > 1. Examples of distant, confirmed galaxy clusters identified through the extended X-ray emission of the intracluster medium are XMMU J2235.3-2557 at z = 1.39 (Mullis et al. 2005; Lidman et al. 2008; Rosati et al. 2009), XMMXCS J2215.9-1738 at z = 1.46 (Stanford et al. 2006; Hilton et al. 2007), 2XMM J083026.2+524133 at z = 0.99 (Lamer et al. 2008), XDCP J0044.0-2033 at z = 1.58 (Fassbender et al. 2014), and XMMU J2235-2557 at z = 1.39 (Chan et al. 2016). However, the X-ray identification of candidate clusters is very difficult at z > 1 since the surface brightness of the extended X-ray emission fades as (1 + z)4.
Another method for finding galaxy clusters relies upon the observation that all rich clusters, at all redshifts observed so far, appear to have a red sequence of early-type galaxies (Gladders & Yee 2000). The colors of such galaxies are quite distinct as a result of the strong 4000 Å break in their spectra. However, this break shifts into the near-infrared (NIR) at z > 1.5 and the colors can become degenerate. The fundamental advantage of this approach, the so-called red sequence method, is that with appropriate filters, cluster elliptical galaxies at a given redshift are redder than all normal galaxies at lower redshifts. We stress that the red sequence method could be biased at high redshift since galaxies tend to become bluer and younger at high-z. Despite its biases, this technique has given notable results using Spitzer Space Telescope IRAC bands, and several galaxy clusters found in this way have been spectroscopically confirmed at z > 1.3 (e.g., Eisenhardt et al. 2008; Papovich 2008; Wilson et al. 2009). More recently, similar results have been obtained using the IR photometry in the UKIDSS Ultra-Deep Survey field (Lawrence et al. 2007) and Hubble spectroscopy (e.g., Lee-Brown et al. 2017).
During the past two decades, a new technique for detecting galaxy clusters at z > 1 has been to study the immediate surroundings of high-redshift radio galaxies (hereafter HzRGs). It is now well established that the host galaxies of powerful radio sources are among the most massive galaxies in the Universe (Mstar > 1011M⊙, Seymour et al. 2007). Because of their high masses, radio galaxies indeed represent excellent signposts to pinpoint the densest regions of the Universe out to very high redshifts (e.g., Stern et al. 2003). Some examples are the overdensities of Lyα and Hα emitters around HzRGs at 2.1 < z ≤ 5.2 (Kurk et al. 2004a; Miley et al. 2004; Venemans et al. 2005, 2007). These overdensities are likely to be progenitors of present-day (massive) galaxy clusters. However, the Lyα and Hα emitters found in these dense environments are small, faint, blue objects, likely young star-forming galaxies with masses of a few ×108M⊙ (Overzier et al. 2008), which may represent only a small fraction of the number of cluster galaxies and the total mass of the cluster.
Interestingly, overdensities at the highest redshifts often have a filamentary nature and extend beyond the projected dimension of ~2 Mpc (e.g., Pentericci et al. 1998; Carilli et al. 2002; Croft et al. 2005). Carilli et al. (2002) have studied the filaments in the field of the HzRG PKS 1138-262 at z = 2.1 in detail, but did not detect any extended X-ray emission, indicating that this structure has not yet had sufficient time to virialize. However, Kurk et al. (2004b) has shown that some segregation has occurred in this overdensity: the Hα emitters, tracing the more evolved population, are more centrally concentrated than the younger Lyα emitters. This suggests that the missing link between these protoclusters and the classical X-ray confirmed clusters found out to z ~ 1.4 (e.g., Mullis et al. 2005; Stanford et al. 2006) apparently occurs in the redshift range 1.4 < z ≤ 2. This redshift range is therefore particularly interesting for identifying clusters at a redshift beyond which the classical selection techniques are sensitive, but at a redshift where clusters are already partly virialized and a core of older, massive galaxies is in place.
Although the method of studying the immediate surroundings of HzRGs has successfully found overdensities of red galaxies at z > 2, it has been challenging to spectroscopically confirm their association with the HzRGs (e.g., Venemans et al. 2005; Kodama et al. 2007; Doherty et al. 2010). A few studies have also applied related methods to HzRGs with slightly lower redshift (e.g., Best et al. 2003; Stern et al. 2003; Galametz et al. 2009a, 2010; Franck et al. 2015; Cooke et al. 2016) and found overdensities of extremely red galaxies in the environments of HzRGs at z ~ 1.5. Overdensities of galaxy candidates at z > 1.5 were in particular discovered in the vicinity of HzRGs using Spitzer/ IRAC colour selection techniques. A number of these overdensities were recently spectroscopically confirmed by the Clusters Around Radio Loud AGNs survey (CARLA; Wylezalek et al. 2013, 2014) via a 40-orbit HST/WFC3 grism follow-up campaign (Noirot et al. 2016, 2018). At such high redshifts, these overdensities are suspected to still be forming and to be not yet (completely) bound, and the term “protoclusters” is commonly used to describe such systems. This last selection technique, based on the surroundings of HzRGs, has permitted the discovery of the galaxy protocluster on which this paper is focused.
An important aspect in the study of clusters is the demographics and distribution of AGN within clusters and their evolution with redshift. The AGN population of a cluster has indeed important implications for the AGN fueling processes and how tightly black holes (BHs) at the centers of cluster galaxies and galaxies coevolve. Numerous lines of evidence suggest that there is coevolution between the growth of the BHs and the formation of stars in galaxies. Perhaps the most striking result is the similar rate of evolution of the emissivity from AGN and star formation from z ~ 2 to the present epoch (e.g., Boyle et al. 1998; Franceschini et al. 1999; Merloni et al. 2004; Silverman et al. 2008).
AGN in clusters relative to the field provide some valuable additional observational constraints to the physical processes that affect the availability and transport of the cold gas that serves as the primary fuel for the central BH (and SF). These processes include the removal of cold gas through ram-pressure stripping (Cowie & Songaila 1977), evaporation by the hot interstellar medium (ISM, Gunn & Gott 1972), tidal effects due to the cluster potential (Farouki & Shapiro 1981; Merritt 1983) and other galaxies (Richstone 1976; Moore et al. 1996), and gas starvation due to the absence of new infall of cold gas (Larson et al. 1980). These physical processes have been invoked to explain the relative absence of luminous, star-forming galaxies, the scarcity of substantial reservoirs of cold gas, and the large fraction of relatively quiescent, early-type galaxies in local clusters (e.g., Gisler 1978; Dressler 1980; Giovanelli & Haynes 1985; Dressler et al. 1999).
Moreover, luminous AGN are rarer in local cluster galaxies than in field galaxies, although these results are based on works that do not sample the densest regions of clusters well (e.g., Kauffmann et al. 2004; Popesso & Biviano 2006), while less luminous AGN appear to be present in comparable numbers (e.g., Martini et al. 2006; Haggard et al. 2010; Marziani et al. 2017). The most frequently invoked process for the fueling of the most luminous AGN is the merger of two gas-rich galaxies (e.g., Barnes & Hernquist 1992), and the relative lack of both cold gas and major mergers is a reasonable explanation for the nearly complete absence of quasars hosted by cluster galaxies. For less luminous AGN, the case is less clear because an increasing number of physical processes such as minor mergers, galaxy harassment, various types of bars, and stellar mass loss could also play a role (e.g., Casasola et al. 2008, 2011; Combes et al. 2013; García-Burillo et al. 2014).
In addition to a local comparison between AGN in different environments, measurement of the evolution of the AGN population in clusters can constrain the formation epoch for their supermassive BHs and the extent of their coevolution with the cluster galaxy population. The first quantitative evidence for a substantial increase in the cluster AGN fraction with redshift was presented by Eastman et al. (2007), who compared the fraction of spectroscopically confirmed AGN of similar X-ray luminosities in low- and high-redshift clusters (see also Galametz et al. 2009b). Martini et al. (2009) found that the AGN fraction in cluster increases as (1 + z)5.3 (see also Fassbender et al. 2012; Rumbaugh et al. 2012; Tanaka et al. 2013), and it is quite similar to the evolution of the fraction of star-forming galaxies in clusters, (1 + z)5.7 (e.g., Haines et al. 2009). This suggests that AGN and star-forming galaxy populations evolve at similar rates in clusters.
The evolution of the AGN fraction in galaxy clusters appears to be substantially greater than the evolution of the AGN fraction in the field, where the AGN fraction increases by only about a factor of two from z ~ 0.5 to z ~ 1.2 (e.g., Alonso-Herrero et al. 2008; Bundy et al. 2008), which is several times smaller than the increase of AGN in clusters. This relative evolution appears to be broadly consistent with the behavior of star-forming galaxies in the same redshift range. Elbaz et al. (2007) showed that the fraction of galaxies that are star-forming is correlated with local galaxy density at z ~ 1, which is a reversal of the anticorrelation observed in the Local Universe. Nevertheless, a direct comparison between field and cluster surveys is complicated because the relevant studies often employ different selection criteria, such as luminosity in some bands, an estimate of the stellar mass, and different AGN luminosity limits to establish their host galaxy and AGN samples. These selection criteria are important because the AGN fraction above a given luminosity limit depends on stellar mass (e.g., Heckman et al. 2004; Sivakoff et al. 2008; Aird et al. 2012), and the evolution of the X-ray luminosity function indicates that more luminous AGN were proportionally more abundant at higher redshift (the so-called AGN downsizing phenomenon, Barger et al. 2005; Hasinger et al. 2005).
In this work, we present the spectroscopic study of 13 galaxies identified in the field of the protocluster that is associated with the radio galaxy 7C 1756+6520 at z = 1.4156 (Galametz et al. 2009a, 2010). In particular, we focus on the AGN population belonging to this protocluster. The galaxies we observed comprise both known protocluster members and possible protocluster members. This analysis has been performed on rest-frame optical spectra carried out with the Large Binocular Telescope (LBT), and was stimulated by previous results we obtained for this protocluster with LBT (Magrini et al. 2012a, hereafter M 12) and the IRAM Plateau de Bure Interferometer (PdBI, Casasola et al. 2013).
The paper is structured as follows. In Sect. 2 we present the main properties of protocluster 7C 1756+6520, and in Sects. 3 and 4 we describe LBT observations and the data reduction, respectively. The results on the galaxy population and AGN population belonging to protocluster 7C 1756+6520 are collected and discussed in Sects. 5 and 6, respectively, and the comparison between observations and predictions of some theoretical models is presented in Sect. 7. Finally, we summarize our work in Sect. 8. We assume a ΛCDM cosmology with H0 = 70 km s−1 Mpc−1, h = H0/100, Ω0 = 0.3, and ΩΛ = 0.7. With these values, 1″ corresponds to ~8.4 kpc at z ~ 1.4.
2. The target: a spectroscopically confirmed protocluster at z ~ 1.4
Galametz et al. (2009a, 2010) have isolated and spectroscopically confirmed with the optical Keck/DEep Imaging Multi-Object Spectrograph (DEIMOS) the overdensity of galaxies associated with the radio galaxy 7C 1756+6520 at z = 1.4156. The radio galaxy was initially reported to be at z = 1.48 by Lacy et al. (1999) based on the identification of a single, uncertain emission feature. In addition to the central radio galaxy, 21 galaxies have been confirmed with spectroscopic redshifts consistent with that of 7C 1756+6520 (Galametz et al. 2010; here-after G 10). The spectroscopic identifications of G 10 were based mainly on the detection of the [O II]λ 3727 Å emission line, and more rarely on that of the [Ne V]λ 3426 Å and [Ne III]λ 3869 Å emission lines. In the field around the radio galaxy, the velocity dispersion is rather large, up to ~13 000 km s−1, and the ensemble has not yet relaxed into one large structure. For these reasons, the overall structure would be better defined as a galaxy overdensity. However, the group of galaxies associated with 7C 1756+6520 is called indiscriminately a galaxy cluster, a protocluster of galaxies, or a galaxy overdensity. Throughout the paper we adopt the term overdensity or protocluster to identify the galaxy structure around 7C 1756+6520.
Two distinct smaller subgroups have been identified within this galaxy overdensity: one of eight galaxies (including the radio galaxy) centered around 7C 1756+6520 at z ~ 1.42, and a more compact group composed of four galaxies at z ~ 1.44. Galaxies belonging to both subgroups are within 2 Mpc from the radio galaxy, while most other galaxies belonging to the large-scale overdensity lie more than 2 Mpc away from the radio galaxy (see Fig. 4 below for the spatial distribution of sources in the field of the protocluster). Seven of the spectroscopically confirmed galaxies of the protocluster, including the central radio galaxy, have been classified as AGN candidates by Galametz et al. (2009a) using the Spitzer/IRAC color-color selection of Stern et al. (2005; see also Lacy et al. 2004). The nature of these AGN candidates has subsequently been confirmed by G 10, who found AGN signatures in their spectra, such as strong, broad Mg IIλ 2800 Å emission lines. Three of these AGN are located within 1″.5 of the radio galaxy, which adds evidence that a significant number of members of galaxy clusters at z > 1 are AGN, and that they lie preferentially near the cluster center (Galametz et al. 2009b; G 10).
Our group has previously studied a sample of star-forming galaxies associated with protocluster 7C 1756+6520 with observations at the LBT using the NIR spectrograph LUCI (M 12). The aim of our previous work was to derive the star formation rate, metallicity, and stellar mass of these galaxies, and locate them in the plane of the so-called fundamental metallicity relation (FMR) by combining our spectroscopic observations and the literature photometric data. The FMR is known not to evolve with redshift up to z = 2.5 for field galaxies, but it is still poorly explored in rich environments at low and high redshifts (e.g., Mannucci et al. 2010; Hunt et al. 2012; Magrini et al. 2012b; Hunt et al. 2016). We found that the properties of the star-forming galaxies in protocluster 7C 1756+6520 are compatible with the FMR, suggesting that the effect of the environment on galaxy metallicity at this early epoch of cluster formation is marginal. We also reported the spectroscopic analysis of the most luminous AGN in the protocluster, AGN1317, which located in the neighborhood of the central radio galaxy at a projected distance of ~780 kpc. We detected a strong gas outflow in the [O III]λλ 4959, 5007 Å doublet that reaches velocities of >1000 km s−1 and might be driven by the AGN radiation pressure. In addition, M 12 have spectroscopically identified a new protocluster member, called MSC2, at z ~ 1.45 (see Table A.1 in M 12).
We also studied the molecular gas content of AGN1317. Although the number of CO detections of galaxies that lie in overdensities at z > 1 and may be signs of the buildup of cluster galaxy populations, that is, protoclusters, was (at the epoch of our CO observations in 2013) and still is small (e.g., Casey 2016; Wang et al. 2016; Noble et al. 2017; Rudnick et al. 2017; Castignani et al. 2018; Hayashi et al. 2018; Strazzullo et al. 2018), almost all of the CO detections of protocluster members are physically associated with HzRGs (e.g., Emonts et al. 2014; Dannerbauer et al. 2017). Motivated by these findings, we searched for molecular gas content in AGN1317. With the IRAM PdBI, we indeed detected CO emission in AGN1317 and derived a substantial molecular gas mass of 1.1 × 10¹⁰M⊙ (Casasola et al. 2013), which is comparable to that found in massive submillimeter galaxies at z ~ 1 − 3.5 (e.g., Greve et al. 2005) and star-forming galaxies at z ~ 1.5 − 3 (e.g., Carilli & Walter 2013).
3. Observations
The observations presented here were taken in 2014 with the LBT, located on Mount Graham, Arizona (Hill et al. 2006), using the instrument LUCI 1 of the NIR spectrograph LUCI (Ageorges et al. 2010; Seifert et al. 2010). LUCI 1 is mounted on the bent Gregorian focus of the left primary mirror and has a wavelength coverage from 8500 to 25 000 Å. LUCI is available in imaging, long-slit, and multi-object spectroscopy (MOS) modes1.
Taking advantage of the field of view (FoV) of LUCI 1 (the useful FoV = 4′ × 2′.82) in MOS mode, we obtained simultaneous deep spectroscopy of the AGN belonging to the galaxy overdensity associated with radio galaxy 7C 1756+6520. Figure 1 shows the location of the mask we adopted for observations. The mask (in cyan) was centered at RAJ2000 = 17h56m59s, DecJ2000 = 65°18′42″ with a rotation angle with respect to north of 45°, and this allowed us to observe the central part of the protocluster, including the radio galaxy. The main targets of our observations were the AGN, spectroscopically confirmed by G 10. Our list of highest priority targets includes AGN1317, the brightest galaxy, the central radio galaxy 7C 1756+6520, and two other AGN, AGN1110 and AGN1354. We also included several other objects in the mask design that might be protocluster members based on their location, magnitude, and angular size.
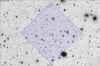 |
Fig. 1. Location of the mask adopted for our observations at LBT plotted on the B-band image (NOAO). The mask (in cyan) was centered at RAJ2000 = 17h56m59s, DecJ2000 = 65°18′42″ with a rotation angle with respect to north of 45°. This mask allowed us to observe the central part of the protocluster, including the radio galaxy. |
To detect the most important emission lines in the rest-frame optical spectrum of AGN and of emission-line galaxies, we selected the grating G210-HiRes with the J and H wavelength ranges. The resulting spectral coverage, optimized to center the brightest emission lines of the spectra, is 11 200−12 600 Å and 14 800−16 700 Å in the J and H wavelength range, respectively. This allowed us to include several emission lines at the nominal redshift of the central HzRG of z ~ 1.41: Hβ was observed at 11 740 Å, [O III]λ 5007 Å at 12 080 Å, Hα at 15 820 Å, and [N II]λ 6583 Å at 15 870 Å. The spectroscopic resolving power of G210-HiRes is R = 8460 and R = 7838 in the J and H wavelength range, respectively, meaning that with a slit width of 1″, the spectral resolution is ~2.8 Å and ~4 Å, respectively, which is suitable for separating emission lines and sky lines.
To perform the sky subtraction, we adopted the nodding procedure, in which the object of interest is observed at different positions along the slit. The exposure was 5 h in the J wavelength range, and for technical reasons, it was only 150 s in the H wavelength range. The average seeing in the J wavelength range was 1″.8, and the airmass was 1.3. In the H wavelength range, the typical seeing was 1″.1 and the airmass was again about 1.3. The data were spectroscopically calibrated with a standard star for flux calibration, which was observed during the same nights as the science observations. This was done for all observations setups, centering the telluric stars in the bluest and reddest slits of each mask. The uncertainty on the wavelength calibration, derived from the sky lines, was found to be ~1 Å, and it was consistent between the two gratings.
4. Data reduction
Data reduction was made with the LUCI 1 spectroscopic reduction pipeline (pandora.lreducer3). It consists of a set of tasks, based on VIPGI (VIMOS Interactive Pipeline and Graphical Interface, Scodeggio et al. 2005) recipes, which work in Linux systems and are written in c and python. Details on the reduction process are given in M 12. For the self-consistency of this paper, we here recall the main steps of the data reduction. The preliminary steps of the pipeline work flow concern the creation of master calibration frames. When all calibration frames were available, cosmic rays and bad pixels were removed, and dark and flat-field corrections were applied; then the spectra were extracted. In this step, slit curvatures were removed and slits were extracted and wavelength calibrated. Sky subtraction was made on 2D-extracted, wavelength-calibrated spectra. Further sky subtraction residuals were removed by subtracting the median computed along the spatial direction for each column of the spectrum.
To detect the emission lines, we identified them in the 2D spectra. When we found an emission line in the 2D spectra, we extracted the single 1D spectra from the 2D stacked frame by coadding for each object all the rows containing the emission line features. This is shown for the confirmed protocluster members in the J wavelength range in Fig. 2.
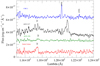 |
Fig. 2. 1D spectra obtained in the J wavelength range for the following confirmed proto-cluster members: the radio galaxy, AGN1354, AGN1317, CMC 1 (see the first portion of Table A.1, “Protocluster members”). The most prominent emission lines, Hβ and [O III]λλ 4959, 5007 Å, are labeled. The protocluster member AGN.1110 is not plotted (see the text for details). |
Emission-line fluxes were measured with the task SPLOT of IRAF4 in the 1D spectra. We derived the redshifts with a Gaussian fit of the brightest emission line for each target, which allowed us to find the central wavelength of the line. We derived uncertainties on the spectroscopic redshifts by adding in quadrature the fitting uncertainties of all emission lines observed for a given source and the uncertainty in the wavelength calibration.
The signal-to-noise ratio (S/N) for the presumed [O III]λ 5007 Å emission lines of the newly identified galaxies (from CMC 2 to CMC 9) ranges from about 3 to approximately 8. To verify our identifications, it might be useful to detect the other line of the doublet of the [O III], the [O III]λ 4959 Å, which has a flux of about 1/3 with respect to the [O III]λ 5007 Å. However, given the S/N of the [O III]λ 5007 Å emission lines, the [O III]λ 4959 Å emission lines are expected to have an S/N from 1 to less than 3, which means that these lines will be very hard to detect. In order to check the reliability of the redshift determination for these newly identified galaxies, we produced their stacked spectrum, as discussed in Sect. 5.1.
Following G 10 and M 12, we assigned a quality flag “A” or “B” to the measured redshifts: “A” indicates a secure spectroscopic redshift based on at least two spectral features, while “B” indicates high-level confidence in the spectroscopic redshift based on a single spectral feature, almost always [O III]λ 5007 Å. We added the flag “c” for the galaxies that are members and possible members of the protocluster (see Sect. 5 for the definition of protocluster members). The redshift determinations with quality flag “A” correspond always to galaxies belonging to the protocluster, and they therefore also have a flag “c”. The redshift determinations with quality flag “B” can either correspond to galaxies belonging to the protocluster (with flag “c”) or to separate galaxies (without flag “c”).
Since the H wavelength range part of the spectra was observed with a very short exposure time, we only detected the most intense emission lines of the four brightest objects: the radio galaxy, AGN1110, AGN1317, and AGN1354. For AGN1110 we identified only the Hα emission line very close to a sky emission line in the H wavelength range, while in the J wavelength range we only detected the continuum spectrum. The galaxy AGN1110 might have a spectrum with features similar to those of the central radio galaxy 7C 1756+6520, where only Hα and Hβ lines have been detected. In the case of AGN1110, the S/N is much lower, and thus Hβ is below the detection limit. For this latter reason, Fig. 2 shows the 1D spectrum in the J wavelength range but does not contain AGN1110.
5. Results on the galaxy population of the protocluster
In this section we present and discuss the results obtained from our LBT observations and their combination with other data that are available in the literature on the galaxy population that we identified in the protocluster around radio galaxy 7C 1756+6520.
5.1. Emission-line identification and galaxy redshifts
The main results on emission-line identification, galaxy redshifts, and emission-line fluxes are collected in Tables A.1 and 1. In Table A.1 we report the identification name for each galaxy (from G 10 when available, otherwise they are identified with the name CMC [Casasola, Magrini, Combes, from the names of the first three authors of this work] followed by a number), the J2000 RA and Dec coordinates, the derived spectroscopic redshift with the flags as defined in Sect. 4, emission lines used to derive the redshift, the spectroscopic redshift from G 10, and the corresponding emission lines we used to derive the redshift, when available, and the spectroscopic classification, AGN versus galaxy, based on spectra acquired so far for these galaxies. The galaxies taken from G 10 and M 12 that we list in Table A.1 are all members of the protocluster, although their redshift determinations are quoted without the flag c. This flag was defined in this paper because our observations comprise both members and non-members of the protocluster. In Table A.1 we preferred to quote the original flags assigned by G 10 and M 12. Table 1 collects the observing wavelengths, the measured emission-line fluxes, and the FWHM for each detected source.
Measured emission-line fluxes.
The greatest part of the redshift identification is based on the detection of the Hα, Hβ , and [O III]λ 5007 Å emission lines. For the four galaxies that have previously been confirmed as protocluster members (the radio galaxy, AGN1110, AGN1317, and AGN1354), we derived the redshift by detecting emission lines that have never before been detected for these sources. For the central radio galaxy 7C 1756+6520 we detected for the first time Hα and Hβ emission lines (z = 1.4152 ± 0.0009, Ac). This redshift determination is perfectly consistent within the errors with that of G 10 for radio galaxy 7C 1756+6520 (see Table A.1). Our observations confirm AGN1317 as a particularly interesting source: after the detection of [Ne V]λ 3426 Å and [O II]λ 3727 Å by G 10, we confirm the detection of M 12 of very bright emission lines in Hα, [N II]λλ 6548, 6583 Å, [S II]λλ 6716, 6731 Å, Hβ, and [O III]λλ 4959, 5007 Å. Based on four emission lines, we derive a redshift of z = 1.4147 ± 0.0010 (Ac) for AGN1317. This redshift is consistent within the errors with that found by G 10 (z = 1.4162 ± 0.0005, A), based on two emission lines (see Table A.1). For AGN1354, we detected the Hα, Hβ , and [N II]λ 6583 Å emission lines, which allowed us to unambiguously determine the redshift of this source (z = 1.4177 ± 0.0009, Ac). The redshift of AGN1354 has been derived by G 10 by detecting only the Mg IIλ 2800 Å emission line (z = 1.4153 ± 0.0003, B). We stress that our redshift determination for AGN1354 is based on more lines than were derived by G 10. For AGN1110, we detected for the first time the Hα emission line, which it is quite remarkable because the exposure time in the H wavelength range is short. Based on this single emission line, we derived a redshift of z = 1.4148 ± 0.0001 (Bc) for AGN1110, which is not consistent within the errors with (although similar to) the redshift determination of G 10 (z = 1.3935 ± 0.0001, B) based on the single emission line of [O II]λ 3727 Å (see Table A.1).
We also mention that in case of AGN, strong outflows can bias the redshift determination. However, only for AGN1317 has an outflow been detected so far (M 12). The [O III]λλ 4959, 5007 Å lines show a clear asymmetric profile with prominent blueshifted wings. This is a characteristic signature of outflows (see Fig. 6 in M 12).
We identified a new protocluster member, CMC 1, by detecting Hβ and [O III]λ 5007 Å emission lines. We assigned a redshift of 1.4055 ± 0.0047 (Ac) to CMC 1, which is consistent with that of the central radio galaxy. We identified eight new possible protocluster members (CMC 2–9) by assuming that the detected emission line is the [O III]λ 5007 Å for almost all cases and the Hβ line for one galaxy (CMC 7). These emission-line identifications correspond to galaxies belonging to the redshift range of z ~ 1.38−1.43 (Bc). To maximize the S/N, we produced a rest-frame stacked spectrum by combining the spectra of the possible protocluster members in which we detected the [O III]λ 5007 Å line. This is shown in Fig. 3, where both the [O III]λ 4959 Å and Hβ emission lines are detected. We also measured the ratio between the two lines of the [O III] doublet and found that it is consistent with the theoretical value of ~3 (Osterbrock & Ferland 2006). This confirms the reliably of the line identification and that these galaxies belong to the protocluster.
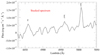 |
Fig. 3. 1D stacked rest-frame spectrum in the J wavelength range of the possible protocluster members where we detected the [O III]λ 5007 Å line (CMC 2–CMC 9, except for CMC 7, where we identified the detected emission line as the Hβ, see Table A.1). |
Finally, we detected one emission line for another two unknown sources (CMC 10 and CMC 11). We identified these lines as the Hβ line for CMC 10 and CMC 11. If this emissionline assignation is correct, these sources would be at redshift z ~1.37 (B).
5.2. Protocluster members and their spatial and redshift distribution within the structure
The left panel of Fig. 4 shows the spatial distribution of the 15 sources we detected in the field of the protocluster (see Table A.1). There is no clear and consensual definition of a galaxy cluster. Eisenhardt et al. (2008) defined a z > 1 cluster as spectroscopically confirmed if it contains at least five galaxies within a radius of 2 Mpc whose spectroscopic redshifts match to within ±2000 (1 + 〈 z 〉) km s−1. According to this definition, 13 of the 15 objects we observed would be part of the protocluster. Since 4 of these 13 galaxies (the radio galaxy and the 3 AGN) have previously been classified as protocluster members, we would add 9 new protocluster members. For these 9 proto-cluster members, we give a secure spectroscopic redshift for CMC 1 (classified as “Protocluster members” in Table A.1), while we attribute a redshift based on only one emission line to the other 8 sources (CMC 2–9, classified as “Possible protocluster members” in Table A.1). However, the spectroscopically confirmed high-redshift galaxy clusters in Eisenhardt et al. (2008) and in other works (e.g., Hilton et al. 2007; Hayashi et al. 2010, 2014) usually show much narrower velocity distributions (~1000–2000 km s−1). Most of the newly detected galaxies also satisfy these more stringent conditions. To verify this last definition of cluster members, the peculiar velocity of a galaxy with redshift z in the rest-frame of a cluster with redshift zcl is defined as (1)
(1)
(e.g., Milvang-Jensen et al. 2008). Based on Eq. (1) and assuming that the protocluster redshift is that of the radio galaxy, zcl = 1.4152, galaxies CMC 1, CMC 2, CMC 3, and CMC 7 have peculiar velocity offset of ~900–1200 km s−1 with respect to the radio galaxy, and that of galaxies CMC 5, CMC 6, CMC 8 and CMC 9 is ~1400–2500 km s−1 with respect to the radio galaxy. Galaxy CMC 4 instead has a peculiar velocity offset of ~3800 km s−1 with respect to the radio galaxy. Under the hypothesis that the emission line detected in galaxies CMC 10 and CMC 11 is the Hβ line, these sources would have peculiar velocities offset by ~5800−5950 km s−1 with respect to the central radio galaxy. Although these two galaxies fall in the field of the galaxy overdensity, they are not expected to be part of it (they are classified as “Non-protocluster members” in Table A.1). Additional spectroscopic observations are required to define the redshift of these sources, in particular, deeper H wavelength range observations.
By merging the spectroscopically confirmed protocluster members (taking into account the “Possible protocluster members” of Table A.1 as well) derived from this work, G 10, and M 12, 31 galaxies, including the central radio galaxy, are found around redshift 1.4152 ± 0.056. This corresponds to peculiar velocities ≲5000 km s−1 with respect to the radio galaxy (or ≲3800 km s−1 excluding the galaxy MSC2). For the protocluster members of G 10 and M 12 that we used in our analysis, we refer to the bottom part of Table A.1. For the protocluster members in common with G 10 and M 12, we adopted our redshift determinations. This result is consistent with that of G 10, who found 21 galaxies, including the central radio galaxy, at redshift 1.4156 ± 0.025. This corresponds to peculiar velocities ≲3000 km s−1 with respect to the radio galaxy.
The right panel of Fig. 4 shows all 31 galaxies that are spectroscopically confirmed members of the overdensity around radio galaxy 7C 1756+6520. To better compare this figure with Fig. 6 of G 10, we adopted similar color and redshift ranges (although we consider a larger redshift window and the redshift ranges are therefore slightly different). As described in Sect. 2, G 10 have identified two subgroups in the protocluster: one that forms a large structure at the redshift of the radio galaxy, z ~ 1.42 (yellow triangles and large yellow stars), and another compact structure at z ~ 1.44 that forms a subgroup off-set by Δv ~ 3000 km s−1 and approximately 1″.5 east of the radio galaxy (red squares). The right panel of Fig. 4 seems to suggest that another large subgroup lies at z ~ 1.40 (light blue circles), which is similar to the subgroup at z = 1.42 in terms of spatial distribution.
A way to better characterize the redshift distribution of protocluster members within the overdensity is shown in Fig. 5: it displays the redshift histogram obtained by plotting all 31 spectroscopically confirmed protocluster and possible protocluster members. Based on the available statistics, the redshift distribution is dominated by one main peak in redshift space at z = 1.42 that can be described by a Gaussian function with standard deviation of σ = 0.01. The Gaussian distribution probability in the range of redshift values [−σ, +σ] is 52%, in the range [−2σ, +2σ] it is 84%, and in the range [−3σ, +3σ] it is 97%. This result agrees with the typical redshift distribution within high-redshift galaxy clusters (we refer, e.g., to Halliday et al. 2004, and following publications in the context of the ESO Distant Cluster Survey, EDisCS). Substructures in the redshift histogram are sometimes found in high-redshift galaxy clusters (e.g., at z = 0.75, Cl1054-12 shows an evident secondary peak, and at z = 0.54, Cl1232 shows a substructure in their redshift histograms, Halliday et al. 2004). However, it is not immediately obvious that these substructures are spatially offset from each other on the sky.
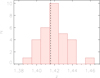 |
Fig. 5. Redshift histogram for the spectroscopically confirmed members and possible members (N = 31) of the protocluster around HzRG 7C 1756+6520 at z = 1.4156. The plotted redshifts come from this work, G 10, and M 12. For the protocluster galaxies in common with G 10 and M 12, we adopted our redshift determinations. Redshift bins are of 0.01 (~3000 km s−1 observed frame), corresponding to the standard deviation of the Gaussian function distribution. The vertical dashed line marks the redshift of the central HzRG 7C 1756+6520. |
That protocluster members lie even at large scale with respect to 7C 1756+6520 is consistent with a filamentary nature of overdensities and that they extend beyond the projected dimension of ~2 Mpc at intermediate redshift (see, e.g., the galaxy overdensity at z ~ 0.4 studied by Zappacosta et al. 2002; Mannucci et al. 2009) and at high redshift (see, e.g., the protocluster around PKS 1138−262 at z ~ 2.16: Pentericci et al. 1998; Carilli et al. 2002; Croft et al. 2005). This might suggest that we are seeing galaxies located in a filament of the large-scale structure associated with the protocluster around 7C 1756+6520.
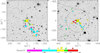 |
Fig. 4. Left panel: galaxies we spectroscopically detected in the field of the overdensity around radio galaxy 7C 1756+6520 plotted in the B-band image (NOAO). They comprise protocluster members, possible protocluster members, and non protocluster members (see Table A.1). ID numbers, corresponding to the slit, are provided for each source (see Table A.1). The five colors and symbols indicate different redshift ranges: magenta stars z < 1.385, light blue circles 1.385 ≤ z ≤ 1.411, yellow triangles 1.411 < z < 1.427, green ellipses 1.427 ≤ z ≤ 1.434, and red squares (in the right panel) z > 1.434. The central radio galaxy 7C 1756+6520 is the large yellow star in the center. North is up and east to the left. The FoV is about 480″ × 480″, centered on the central radio galaxy. 1″ corresponds to ~8.4 kpc. Right panel: all protocluster and possible protocluster members with spectroscopically confirmed redshift from this work, G 10, and M 12. Symbols and colors are the same as in the left panel. The FoV is 840″ × 840″. The dashed circles indicate a distance of 2 Mpc from the central radio galaxy. |
5.3. Cluster velocity dispersion
Following the method of Beers et al. (1990) for estimating the kinematical properties of galaxy clusters for a few members, we found that the velocity dispersion of the sources within 2 Mpc from the radio galaxy (i.e., those classified as “Protocluster members” and “Possible protocluster members” in Table A.1) is σcl ~ 1700 ± 140 km s−1. This value is consistent within 3σ with the velocity dispersion found by G 10 (σcl ~ 1270 ± 180 km s−1) when we adopt the same method for the cluster members that they identified in almost the same region as we considered. Despite this agreement, these values of the velocity dispersion are only indicative because of the small numbers of galaxies used by us and G 10 in deriving the velocity dispersion.
Measurements of cluster velocity dispersions are often used to estimate cluster masses (e.g., Fisher et al. 1998; Tran et al. 1999; Borgani et al. 1999; Lubin et al. 2002). Early measurements of velocity dispersions (e.g., Danese et al. 1980) have typically assumed a Gaussian velocity distribution. As datasets have increased in quality and size, significant deviations from Gaussian behavior have often been found (e.g., Zabludoff et al. 1993; Fisher et al. 1998). These are likely associated with the substantial structural irregularities (usually termed substructures) that are observed in many clusters (Geller & Beers 1982; Dressler & Shectman 1988). Any statistics used to estimate the cluster velocity dispersion should therefore be robust against outliers and against variations in the shape of the underlying velocity distribution (Beers et al. 1990). However, since the overdensity around radio galaxy 7C 1756+6520 has a velocity dispersion exceeding 1000 km s−1 and it is unlikely to be fully virialized, its velocity dispersion may therefore not provide a robust estimate of its mass. For this reason, we do not provide an estimate of the protocluster mass from the velocity dispersion.
5.4. Dressler-Shectman test
In order to search for substructures in three-dimensional space (which were only qualitatively discussed in Sect. 5.2 and in the previous works on this protocluster), we combined velocity and positional information by computing the robust statistics devised by Dressler & Shectman (1988). Starting from a list of cluster members with measured positions and velocities, the listed 10 nearest neighbors on the sky are determined. The local mean velocity and velocity dispersion are computed from this sample of 11 galaxies. These quantities, defined for each galaxy in the list, are then compared to the global cluster mean velocity and velocity dispersion using the parameter δ, which is defined as (2)
(2)
where v̄cl and σcl are the cluster velocity and the cluster velocity dispersion, respectively, while v̄local and σlocal are the locally defined quantities for each galaxy.
Dressler & Shectman (1988) also defined a cumulative deviation Δ, which measures the amount of clumpiness in the cluster, that is, the sum of for Ng
cluster members. This is expressed as (3)
(3)
The Δ statistics is similar to χ2, although Dressler & Shectman (1988) chose not to square the derivations before summation in order to de-emphasize the largest, rarest derivations. If the cluster velocity distribution is close to Gaussian and local variations are only random fluctuations, then Δ will be on the order of Ng.
We applied the Dressler-Shectman (DS) test starting from the 31 protocluster and possible protocluster members identified so far. This number is higher than the formal minimum number required to perform the test (11), and is slightly higher than the lower limit (26) considered by Dressler & Shectman (1988) to apply their method.
This technique does not allow a direct identification of galaxies belonging to a detected substructure. The position of sub-structures can be identified by plotting the distribution of the galaxies on the sky, however, using symbols whose size is proportional to the parameter δ, thus quantifying the local deviation from the global kinematics of the cluster. This plot is shown in Fig. 6, where the size of the symbols is proportional to eδ/2. The circles are colored according to the criteria adopted by Milvang-Jensen et al. (2008), who applied the DS test to 15 clusters in the context of the EDisCS survey. By considering protocluster members with z within the range [−3σcl, +3σcl] from zcl and depending on in which bin  falls, the circles in Fig. 6 are as follows: blue and dashed [−3σcl, −1σcl], green and solid [−1σcl, +1σcl], and red and hashed [+1σcl, +3σcl]. The protocluster member MSC2 given from M 12 does not fall in the range [−3σcl, +3σcl], and for this reason, MSC2 is excluded from the DS test. The applied DS test is based on Ng = 30 (31 protocluster members minus MSC2), giving Δ = 56.95. To first order, the many large circles in a given area should correspond to a sub-structure, that is, a spatial and kinematical correlation of separate structures. The visual inspection of Fig. 6 does not seem to suggest the presence of substructures.
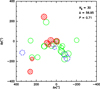 |
Fig. 6. Dressler-Shectman (DS) plot. It shows the x, y location of the spectroscopically-confirmed proto-cluster members, centered on 7C 1756+6520. The DS test is applied to proto-cluster members with z within the range [−3σcl, +3σcl] from zcl. The radii of the plotted circles are proportional to eδ/2, where δ is the DS measurement of local deviation from the global velocity dispersion and mean recession velocity (cf. Eq. (2)). Depending on in which bin |


The Δ statistic can be used to give a quantitative estimate of the significance of putative substructures. We computed a set of 1000 Monte Carlo simulations by randomly reshuffling the velocities of the protocluster members. This removes any significant 3D substructure. The statistical significance of an observed substructure can then be quantified by the fraction P (Dressler & Shectman 1988) of the simulations that yield Δ values higher than the observed value, where a low value of P (i.e., very close to 0 in a range between 0 and 1) corresponds to a high significance. For Ng = 30 and = 56.95, we obtained a substructuring significance P = 0.71. This high value of P confirms that we are not able to define the presence of substructures within protocluster 7C 1756+6520 on a statistical basis.
Halliday et al. (2004) tested five galaxy clusters and detected significant substructure in two clusters: Cl1232.5-1250 at z = 0.54 and Cl1216.8-1201 at z = 0.79. Halliday et al. (2004) identified substructures in galaxy clusters with ~55–70 available spectroscopic members, while no substructures were found in clusters with ~30–50 available spectroscopic members. Out of the nine galaxy clusters, Milvang-Jensen et al. (2008) detected significant substructures in two clusters: Cl1037.9-1243a at z = 0.43 and Cl1354.2-1230 at z = 0.76. Milvang-Jensen et al. (2008) instead identified substructures with ~20–45 available spectroscopic members. The fraction of EDisCS clusters with detected substructures is 29%. A similar percentage, 31%, was found by Solanes et al. (1999) for a local (z ≲ 0.1) sample of clusters from the ESO Nearby Abell Cluster Survey (ENACS).
5.5. Phase-space diagram
In order to derive information on the orbital histories of galaxies belonging to the overdensity 7C 1756+6520, we produced a position versus velocity phase-space diagram (e.g., Hernández-Fernández et al. 2014; Haines et al. 2015; Jaffé et al. 2015, 2018; Noble et al. 2016; Yoon et al. 2017). The path a galaxy takes through a cluster, and thus the exposure of the galaxy to different density environments, is indeed encoded in its orbital history. Unfortunately, the orbital history is not directly observable as we are limited to a single projected snapshot in time. However, simulations have shown that phase-space diagrams (the member galaxy line-of-sight velocity relative to the cluster versus clustercentric radius) can help to circumvent this problem, as it is sensitive to the time since galaxy infall (e.g., Gill et al. 2005; Haines et al. 2012; Taranu et al. 2014). Moreover, phase-space diagrams can be used to study cluster processes such as ram-pressure stripping (e.g., Hernández-Fernández et al. 2014; Jaffé et al. 2015, 2018; Yoon et al. 2017) or tidal mass loss (e.g., Rhee et al. 2017).
Using the Millennium Simulation from Springel et al. (2005), Haines et al. (2012) traced out galaxy accretion histories for orbiting galaxies of 30 massive clusters as a function of phase space (see Fig. 3 in Haines et al. 2012). These diagrams reveal the distinct trumpet-shaped (or chevronshaped) loci occupied by the older, virialized population with respect to the more recently accreted infall population (see also Haines et al. 2015). Thus, a phase-space analysis for the environment can effectively account for distinctive cluster populations and alleviate some of the projection effects that bias the traditional probes for environment: clustercentric radius and local density.
Figure 7 shows the projected phase-space diagram for the identified 31 members of protocluster 7C 1756+6520. It displays line-of-sight velocity versus clustercentric radius, normalized by the cluster velocity dispersion, and the radius R200, respectively. By definition, R200, which approximates the virial radius, is the radius inside which the density is 200 times the critical density. The radius R200 was computed from the cluster velocity dispersion as in Poggianti et al. (2006), (4)
(4)
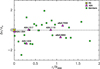 |
Fig. 7. Phase-space diagram (line-of-sight velocity vs. clustercentric radius, normalized by the protocluster velocity dispersion and the radius R200, respectively) for the spectroscopically identified 31 members of the overdensity 7C 1756+6520. Different symbols refer to different types of protocluster members, as specified in the legend. RG refers to the central radio galaxy of the protocluster. The names of the AGN are also reported. The dashed horizontal line is drawn at v/σv = 0, corresponding to the systemic velocity of the protocluster. |
where σcl has been computed in Sect. 5.3 and the cosmological parameters have been defined in Sect. 1 (see also Finn et al. 2005). Based on Eq. (4), we derived a value of R200 = 1.89 Mpc.
Figure 7 shows that three AGN (AGN1110, AGN1317, and AGN1354) of our sample lie at small projected protocluster centric radii (r/R200 < 1) and have velocities that are remarkably similar to the systemic velocity of the protocluster (Δv/σv ≃ 0). Galaxies in the region in the phase-space diagram at low velocity and small radii have a high probability to be a “virialized” population that has been part of the protocluster for a long time (e.g., Hernández-Fernández et al. 2014; Haines et al. 2015; Jaffé et al. 2015, 2018; Noble et al. 2016; Rhee et al. 2017; Yoon et al. 2017). Although we recall that the projected velocities and radii are both lower limits to the 3D values of these quantities (see Fig. 6 in Jaffé et al. 2018), the position of AGN1110, AGN1317, and AGN1354 in our diagram might suggest that these AGN and the central radio galaxy form a population that has been coexisting in the densest core region of this forming structure. We performed the 2D Kolmogorov-Smirnov (KS) test (Fasano & Franceschini 1987) to quantify the probability that the AGN at low relative velocity (the radio galaxy, AGN1110, AGN1317, and AGN1354) and the galaxies without AGN are two different populations in the phase-space diagram. This statistical test is the generalization of the classical 1D KS test and is suitable for analyzing (random) samples defined in two or three dimensions. Based on the 2D KS test, the significance of the equivalence between the distribution of AGN with low relative velocity and that of galaxies without AGN in the phase-space diagram is 23%. In other words, the probability is low that the two populations come from the same parent distribution. Different regions in the phase-space diagram are populated by galaxies with different infall times, that is, they have accreted onto the cluster at different epochs. Galaxies tend to follow a path in this diagram as they settle into the cluster potential, and those that have spent more time in the structure settle at low relative velocities (see Fig. 1 in Rhee et al. 2017).
The other three AGN of our sample are located in different regions of the phase-space diagram. Galaxy AGN1206 is located within R200 (r/R200 ≃ 0.3) and has a different velocity from the systemic velocity of the protocluster (Δv/σv ≃ −1.4), while sBzK.7556 and sBzK.5860 are located outside R200 (r/R200 ≃ 1.1 for both AGN), and their velocity is slightly different with respect to the systematic velocity of the protocluster (Δv/σv ≃ 0.4 and Δv/σv ≃ −0.7 for sBzK.7556 and sBzK.5860, respectively).
6. Characterization of the AGN population
In this section we analyze the characteristics of the AGN in protocluster 7C 1756+6520, with a focus on one object in particular, AGN1317.
6.1. AGN population within the protocluster
As described in Sect. 1, the galaxy protocluster associated with 7C 1756+6520 is characterized by a high fraction of AGN protocluster members: seven AGN, including the central radio galaxy, have been spectroscopically confirmed in close proximity both spatially and in redshift space of the protocluster. This high AGN fraction detected so far, ~23%, makes the overdensity around 7C 1756+6520 similar to the interesting and well-studied cluster around the radio galaxy PKS 1138−262 from this point of view as well (Pentericci et al. 2002; Croft et al. 2005), in addition to the extension (see Sect. 5.2). The source PKS 1138−262 is a massive forming radio galaxy at z ~ 2.16 (Pentericci et al. 1998) that is surrounded by overdensities of Lyα emitters (Pentericci et al. 2000), extremely red objects (Kurk et al. 2004a; Koyama et al. 2013), Hα emitters (Kurk et al. 2004b), X-ray emitters (Pentericci et al. 2002), and an overdensity of dusty starbursts (Dannerbauer et al. 2014; Rigby et al. 2014), several of which are spectroscopically confirmed to be close to the radio galaxy redshift. Five of the 18 X-ray sources (~28%) detected by Pentericci et al. (2002) are AGN, including the central radio galaxy. From the soft X-ray luminosity function of AGN, Pentericci et al. (2002) estimated how many sources are expected in a given region of the cluster PKS 1138−262, finding that it contains about twice the number of expected AGN. More recently, Pentericci et al. (2013) also found high AGN fractions by studying eight galaxy groups from z ~ 0.5 to z ~ 1.1. They found that the fraction of AGN with Log LH > 42 erg s−1 in galaxies with MR < −20 varies from less than 5% to 22%, with an average value of 6.3%, which is more than double the fraction for massive cluster at similar high redshifts (e.g., Overzier et al. 2005). Martini et al. (2013) estimated that the cluster AGN fraction in a sample of 13 clusters of galaxies at 1 < z < 1.5 is ~3% for AGN with rest-frame, hard X-ray luminosity greater than LX, H ≥ 1044 erg s−1. Based on these findings, the galaxy protocluster around 7C 1756+6520 seems to be a particularly interesting object.
The seven spectroscopically confirmed AGN in protocluster 7C 1756+6520 also suggest a higher AGN fraction than in local and moderate high-redshift (z ~ 0.6) galaxy clusters (e.g., Pentericci et al. 2002, 2013; Eastman et al. 2007). In the nearby Universe, AGN rarely occur in clusters, comprising only ~1% of all cluster galaxies (e.g., Dressler et al. 1985; Martini et al. 2007, 2009; Arnold et al. 2009), while they are much more common in the field population (~5%, e.g., Huchra & Burg 1992; Deng et al. 2012). As described in Sect. 1, some works found a clear increasing trend of the AGN fraction with redshift. Pentericci et al. (2013) reported that most of the low-redshift groups have no AGN, while at z > 0.5−1, many have an AGN fraction of ~5–10% among bright galaxies (see also Eastman et al. 2007; Galametz et al. 2009b; Martini et al. 2009, 2013).
The high fraction of AGN in protocluster 7C 1756+6520 might suggest that the AGN were probably triggered at around the same time, presumably by the ongoing formation of the cluster. This would support models in which AGN feedback is an important component of the early phases of galaxy and cluster formation (e.g., Haehnelt & Kauffmann 2000; Rawlings 2003).
6.2. Focus on AGN1317
Among the spectroscopically confirmed AGN proto-cluster members, AGN1317 seems to be particularly interesting based on the rich observational dataset collected so far on it (Galametz et al. 2009a,b; G 10, M 12, Casasola et al. 2013; and this work). The galaxy AGN1317 has been classified as an AGN for the first time based on the detection of broad Mg II, [Ne V], and [O II] by G 10. Based on the emission lines we observed, we are able to better characterize the AGN nature of AGN1317 by using Baldwin, Phillips & Terlevich (BPT) diagrams (Baldwin et al. 1981). These diagrams are typically used to distinguish between normal AGN (Seyferts and quasars), low-ionization nuclear emission-line regions (LINERs), and normal H II regions on the basis of their [O III]λ 5007 Å/Hβ, [N II]λ 6583 Å/Hα, [S II]λλ 6716, 6731 Å/Hα, and [O I]λ6300 Å/Hβ flux ratios.
We produced the BPT diagrams [O III]/Hβ versus [N II]/Hα and [O III]/Hβ versus [S II]/Hα by combining observations presented in this paper and in M 12. Since we treated ratios of nearby pairs of lines ([O III]λ and Hβ, and [N II] and Hα), differences in flux calibration that are due to different observation sets (M 12 and ours) did not influence the location of the AGN in the diagnostic diagrams. Unfortunately, we were not able to separate the Hβ narrow and broad components (but we measured the flux from both components, Hβ n + b, see Table 1), and for this reason, we estimated the expected flux of the Hβ n component assuming that the Hβ b/Hβ n flux ratio is the same as for Hα b/Hα n (~3.5). This gave an [O III]/Hβ flux ratio of ~6.2. From M 12 we derived a [N II]/Hα flux ratio of ~3.3.
Figure 8 shows the location of AGN1317 in the two BPT diagrams we produced. We adopted the galaxy classification of Kewley et al. (2006). In the left panel of Fig. 8 ([O III]/Hβvs [N II]/Hα), the solid and dashed lines are the classification curves of Kewley et al. (2001) and Kauffmann et al. (2003), respectively. Galaxies that lie below the dashed Kauffmann et al. (2003) line are classified as H II-region-like galaxies. Starforming galaxies form a tight sequence from low metallicities (low [N II]/Hα, high [O III]/Hβ) to high metallicities (high [N II]/Hα, low[O III]/Hβ), which we refer to as the star-forming sequence. The AGN mixing sequence begins at the high-metallicity end of the star-forming sequence and extends toward high [O III]/Hβand [N II]/Hαvalues. Galaxies that lie in between the two classification lines are on the AGN-H II mixing sequence and are classified as composites. Galaxies that lie above the Kauffmann et al. (2003) line are classified as AGN. Based on this classification and our emission-line flux ratios, we confirm that galaxy AGN1317 is an AGN. We infer the same result with the BPT diagram shown in the right panel of Fig. 8 ([O III]/Hβvs. [S II]/Hα). As for the left panel, the solid line represents the Kewley et al. (2001) extreme starburst classification, while the dashed line shows the separation between Seyferts and LINERs. Seyfert galaxies lie above the Kewley et al. (2001) classification line and above the Seyfert-LINER line, while LINERs lie above the Kewley et al. (2001) classification line and below the Seyfert-LINER line. Based on the adopted classifications and our emission-line flux ratios, we confirm for the first time through BPT diagrams that AGN1317 hosts an AGN (Seyfert or quasar).
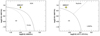 |
Fig. 8. Baldwin et al. (1981; BPT) diagrams. Left panel: [N II]/Hα vs. [O III]/Hβ BPT diagram showing the location of AGN1317 (yellow triangle). We adopted the classification of the galaxies in H II-region-like, composite AGN-H II types, and AGN according to Kewley et al. (2006). The Kewley et al. (2001) extreme starburst line and the Kauffmann et al. (2003) pure star formation line are shown as the solid and dashed lines, respectively. Right panel: same as the left panel for the [S II]/Hα vs. [O III]/Hβ BPT diagram. We adopted the classification of the galaxies in H II-region-like, Seyferts, and LINERs according to Kewley et al. (2006). The Kewley et al. (2001) extreme starburst line and the Kewley et al. (2006) Seyfert-LINER line are shown as the solid and dashed lines, respectively. |
The protocluster galaxy AGN1354 with the detection of Hα, Hβ , and [N II]λ 6583Å lines (see Table A.1) might be placed in the BPT diagram (left panel of Fig. 8) by estimating an upper limit for the [O III]λ 5007Å line. Unfortunately, Hα and [N II]λ 6583Å lines are superimposed to the sky-emission in the spectrum of AGN1354 (see Table 1).
7. Comparison with theoretical predictions
The comparison between the observations and the predictions of semi-analytic models (SAMs) that include AGN growth can help us to understand the main physical processes that drive the formation and fuel BHs. The AGN frequency is expected to depend quite strongly on the environment, with factors such as the local galaxy density and one-on-one interactions (e.g., Pentericci et al. 2013; Sabater et al. 2013).
There are two main modes of AGN growth and feedback in these models: the quasars mode, and the radio mode. The quasar mode applies to BH growth during gas-rich mergers where the central BH of the main progenitor grows both by absorbing the central BH of the minor progenitor and by accreting the cold gas. This mode corresponds to high-luminosity AGN, which accrete at near their Eddington ratio, and which therefore are subject to a wind. In the radio mode, quiescent hot gas is accreted onto the central super-massive BH, and this accretion comes from the surrounding hot halo. The radio mode corresponds to low-luminosity AGN, typically well below the Eddington rate, that emit a radio jet. This model captures the mean behavior of the BH on timescales much longer than the duty cycle.
We considered two different SAMs: the model of Menci et al. (2004; hereafter M 04), and the model implemented in the Millennium Simulations (MS) as in Guo et al. (2011). In model M 04, which is based on the quasar mode, the accretion of gas onto the central BH is triggered by galaxy encounters that do not necessarily lead to bound mergers in common host structures such as clusters and especially groups. These events destabilize part of the galactic cold gas and thus feed the central BH, following the physical modeling developed by Cavaliere & Vittorini (2000). This model finds that at high redshift, while the protogalaxies grow rapidly by hierarchical merging, fresh gas is imported, and the BHs are fueled at their full Eddington rates. At lower redshift, the dominant dynamical events are galaxy encounters in hierarchically growing groups. At this point, refueling diminishes as the residual gas is exhausted, and the destabilizing also decreases.
In the MS model for BH growth and AGN feedback, Guo et al. (2011) followed Croton et al. (2006), who implemented both quasar mode and radio mode. In the quasar mode, BH accretion is allowed during both major and minor mergers, but the efficiency in the latter is lower because the mass accreted during a merger depends on various factors, including the ratio between the mass of a member and that of the central cluster galaxy. In the radio mode, the growth of the SMBH is the result of continuous hot gas accretion once a static hot halo has formed around the host galaxy of the BH. This accretion is assumed to be continual and quiescent (see Croton et al. 2006, for details).
The high AGN fraction characterizing protocluster 7C 1756+6520 seems to be more consistent with the predictions of the MS model. This model predicts a steep increase in the AGN fraction with redshift, both in groups and in clusters (see, e.g., Fig. 4 in Pentericci et al. 2013), which is linked to the marked rise of major mergers, which are the only mergers considered for the quasar mode, toward high redshifts. Conversely, the M 04 model predicts a milder increase in AGN fraction with redshift because in this model, minor mergers and close encounters are also very important, and their frequency does not depend very strongly on redshift, since small dark matter halos continue to merge frequently until low redshift. The better agreement with the MS model would validate the implemented mode of AGN growth in the model, and in particular would stress the importance of galaxy encounters, not necessarily leading to mergers, as an efficient AGN triggering mechanism. However, we recall that the model M 04 successfully reproduces the observed properties of both galaxies and AGN across a wide redshift range (z ~ 0−4, e.g., Fontana et al. 2006; Menci et al. 2008; Calura & Menci 2009; Lamastra et al. 2010).
In addition to the galaxy mergers, the ram pressure may also induce AGN activity together to star formation in cluster galaxies (e.g., Poggianti et al. 2017; Marshall et al. 2018; Ramos-Martínez et al. 2018). The ram pressure, acting on galaxies in a galaxy cluster moving through the intra-cluster medium (ICM), can strip (ram pressure stripping) gas out of the galaxy where the gas is gravitationally bound to the galaxy less strongly than the force from the ICM medium wind due to the ram pressure. A typical effect of the ram pressure stripping is the formation of long tails of stripped gas behind galaxies. A good example of this effect is the Virgo cluster, the closest rich galaxy cluster, considered a ram pressure stripping laboratory since a number of clearly ram pressure stripped galaxies have been observed (e.g., Kenney et al. 2004; Crowl et al. 2005; Chung et al. 2007). Another example of long tails of stripped gas is the Norma cluster (Abell 3627), containing a very extended multi-phase gas stripped tail of a late-type galaxy (ESO137-001 Sun et al. 2007, 2010). In the literature, there is an open debate on the role of the ram pressure stripping on the AGN activity. Observations suggest that ram-pressure stripping tends to produce a decreasing of the radiative-mode AGN activity in the centres of clusters with respect to low density regions (e.g., Ellison et al. 2011; Ehlert et al. 2014; Khabiboulline et al. 2014). This happens because the ram pressure has depleted the gas supply of the central galaxies. However, models and hydrodynamical simulations show that a moderate ram pressure is also able to compress the gas in the galaxy and trigger star formation (e.g., Fujita & Nagashima 1999; Kronberger et al. 2008; Kapferer et al. 2009; Tonnesen & Bryan 2009; Bekki 2014). This effect, produced by a low level of ram pressure, is observationally supported (e.g., Lee et al. 2017). Moderate ram pressure can also produce the removal of angular momentum from the disk gas (Tonnesen & Bryan 2009), producing gravitational instability in the galactic disk (Schulz & Struck 2001) and consequentially the gas fueling towards the central AGN.
Very recently, Marshall et al. (2018) have modelled the triggering of AGN in galaxy clusters focusing on the effect of ram pressure on gas-rich galaxies. They find that below the regime of ram pressure stripping the enhanced pressure might produce a higher star formation and trigger the AGN activity. Marshall et al. (2018) test this effect with a SAM based on the MS and compared it to an observational sample of galaxies in low- and high-redshift clusters. They find that that the phase-space properties of observed AGN populations are consistent with a triggering scenario for intermediate ram pressures (Pram), 2.5 × 10⁻¹⁴ < Pram < 2.5 × 10⁻¹³ (see Marshall et al. 2018, for details). This ram pressure range corresponds to ram pressures expected around the virial radius in low-redshift galaxy clusters and at smaller radii in high-redshift ones (see Fig. 6 in Marshall et al. 2018). The observational AGN fractions show a slower decreasing with radius than the z = 1 model of Marshall et al. (2018), while the location of the peak is consistent with the model (see Fig. 9 in Marshall et al. 2018). The observations also show a second peak in the distribution of AGN fractions with radius, which is absent in the z = 1 model of Marshall et al. (2018). For protocluster 7C 1756+6520, this model would mean that 4 of the 7 AGN are located within ~0.5 × rvir (see Fig. 7), which appears to be in agreement with the first peak of the radial distribution of the AGN fractions predicted by Marshall et al. (2018) and observed by Martini et al. (2009). The definition of an outer AGN peak and of a trend at larger radii is prevented by the small number of protocluster members identified so far (31). Following Martini et al. (2009), we conclude that the basic comparison of our sample and other samples of AGN belonging to high-redshift clusters shows that the ram pressure triggering model is at least broadly consistent with the observations.
8. Summary and conclusions
We presented new near-IR LBT observations of galaxies belonging to the field of the protocluster that is associated with the radio galaxy 7C 1756+6520 at z = 1.4156. We observed the central part of the protocluster, including the radio galaxy, three spectroscopically confirmed AGN, and other objects that are possible protocluster members. We also presented an analysis dedicated to the AGN population identified within the protocluster. Our main conclusions are listed below.
-
Most of the redshift identification is based on the detection of the Hα, Hβ, and [O III]λ 5007 Å emission lines. For four galaxies that were previously targeted as protocluster members, we derived the redshift by detecting emission lines that have never been detected before. We identified a new protcluster member, by detecting the Hα and [O III]λ 5007 Å emission lines, and eight new possible protocluster members by assuming that the only detected emission line is the [O III]λ 5007 Å or the Hβ line. If the emission-line assignation is correct, these galaxies should belong to the redshift range of z ~ 1.38−1.43. The stacked spectrum of the possible protocluster members in which we detected the [O III]λ 5007 Å emission line revealed the second line of the [O III]λ doublet at 4959 Å and of Hβ, which confirms that they belong to the protocluster.
-
By merging the spectroscopically confirmed protocluster members derived from this work, G 10, and M 12, 31 galaxies, including the central radio galaxy, are found around redshift 1.4152 ± 0.056. This corresponds to peculiar velocities ≲5000 km s−1 with respect to the radio galaxy. The velocity dispersion of the sources within 2 Mpc from the radio galaxy is σcl ~ 1700 ± 120 km s−1.
-
Based on the identified 31 proto-cluster members, the redshift distribution could be described by a Gaussian function with respect to the main peak at z ~ 1.42. The application of the robust statistical DS test shows that we are not able to define the presence of substructures within the protocluster.
-
The phase-space diagram shows that three AGN are located in the region at low velocity and small radii, which together with the central radio galaxy corresponds to galaxies with a high probability to be a virialized population that has been part of the overdensity for a long time.
-
A peculiar property of this protocluster is its AGN fraction, which at 23% is higher than what typically characterizes low-, moderate-, and high-redshift clusters. The high AGN fraction and the distribution of the AGN within the protocluster is broadly consistent with predictions of some theoretical models on the AGN feedback, based on galaxy interactions and ram pressure.
-
By combining our observations with other available observations, we confirmed for the first time through the BPT diagrams that AGN1317 hosts an AGN.
We plan to analyze high-resolution (1.5 and 5 mas) radio data (at 6 and 8 cm) of the central HzRG that we have already acquired with the EVN (European VLBI5 Network) and e-MERLIN/VLBI facilities. These observations have been motivated by the evidence that HzRGs in the center of clusters are the probable ancestors of the brightest cluster galaxies (BCGs). BCGs are objects that are typically located at the center of clusters and are considered the most luminous, massive, and extended sources in the Universe. Because of the dominant role inside clusters and the peculiar multiwavelength properties of the BCGs, the evolution of these objects through cosmic time is particularly interesting. These centimeter observations will allow us to establish the radio structure and properties of the HzRG, identify its core and resolve the components that have been detected with the Very Large Array. It will also allow us to map the subarcsecond-scale emission with a simultaneous multi-frequency space-resolved spectral analysis and connect the radio emission at all angular scales. We furthermore plan to propose new NIR observations to complete the data presented here in order to clearly determine the spectroscopic redshift of the possible cluster members found so far and to search for new members.
More details can be found at https://www.iasf-milano.inaf.it/Research/lbt_rg.html
IRAF is the Image Reduction and Analysis Facility. IRAF is written and supported by the National Optical Astronomy Observatories (NOAO) in Tucson, Arizona. NOAO is operated by the Association of Universities for Research in Astronomy (AURA), Inc. under cooperative agreement with the National Science Foundation.
Acknowledgments
We are grateful to the anonymous referee, whose comments and suggestions greatly improved the quality of this manuscript. V. C. acknowledges the DustPedia financial support. DustPedia is a collaborative focused research project supported by the European Union under the Seventh Framework Programme (2007–2013) call (proposal No. 606824). The participating institutions are: Cardiff University, UK; National Observatory of Athens, Greece; Ghent University, Belgium; Université Paris Sud, France; National Institute for Astrophysics, Italy and CEA (Paris), France. J. F. acknowledges the financial support from UNAM-DGAPA-PAPIIT IA104015 grant, Mexico. This research has made use of the SIMBAD database, operated at CDS, Strasbourg, France (Wenger et al. 2000). This research has made use of the NASA/IPAC Extragalactic Database (NED) which is operated by the Jet Propulsion Laboratory, California Institute of Technology, under contract with the National Aeronautics and Space Administration. The authors thank A. Galametz for making available the B-band image of the field around the radio galaxy 7C 1756+6520, which has previously been used in Casasola et al. (2013).
References
- Ageorges, N., Seifert, W., Jütte, M., et al. 2010, Proc. SPIE, 7735, 77351L [CrossRef] [Google Scholar]
- Aird, J., Coil, A. L., Moustakas, J., et al. 2012, ApJ, 746, 90 [NASA ADS] [CrossRef] [Google Scholar]
- Alonso-Herrero, A., Pérez-González, P. G., Rieke, G. H., et al. 2008, ApJ, 677, 127 [NASA ADS] [CrossRef] [Google Scholar]
- Arnaud, M. 2009, A&A, 500, 103 [NASA ADS] [CrossRef] [EDP Sciences] [Google Scholar]
- Arnold, T. J., Martini, P., Mulchaey, J. S., Berti, A., & Jeltema, T. E. 2009, ApJ, 707, 1691 [Google Scholar]
- Baldwin, J. A., Phillips, M. M., & Terlevich, R. 1981, PASP, 93, 5 [NASA ADS] [CrossRef] [EDP Sciences] [Google Scholar]
- Barger, A. J., Cowie, L. L., Mushotzky, R. F., et al. 2005, AJ, 129, 578 [NASA ADS] [CrossRef] [Google Scholar]
- Barnes, J. E., & Hernquist, L. 1992, ARA&A, 30, 705 [NASA ADS] [CrossRef] [Google Scholar]
- Beers, T. C., Flynn, K., & Gebhardt, K. 1990, AJ, 100, 32 [NASA ADS] [CrossRef] [Google Scholar]
- Bekki, K. 2014, MNRAS, 438, 444 [NASA ADS] [CrossRef] [Google Scholar]
- Best, P. N. 2004, MNRAS, 351, 70 [NASA ADS] [CrossRef] [Google Scholar]
- Best, P. N., van Dokkum, P. G., Franx, M., & Röttgering, H. J. A. 2002, MNRAS, 330, 17 [NASA ADS] [CrossRef] [Google Scholar]
- Best, P. N., Lehnert, M. D., Miley, G. K., & Röttgering, H. J. A. 2003, MNRAS, 343, 1 [NASA ADS] [CrossRef] [Google Scholar]
- Borgani, S., Girardi, M., Carlberg, R. G., Yee, H. K. C., & Ellingson, E. 1999, ApJ, 527, 561 [NASA ADS] [CrossRef] [Google Scholar]
- Boyle, B. J., Georgantopoulos, I., Blair, A. J., et al. 1998, MNRAS, 296, 1 [NASA ADS] [CrossRef] [Google Scholar]
- Bundy, K., Georgakakis, A., Nandra, K., et al. 2008, ApJ, 681, 931 [NASA ADS] [CrossRef] [Google Scholar]
- Calura, F., & Menci, N. 2009, MNRAS, 400, 1347 [NASA ADS] [CrossRef] [Google Scholar]
- Carilli, C. L., & Walter, F. 2013, ARA&A, 51, 105 [NASA ADS] [CrossRef] [EDP Sciences] [Google Scholar]
- Carilli, C. L., Harris, D. E., Pentericci, L., et al. 2002, ApJ, 567, 781 [NASA ADS] [CrossRef] [Google Scholar]
- Cappi, M., Mazzotta, P., Elvis, M., et al. 2001, ApJ, 548, 624 [NASA ADS] [CrossRef] [Google Scholar]
- Casasola, V., Combes, F., García-Burillo, S., et al. 2008, A&A, 490, 61 [NASA ADS] [CrossRef] [EDP Sciences] [Google Scholar]
- Casasola, V., Hunt, L. K., Combes, F., García-Burillo, S., & Neri, R. 2011, A&A, 527, A92 [NASA ADS] [CrossRef] [EDP Sciences] [Google Scholar]
- Casasola, V., Magrini, L., Combes, F., et al. 2013, A&A, 558, A60 [NASA ADS] [CrossRef] [EDP Sciences] [Google Scholar]
- Casey, C. M. 2016, ApJ, 824, 36 [NASA ADS] [CrossRef] [EDP Sciences] [Google Scholar]
- Castignani, G., Combes, F., Salomé, P., et al. 2018, A&A, 617, A103 [NASA ADS] [CrossRef] [EDP Sciences] [Google Scholar]
- Cavaliere, A., & Vittorini, V. 2000, ApJ, 543, 599 [NASA ADS] [CrossRef] [Google Scholar]
- Chan, J. C. C., Beifiori, A., Mendel, J. T., et al. 2016, MNRAS, 458, 3181 [NASA ADS] [CrossRef] [Google Scholar]
- Chung, A., van Gorkom, J. H., Kenney, J. D. P., & Vollmer, B. 2007, ApJ, 659, L115 [NASA ADS] [CrossRef] [Google Scholar]
- Combes, F., García-Burillo, S., Casasola, V., et al. 2013, A&A, 558, A124 [NASA ADS] [CrossRef] [EDP Sciences] [Google Scholar]
- Cooke, E. A., Hatch, N. A., Stern, D., et al. 2016, ApJ, 816, 83 [NASA ADS] [CrossRef] [Google Scholar]
- Cowie, L. L., & Songaila, A. 1977, Nature, 266, 501 [Google Scholar]
- Croft, S., Kurk, J., van Breugel, W., et al. 2005, AJ, 130, 867 [NASA ADS] [CrossRef] [Google Scholar]
- Croton, D. J., Springel, V., White, S. D. M., et al. 2006, MNRAS, 365, 11 [NASA ADS] [CrossRef] [Google Scholar]
- Crowl, H. H., Kenney, J. D. P., van Gorkom, J. H., & Vollmer, B. 2005, AJ, 130, 65 [NASA ADS] [CrossRef] [Google Scholar]
- Danese, L., de Zotti, G., & di Tullio, G. 1980, A&A, 82, 322 [NASA ADS] [Google Scholar]
- Dannerbauer, H., Kurk, J. D., De Breuck, C., et al. 2014, A&A, 570, A55 [NASA ADS] [CrossRef] [EDP Sciences] [Google Scholar]
- Dannerbauer, H., Lehnert, M. D., Emonts, B., et al. 2017, A&A, 608, A48 [NASA ADS] [CrossRef] [EDP Sciences] [Google Scholar]
- Deng, X.-F., Xin, Y., Wu, P., et al. 2012, Astron. Nachr., 333, 767 [NASA ADS] [CrossRef] [Google Scholar]
- Doherty, M., Tanaka, M., De Breuck, C., et al. 2010, A&A, 509, A83 [NASA ADS] [CrossRef] [EDP Sciences] [Google Scholar]
- Dressler, A. 1980, ApJ, 236, 351 [NASA ADS] [CrossRef] [Google Scholar]
- Dressler, A., & Gunn, J. E. 1983, ApJ, 270, 7 [NASA ADS] [CrossRef] [Google Scholar]
- Dressler, A., & Shectman, S. A. 1988, AJ, 95, 985 [NASA ADS] [CrossRef] [Google Scholar]
- Dressler, A., Thompson, I. B., & Shectman, S. A. 1985, ApJ, 288, 481 [NASA ADS] [CrossRef] [Google Scholar]
- Dressler, A., Smail, I., Poggianti, B. M., et al. 1999, ApJS, 122, 51 [NASA ADS] [CrossRef] [Google Scholar]
- Eastman, J., Martini, P., Sivakoff, G., et al. 2007, ApJ, 664, L9 [NASA ADS] [CrossRef] [Google Scholar]
- Ehlert, S., von der Linden, A., Allen, S. W., et al. 2014, MNRAS, 437, 1942 [NASA ADS] [CrossRef] [Google Scholar]
- Eisenhardt, P. R. M., Brodwin, M., Gonzalez, A. H., et al. 2008, ApJ, 684, 905 [NASA ADS] [CrossRef] [Google Scholar]
- Elbaz, D., Daddi, E., Le Borgne, D., et al. 2007, A&A, 468, 33 [NASA ADS] [CrossRef] [EDP Sciences] [Google Scholar]
- Ellison, S. L., Patton, D. R., Mendel, J. T., & Scudder, J. M. 2011, MNRAS, 418, 2043 [NASA ADS] [CrossRef] [Google Scholar]
- Emonts, B. H. C., Norris, R. P., Feain, I., et al. 2014, MNRAS, 438, 2898 [NASA ADS] [CrossRef] [Google Scholar]
- Farouki, R., & Shapiro, S. L. 1981, ApJ, 243, 32 [NASA ADS] [CrossRef] [Google Scholar]
- Fasano, G., & Franceschini, A. 1987, MNRAS, 225, 155 [NASA ADS] [CrossRef] [Google Scholar]
- Fassbender, R., Šuhada, R., & Nastasi, A. 2012, Adv. Astron., 2012, 138380 [NASA ADS] [CrossRef] [Google Scholar]
- Fassbender, R., Nastasi, A., Santos, J. S., et al. 2014, A&A, 568, A5 [NASA ADS] [CrossRef] [EDP Sciences] [Google Scholar]
- Finn, R. A., Zaritsky, D., McCarthy, D. W., Jr., et al. 2005, ApJ, 630, 206 [NASA ADS] [CrossRef] [Google Scholar]
- Fisher, D., Fabricant, D., Franx, M., & van Dokkum, P. 1998, ApJ, 498, 195 [NASA ADS] [CrossRef] [Google Scholar]
- Fontana, A., Salimbeni, S., Grazian, A., et al. 2006, A&A, 459, 745 [NASA ADS] [CrossRef] [EDP Sciences] [Google Scholar]
- Franceschini, A., Hasinger, G., Miyaji, T., & Malquori, D. 1999, MNRAS, 310, L5 [NASA ADS] [CrossRef] [Google Scholar]
- Franck, J. R., McGaugh, S. S., & Schombert, J. M. 2015, AJ, 150, 46 [NASA ADS] [CrossRef] [Google Scholar]
- Fujita, Y., & Nagashima, M. 1999, ApJ, 516, 619 [NASA ADS] [CrossRef] [Google Scholar]
- Galametz, A., De Breuck, C., Vernet, J., et al. 2009a, A&A, 507, 131 [NASA ADS] [CrossRef] [EDP Sciences] [Google Scholar]
- Galametz, A., Stern, D., Eisenhardt, P. R. M., et al. 2009b, ApJ, 694, 1309 [NASA ADS] [CrossRef] [Google Scholar]
- Galametz, A., Stern, D., Stanford, S. A., et al. 2010, A&A, 516, A101 (G 10) [NASA ADS] [CrossRef] [EDP Sciences] [Google Scholar]
- García-Burillo, S., Combes, F., Usero, A., et al. 2014, A&A, 567, A125 [NASA ADS] [CrossRef] [EDP Sciences] [Google Scholar]
- Geller, M. J., & Beers, T. C. 1982, PASP, 94, 421 [NASA ADS] [CrossRef] [Google Scholar]
- Gill, S. P. D., Knebe, A., & Gibson, B. K. 2005, MNRAS, 356, 1327 [NASA ADS] [CrossRef] [Google Scholar]
- Giovanelli, R., & Haynes, M. P. 1985, ApJ, 292, 404 [CrossRef] [Google Scholar]
- Gisler, G. R. 1978, MNRAS, 183, 633 [NASA ADS] [CrossRef] [Google Scholar]
- Gladders, M. D., & Yee, H. K. C. 2000, AJ, 120, 2148 [NASA ADS] [CrossRef] [Google Scholar]
- Greve, T. R., Bertoldi, F., Smail, I., et al. 2005, MNRAS, 359, 1165 [NASA ADS] [CrossRef] [Google Scholar]
- Gunn, J. E., & Gott, J. R., III 1972, ApJ, 176, 1 [NASA ADS] [CrossRef] [Google Scholar]
- Guo, Q., White, S., Boylan-Kolchin, M., et al. 2011, MNRAS, 413, 101 [NASA ADS] [CrossRef] [Google Scholar]
- Haehnelt, M. G., & Kauffmann, G. 2000, MNRAS, 318, L35 [NASA ADS] [CrossRef] [Google Scholar]
- Haggard, D., Green, P. J., Anderson, S. F., et al. 2010, ApJ, 723, 1447 [NASA ADS] [CrossRef] [Google Scholar]
- Haines, C. P., Smith, G. P., Egami, E., et al. 2009, ApJ, 704, 126 [NASA ADS] [CrossRef] [Google Scholar]
- Haines, C. P., Pereira, M. J., Sanderson, A. J. R., et al. 2012, ApJ, 754, 97 [NASA ADS] [CrossRef] [Google Scholar]
- Haines, C. P., Pereira, M. J., Smith, G. P., et al. 2015, ApJ, 806, 101 [NASA ADS] [CrossRef] [Google Scholar]
- Halliday, C., Milvang-Jensen, B., Poirier, S., et al. 2004, A&A, 427, 397 [NASA ADS] [CrossRef] [EDP Sciences] [Google Scholar]
- Hasinger, G., Miyaji, T., & Schmidt, M. 2005, A&A, 441, 417 [NASA ADS] [CrossRef] [EDP Sciences] [Google Scholar]
- Hayashi, M., Kodama, T., Koyama, Y., et al. 2010, MNRAS, 402, 1980 [NASA ADS] [CrossRef] [Google Scholar]
- Hayashi, M., Kodama, T., Koyama, Y., et al. 2014, MNRAS, 439, 2571 [NASA ADS] [CrossRef] [Google Scholar]
- Hayashi, M., Tadaki, K.-I., Kodama, T., et al. 2018, ApJ, 856, 118 [NASA ADS] [CrossRef] [Google Scholar]
- Heckman, T. M., Kauffmann, G., Brinchmann, J., et al. 2004, ApJ, 613, 109 [NASA ADS] [CrossRef] [Google Scholar]
- Hernández-Fernández, J. D., Haines, C. P., Diaferio, A., et al. 2014, MNRAS, 438, 2186 [NASA ADS] [CrossRef] [Google Scholar]
- Hill, J. M., Green, R. F., & Slagle, J. H. 2006, Proc. SPIE, 6267, 62670Y [Google Scholar]
- Hilton, M., Collins, C. A., Stanford, S. A., et al. 2007, ApJ, 670, 1000 [NASA ADS] [CrossRef] [Google Scholar]
- Huchra, J., & Burg, R. 1992, ApJ, 393, 90 [NASA ADS] [CrossRef] [Google Scholar]
- Hunt, L., Magrini, L., Galli, D., et al. 2012, MNRAS, 427, 906 [NASA ADS] [CrossRef] [Google Scholar]
- Hunt, L., Dayal, P., Magrini, L., & Ferrara, A. 2016, MNRAS, 463, 2002 [NASA ADS] [CrossRef] [Google Scholar]
- Jaffé, Y. L., Smith, R., Candlish, G. N., et al. 2015, MNRAS, 448, 1715 [NASA ADS] [CrossRef] [Google Scholar]
- Jaffé, Y. L., Poggianti, B. M., Moretti, A., et al. 2018, MNRAS, 476, 4753 [NASA ADS] [CrossRef] [Google Scholar]
- Kapferer, W., Sluka, C., Schindler, S., Ferrari, C., & Ziegler, B. 2009, A&A, 499, 87 [NASA ADS] [CrossRef] [EDP Sciences] [Google Scholar]
- Kauffmann, G., Heckman, T. M., Tremonti, C., et al. 2003, MNRAS, 346, 1055 [Google Scholar]
- Kauffmann, G., White, S. D. M., Heckman, T. M., et al. 2004, MNRAS, 353, 713 [NASA ADS] [CrossRef] [Google Scholar]
- Kenney, J. D. P., van Gorkom, J. H., & Vollmer, B. 2004, AJ, 127, 3361 [NASA ADS] [CrossRef] [Google Scholar]
- Kewley, L. J., Dopita, M. A., Sutherland, R. S., Heisler, C. A., & Trevena, J. 2001, ApJ, 556, 121 [Google Scholar]
- Kewley, L. J., Groves, B., Kauffmann, G., & Heckman, T. 2006, MNRAS, 372, 961 [NASA ADS] [CrossRef] [Google Scholar]
- Khabiboulline, E. T., Steinhardt, C. L., Silverman, J. D., et al. 2014, ApJ, 795, 62 [NASA ADS] [CrossRef] [Google Scholar]
- Kodama, T., Tanaka, I., Kajisawa, M., et al. 2007, MNRAS, 377, 1717 [NASA ADS] [CrossRef] [Google Scholar]
- Koester, B. P., McKay, T. A., Annis, J., et al. 2007, ApJ, 660, 239 [NASA ADS] [CrossRef] [Google Scholar]
- Koyama, Y., Kodama, T., Tadaki, K.-i., et al. 2013, MNRAS, 428, 1551 [CrossRef] [Google Scholar]
- Kronberger, T., Kapferer, W., Ferrari, C., Unterguggenberger, S., & Schindler, S. 2008, A&A, 481, 337 [NASA ADS] [CrossRef] [EDP Sciences] [Google Scholar]
- Kurk, J. D., Röttgering, H. J. A., Pentericci, L., et al. 2000, A&A, 358, L1 [NASA ADS] [Google Scholar]
- Kurk, J. D., Pentericci, L., Röttgering, H. J. A., & Miley, G. K. 2004a, A&A, 428, 793 [NASA ADS] [CrossRef] [EDP Sciences] [Google Scholar]
- Kurk, J. D., Pentericci, L., Overzier, R. A., Röttgering, H. J. A., & Miley, G. K. 2004b, A&A, 428, 817 [NASA ADS] [CrossRef] [EDP Sciences] [Google Scholar]
- Lacy, M., Rawlings, S., Hill, G. J., et al. 1999, MNRAS, 308, 1096 [NASA ADS] [CrossRef] [Google Scholar]
- Lacy, M., Storrie-Lombardi, L. J., Sajina, A., et al. 2004, ApJS, 154, 166 [NASA ADS] [CrossRef] [Google Scholar]
- Lamastra, A., Menci, N., Maiolino, R., Fiore, F., & Merloni, A. 2010, MNRAS, 405, 29 [NASA ADS] [Google Scholar]
- Lamer, G., Hoeft, M., Kohnert, J., Schwope, A., & Storm, J. 2008, A&A, 487, L33 [NASA ADS] [CrossRef] [EDP Sciences] [Google Scholar]
- Larson, R. B., Tinsley, B. M., & Caldwell, C. N. 1980, ApJ, 237, 692 [NASA ADS] [CrossRef] [Google Scholar]
- Lawrence, A., Warren, S. J., Almaini, O., et al. 2007, MNRAS, 379, 1599 [NASA ADS] [CrossRef] [MathSciNet] [Google Scholar]
- Lee, B., Chung, A., Tonnesen, S., et al. 2017, MNRAS, 466, 1382 [NASA ADS] [CrossRef] [Google Scholar]
- Lee-Brown, D. B., Rudnick, G. H., Momcheva, I. G., et al. 2017, ApJ, 844, 43 [NASA ADS] [CrossRef] [Google Scholar]
- Lidman, C., Rosati, P., Tanaka, M., et al. 2008, A&A, 489, 981 [NASA ADS] [CrossRef] [EDP Sciences] [Google Scholar]
- Lubin, L. M., Oke, J. B., & Postman, M. 2002, AJ, 124, 1905 [NASA ADS] [CrossRef] [Google Scholar]
- Magrini, L., Sommariva, V., Cresci, G., et al. 2012a, MNRAS, 426, 1195 (M 12) [NASA ADS] [CrossRef] [Google Scholar]
- Magrini, L., Hunt, L., Galli, D., et al. 2012b, MNRAS, 427, 1075 [NASA ADS] [CrossRef] [Google Scholar]
- Mannucci, F., Cresci, G., Maiolino, R., et al. 2009, MNRAS, 398, 1915 [NASA ADS] [CrossRef] [Google Scholar]
- Mannucci, F., Cresci, G., Maiolino, R., Marconi, A., & Gnerucci, A. 2010, MNRAS, 408, 2115 [NASA ADS] [CrossRef] [Google Scholar]
- Marshall, M. A., Shabala, S. S., Krause, M. G. H., et al. 2018, MNRAS, 474, 3615 [NASA ADS] [CrossRef] [Google Scholar]
- Martini, P., Kelson, D. D., Kim, E., Mulchaey, J. S., & Athey, A. A. 2006, ApJ, 644, 116 [NASA ADS] [CrossRef] [Google Scholar]
- Martini, P., Mulchaey, J. S., & Kelson, D. D. 2007, ApJ, 664, 761 [NASA ADS] [CrossRef] [EDP Sciences] [Google Scholar]
- Martini, P., Sivakoff, G. R., & Mulchaey, J. S. 2009, ApJ, 701, 66 [NASA ADS] [CrossRef] [Google Scholar]
- Martini, P., Miller, E. D., Brodwin, M., et al. 2013, ApJ, 768, 1 [Google Scholar]
- Marziani, P., D’Onofrio, M., Bettoni, D., et al. 2017, A&A, 599, A83 [NASA ADS] [CrossRef] [EDP Sciences] [Google Scholar]
- Menci, N., Fiore, F., Perola, G. C., & Cavaliere, A. 2004, ApJ, 606, 58 [NASA ADS] [CrossRef] [Google Scholar]
- Menci, N., Rosati, P., Gobat, R., et al. 2008, ApJ, 685, 863 [NASA ADS] [CrossRef] [Google Scholar]
- Merloni, A., Rudnick, G., & Di Matteo, T. 2004, MNRAS, 354, L37 [NASA ADS] [CrossRef] [Google Scholar]
- Merritt, D. 1983, ApJ, 264, 24 [NASA ADS] [CrossRef] [Google Scholar]
- Miley, G. K., Overzier, R. A., Tsvetanov, Z. I., et al. 2004, Nature, 427, 47 [NASA ADS] [CrossRef] [PubMed] [Google Scholar]
- Milvang-Jensen, B., Noll, S., Halliday, C., et al. 2008, A&A, 482, 419 [NASA ADS] [CrossRef] [EDP Sciences] [Google Scholar]
- Molnar, S. M., Hughes, J. P., Donahue, M., & Joy, M. 2002, ApJ, 573, L91 [NASA ADS] [CrossRef] [Google Scholar]
- Moore, B., Katz, N., Lake, G., Dressler, A., & Oemler, A. 1996, Nature, 379, 613 [NASA ADS] [CrossRef] [Google Scholar]
- Mullis, C. R., Rosati, P., Lamer, G., et al. 2005, ApJ, 623, L85 [NASA ADS] [CrossRef] [Google Scholar]
- Noble, A. G., Webb, T. M. A., Yee, H. K. C., et al. 2016, ApJ, 816, 48 [NASA ADS] [CrossRef] [Google Scholar]
- Noble, A. G., McDonald, M., Muzzin, A., et al. 2017, ApJ, 842, L21 [Google Scholar]
- Noirot, G., Vernet, J., De Breuck, C., et al. 2016, ApJ, 830, 90 [NASA ADS] [CrossRef] [Google Scholar]
- Noirot, G., Stern, D., Mei, S., et al. 2018, ApJ, 859, 38 [NASA ADS] [CrossRef] [Google Scholar]
- Osterbrock, D. E., & Ferland, G. J. 2006, in Astrophysics of Gaseous Nebulae and Active Galactic Nuclei, 2nd edn., (Sausalito, CA: University Science Books) [Google Scholar]
- Overzier, R. A., Harris, D. E., Carilli, C. L., et al. 2005, A&A, 433, 87 [NASA ADS] [CrossRef] [EDP Sciences] [Google Scholar]
- Overzier, R. A., Bouwens, R. J., Cross, N. J. G., et al. 2008, ApJ, 673, 143 [NASA ADS] [CrossRef] [Google Scholar]
- Papovich, C. 2008, ApJ, 676, 206 [NASA ADS] [CrossRef] [Google Scholar]
- Pentericci, L., Röttgering, H. J. A., Miley, G. K., et al. 1998, ApJ, 504, 139 [NASA ADS] [CrossRef] [Google Scholar]
- Pentericci, L., Kurk, J. D., Röttgering, H. J. A., et al. 2000, A&A, 361, L25 [NASA ADS] [Google Scholar]
- Pentericci, L., Kurk, J. D., Carilli, C. L., et al. 2002, A&A, 396, 109 [NASA ADS] [CrossRef] [EDP Sciences] [Google Scholar]
- Pentericci, L., Castellano, M., Menci, N., et al. 2013, A&A, 552, A111 [Google Scholar]
- Poggianti, B. M., von der Linden, A., De Lucia, G., et al. 2006, ApJ, 642, 188 [NASA ADS] [CrossRef] [Google Scholar]
- Poggianti, B. M., Jaffé, Y. L., Moretti, A., et al. 2017, Nature, 548, 304 [NASA ADS] [CrossRef] [Google Scholar]
- Popesso, P., & Biviano, A. 2006, A&A, 460, L23 [NASA ADS] [CrossRef] [EDP Sciences] [Google Scholar]
- Ramos-Martínez, M., Gómez, G. C., & Pérez-Villegas, Á. 2018, MNRAS, 476, 3781 [NASA ADS] [CrossRef] [Google Scholar]
- Rawlings, S. 2003, New Astron. Rev., 47, 397 [NASA ADS] [CrossRef] [Google Scholar]
- Renzini, A. 2006, ARA&A, 44, 141 [NASA ADS] [CrossRef] [Google Scholar]
- Rhee, J., Smith, R., Choi, H., et al. 2017, ApJ, 843, 128 [NASA ADS] [CrossRef] [Google Scholar]
- Richstone, D. O. 1976, ApJ, 204, 642 [NASA ADS] [CrossRef] [Google Scholar]
- Rigby, E. E., Hatch, N. A., Röttgering, H. J. A., et al. 2014, MNRAS, 437, 1882 [NASA ADS] [CrossRef] [Google Scholar]
- Rosati, P., Borgani, S., & Norman, C. 2002, ARA&A, 40, 539 [NASA ADS] [CrossRef] [Google Scholar]
- Rosati, P., Tozzi, P., Gobat, R., et al. 2009, A&A, 508, 583 [NASA ADS] [CrossRef] [EDP Sciences] [Google Scholar]
- Rudnick, G., Hodge, J., Walter, F., et al. 2017, ApJ, 849, 27 [NASA ADS] [CrossRef] [Google Scholar]
- Rumbaugh, N., Kocevski, D. D., Gal, R. R., et al. 2012, ApJ, 746, 155 [NASA ADS] [CrossRef] [Google Scholar]
- Sabater, J., Best, P. N., & Argudo-Fernández, M. 2013, MNRAS, 430, 638 [NASA ADS] [CrossRef] [Google Scholar]
- Schulz, S., & Struck, C. 2001, MNRAS, 328, 185 [NASA ADS] [CrossRef] [Google Scholar]
- Scodeggio, M., Franzetti, P., Garilli, B., et al. 2005, PASP, 117, 1284 [NASA ADS] [CrossRef] [Google Scholar]
- Seifert, W., Ageorges, N., Lehmitz, M., et al. 2010, Proc. SPIE, 7735, 77357W [CrossRef] [Google Scholar]
- Seymour, N., Stern, D., De Breuck, C., et al. 2007, ApJS, 171, 353 [NASA ADS] [CrossRef] [Google Scholar]
- Silverman, J. D., Green, P. J., Barkhouse, W. A., et al. 2008, ApJ, 679, 118 [NASA ADS] [CrossRef] [Google Scholar]
- Sivakoff, G. R., Martini, P., Zabludoff, A. I., Kelson, D. D., & Mulchaey, J. S. 2008, ApJ, 682, 803 [NASA ADS] [CrossRef] [Google Scholar]
- Solanes, J. M., Salvador-Solé, E., & González-Casado, G. 1999, A&A, 343, 733 [NASA ADS] [Google Scholar]
- Springel, V., White, S. D. M., Jenkins, A., et al. 2005, Nature, 435, 629 [NASA ADS] [CrossRef] [PubMed] [Google Scholar]
- Stanford, S. A., Romer, A. K., Sabirli, K., et al. 2006, ApJ, 646, L13 [NASA ADS] [CrossRef] [Google Scholar]
- Stern, D., Holden, B., Stanford, S. A., & Spinrad, H. 2003, AJ, 125, 2759 [NASA ADS] [CrossRef] [Google Scholar]
- Stern, D., Eisenhardt, P., Gorjian, V., et al. 2005, ApJ, 631, 163 [NASA ADS] [CrossRef] [Google Scholar]
- Stern, D., Jimenez, R., Verde, L., Kamionkowski, M., & Stanford, S. A. 2010, JCAP, 2, 008 [CrossRef] [Google Scholar]
- Strazzullo, V., Coogan, R. T., Daddi, E., et al. 2018, ApJ, 862, 64 [NASA ADS] [CrossRef] [Google Scholar]
- Sun, M., Donahue, M., & Voit, G. M. 2007, ApJ, 671, 190 [NASA ADS] [CrossRef] [Google Scholar]
- Sun, M., Donahue, M., Roediger, E., et al. 2010, ApJ, 708, 946 [NASA ADS] [CrossRef] [Google Scholar]
- Tanaka, M., Finoguenov, A., Mirkazemi, M., et al. 2013, PASJ, 65, 17 [NASA ADS] [Google Scholar]
- Taranu, D. S., Hudson, M. J., Balogh, M. L., et al. 2014, MNRAS, 440, 1934 [NASA ADS] [CrossRef] [EDP Sciences] [PubMed] [Google Scholar]
- Tonnesen, S., & Bryan, G. L. 2009, ApJ, 694, 789 [NASA ADS] [CrossRef] [Google Scholar]
- Tran, K.-V. H., Kelson, D. D., van Dokkum, P., et al. 1999, ApJ, 522, 39 [NASA ADS] [CrossRef] [Google Scholar]
- Venemans, B. P., Röttgering, H. J. A., Miley, G. K., et al. 2005, A&A, 431, 793 [NASA ADS] [CrossRef] [EDP Sciences] [Google Scholar]
- Venemans, B. P., Röttgering, H. J. A., Miley, G. K., et al. 2007, A&A, 461, 823 [NASA ADS] [CrossRef] [EDP Sciences] [Google Scholar]
- Vikhlinin, A., Burenin, R. A., Ebeling, H., et al. 2009, ApJ, 692, 1033 [NASA ADS] [CrossRef] [Google Scholar]
- Voit, G. M. 2005, Rev. Mod. Phys., 77, 207 [NASA ADS] [CrossRef] [Google Scholar]
- Wagg, J., Pope, A., Alberts, S., et al. 2012, ApJ, 752, 91 [NASA ADS] [CrossRef] [Google Scholar]
- Wang, T., Elbaz, D., Daddi, E., et al. 2016, ApJ, 828, 56 [NASA ADS] [CrossRef] [Google Scholar]
- Wenger, M., Ochsenbein, F., Egret, D., et al. 2000, A&AS, 143, 9 [NASA ADS] [CrossRef] [EDP Sciences] [Google Scholar]
- Wilson, G., Muzzin, A., Yee, H. K. C., et al. 2009, ApJ, 698, 1943 [NASA ADS] [CrossRef] [Google Scholar]
- Wylezalek, D., Galametz, A., Stern, D., et al. 2013, ApJ, 769, 79 [NASA ADS] [CrossRef] [Google Scholar]
- Wylezalek, D., Vernet, J., De Breuck, C., et al. 2014, ApJ, 786, 17 [NASA ADS] [CrossRef] [Google Scholar]
- Yoon, H., Chung, A., Smith, R., & Jaffé, Y. L. 2017, ApJ, 838, 81 [NASA ADS] [CrossRef] [Google Scholar]
- Zabludoff, A. I., Franx, M., & Geller, M. J. 1993, ApJ, 419, 47 [NASA ADS] [CrossRef] [Google Scholar]
- Zappacosta, L., Mannucci, F., Maiolino, R., et al. 2002, A&A, 394, 7 [NASA ADS] [CrossRef] [EDP Sciences] [Google Scholar]
Appendix A: Additional table
Our observations with detection (top part of the table, tagged with “Our observations”) and proto-cluster members information given from the literature and used in our analysis (bottom part of the table, tagged with “Proto-cluster members from the literature”).
All Tables
Our observations with detection (top part of the table, tagged with “Our observations”) and proto-cluster members information given from the literature and used in our analysis (bottom part of the table, tagged with “Proto-cluster members from the literature”).
All Figures
|
Fig. 1. Location of the mask adopted for our observations at LBT plotted on the B-band image (NOAO). The mask (in cyan) was centered at RAJ2000 = 17h56m59s, DecJ2000 = 65°18′42″ with a rotation angle with respect to north of 45°. This mask allowed us to observe the central part of the protocluster, including the radio galaxy. |
| In the text | |
|
Fig. 2. 1D spectra obtained in the J wavelength range for the following confirmed proto-cluster members: the radio galaxy, AGN1354, AGN1317, CMC 1 (see the first portion of Table A.1, “Protocluster members”). The most prominent emission lines, Hβ and [O III]λλ 4959, 5007 Å, are labeled. The protocluster member AGN.1110 is not plotted (see the text for details). |
| In the text | |
|
Fig. 3. 1D stacked rest-frame spectrum in the J wavelength range of the possible protocluster members where we detected the [O III]λ 5007 Å line (CMC 2–CMC 9, except for CMC 7, where we identified the detected emission line as the Hβ, see Table A.1). |
| In the text | |
|
Fig. 4. Left panel: galaxies we spectroscopically detected in the field of the overdensity around radio galaxy 7C 1756+6520 plotted in the B-band image (NOAO). They comprise protocluster members, possible protocluster members, and non protocluster members (see Table A.1). ID numbers, corresponding to the slit, are provided for each source (see Table A.1). The five colors and symbols indicate different redshift ranges: magenta stars z < 1.385, light blue circles 1.385 ≤ z ≤ 1.411, yellow triangles 1.411 < z < 1.427, green ellipses 1.427 ≤ z ≤ 1.434, and red squares (in the right panel) z > 1.434. The central radio galaxy 7C 1756+6520 is the large yellow star in the center. North is up and east to the left. The FoV is about 480″ × 480″, centered on the central radio galaxy. 1″ corresponds to ~8.4 kpc. Right panel: all protocluster and possible protocluster members with spectroscopically confirmed redshift from this work, G 10, and M 12. Symbols and colors are the same as in the left panel. The FoV is 840″ × 840″. The dashed circles indicate a distance of 2 Mpc from the central radio galaxy. |
| In the text | |
|
Fig. 5. Redshift histogram for the spectroscopically confirmed members and possible members (N = 31) of the protocluster around HzRG 7C 1756+6520 at z = 1.4156. The plotted redshifts come from this work, G 10, and M 12. For the protocluster galaxies in common with G 10 and M 12, we adopted our redshift determinations. Redshift bins are of 0.01 (~3000 km s−1 observed frame), corresponding to the standard deviation of the Gaussian function distribution. The vertical dashed line marks the redshift of the central HzRG 7C 1756+6520. |
| In the text | |
|
Fig. 6. Dressler-Shectman (DS) plot. It shows the x, y location of the spectroscopically-confirmed proto-cluster members, centered on 7C 1756+6520. The DS test is applied to proto-cluster members with z within the range [−3σcl, +3σcl] from zcl. The radii of the plotted circles are proportional to eδ/2, where δ is the DS measurement of local deviation from the global velocity dispersion and mean recession velocity (cf. Eq. (2)). Depending on in which bin |
| In the text | |
|
Fig. 7. Phase-space diagram (line-of-sight velocity vs. clustercentric radius, normalized by the protocluster velocity dispersion and the radius R200, respectively) for the spectroscopically identified 31 members of the overdensity 7C 1756+6520. Different symbols refer to different types of protocluster members, as specified in the legend. RG refers to the central radio galaxy of the protocluster. The names of the AGN are also reported. The dashed horizontal line is drawn at v/σv = 0, corresponding to the systemic velocity of the protocluster. |
| In the text | |
|
Fig. 8. Baldwin et al. (1981; BPT) diagrams. Left panel: [N II]/Hα vs. [O III]/Hβ BPT diagram showing the location of AGN1317 (yellow triangle). We adopted the classification of the galaxies in H II-region-like, composite AGN-H II types, and AGN according to Kewley et al. (2006). The Kewley et al. (2001) extreme starburst line and the Kauffmann et al. (2003) pure star formation line are shown as the solid and dashed lines, respectively. Right panel: same as the left panel for the [S II]/Hα vs. [O III]/Hβ BPT diagram. We adopted the classification of the galaxies in H II-region-like, Seyferts, and LINERs according to Kewley et al. (2006). The Kewley et al. (2001) extreme starburst line and the Kewley et al. (2006) Seyfert-LINER line are shown as the solid and dashed lines, respectively. |
| In the text | |
Current usage metrics show cumulative count of Article Views (full-text article views including HTML views, PDF and ePub downloads, according to the available data) and Abstracts Views on Vision4Press platform.
Data correspond to usage on the plateform after 2015. The current usage metrics is available 48-96 hours after online publication and is updated daily on week days.
Initial download of the metrics may take a while.