Fig. 4.
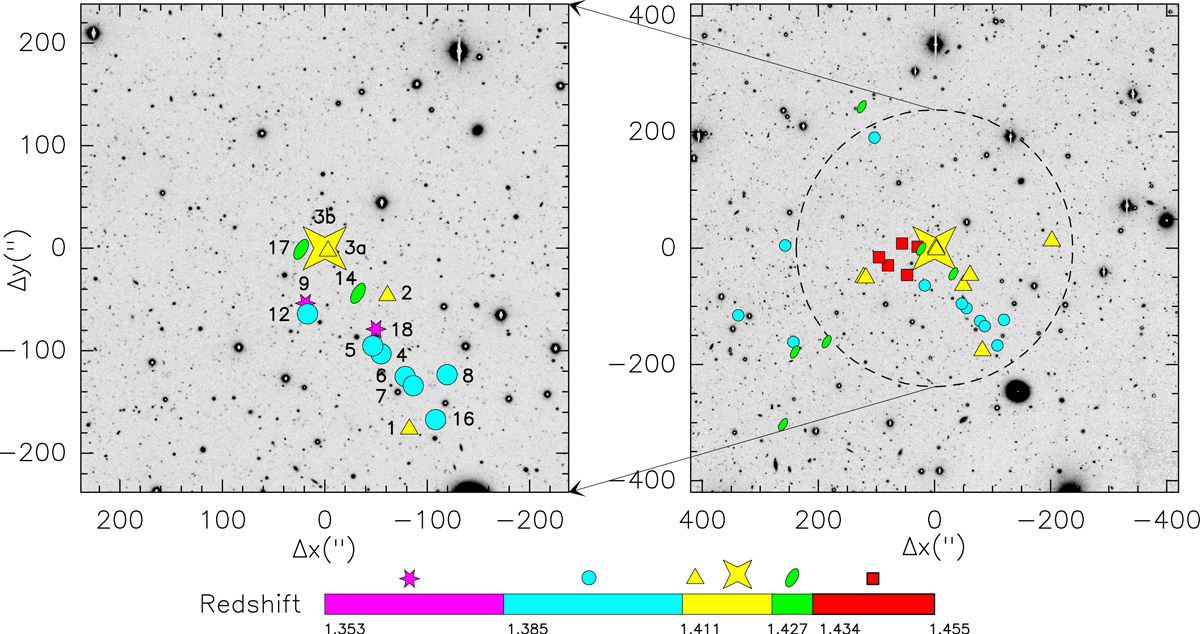
Left panel: galaxies we spectroscopically detected in the field of the overdensity around radio galaxy 7C 1756+6520 plotted in the B-band image (NOAO). They comprise protocluster members, possible protocluster members, and non protocluster members (see Table A.1). ID numbers, corresponding to the slit, are provided for each source (see Table A.1). The five colors and symbols indicate different redshift ranges: magenta stars z < 1.385, light blue circles 1.385 ≤ z ≤ 1.411, yellow triangles 1.411 < z < 1.427, green ellipses 1.427 ≤ z ≤ 1.434, and red squares (in the right panel) z > 1.434. The central radio galaxy 7C 1756+6520 is the large yellow star in the center. North is up and east to the left. The FoV is about 480″ × 480″, centered on the central radio galaxy. 1″ corresponds to ~8.4 kpc. Right panel: all protocluster and possible protocluster members with spectroscopically confirmed redshift from this work, G 10, and M 12. Symbols and colors are the same as in the left panel. The FoV is 840″ × 840″. The dashed circles indicate a distance of 2 Mpc from the central radio galaxy.
Current usage metrics show cumulative count of Article Views (full-text article views including HTML views, PDF and ePub downloads, according to the available data) and Abstracts Views on Vision4Press platform.
Data correspond to usage on the plateform after 2015. The current usage metrics is available 48-96 hours after online publication and is updated daily on week days.
Initial download of the metrics may take a while.