Fig. 5.
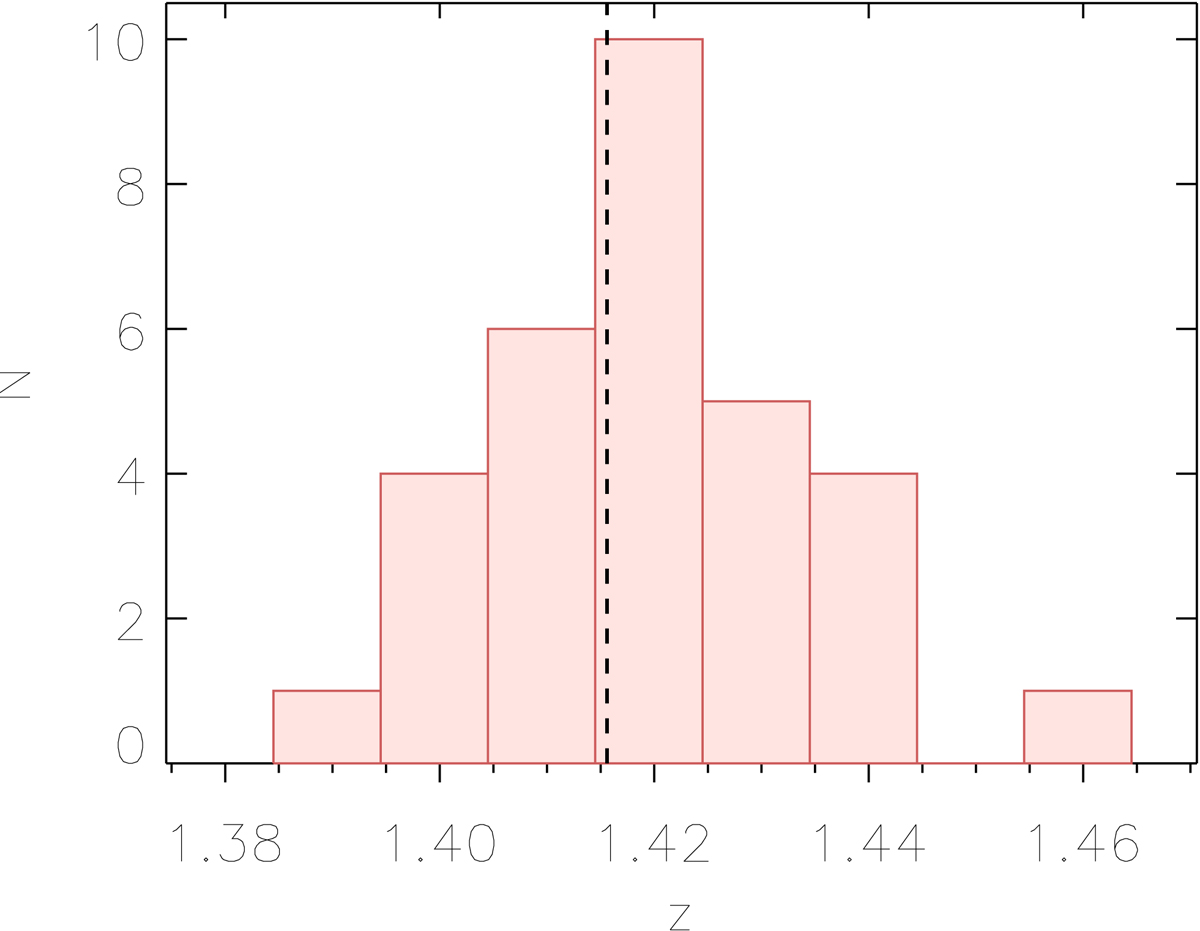
Redshift histogram for the spectroscopically confirmed members and possible members (N = 31) of the protocluster around HzRG 7C 1756+6520 at z = 1.4156. The plotted redshifts come from this work, G 10, and M 12. For the protocluster galaxies in common with G 10 and M 12, we adopted our redshift determinations. Redshift bins are of 0.01 (~3000 km s−1 observed frame), corresponding to the standard deviation of the Gaussian function distribution. The vertical dashed line marks the redshift of the central HzRG 7C 1756+6520.
Current usage metrics show cumulative count of Article Views (full-text article views including HTML views, PDF and ePub downloads, according to the available data) and Abstracts Views on Vision4Press platform.
Data correspond to usage on the plateform after 2015. The current usage metrics is available 48-96 hours after online publication and is updated daily on week days.
Initial download of the metrics may take a while.