Fig. 8.
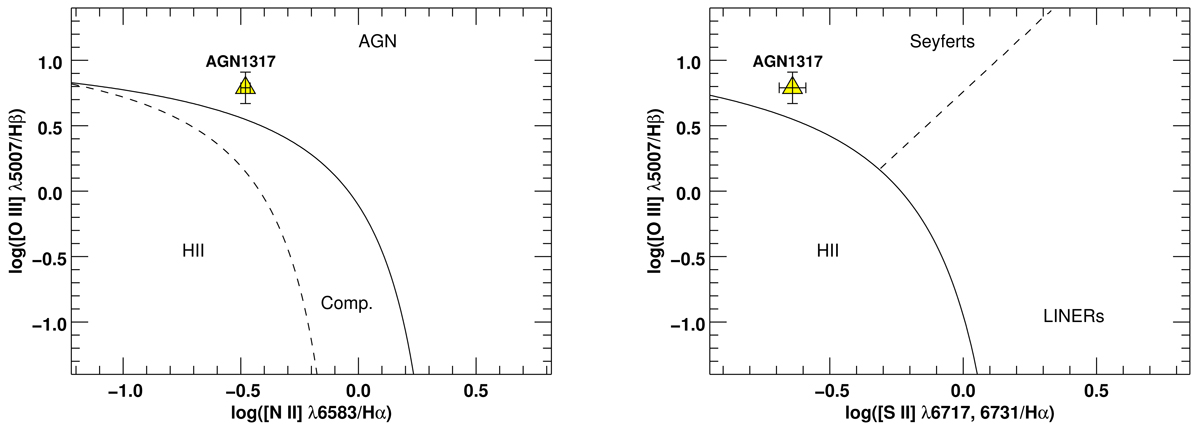
Baldwin et al. (1981; BPT) diagrams. Left panel: [N II]/Hα vs. [O III]/Hβ BPT diagram showing the location of AGN1317 (yellow triangle). We adopted the classification of the galaxies in H II-region-like, composite AGN-H II types, and AGN according to Kewley et al. (2006). The Kewley et al. (2001) extreme starburst line and the Kauffmann et al. (2003) pure star formation line are shown as the solid and dashed lines, respectively. Right panel: same as the left panel for the [S II]/Hα vs. [O III]/Hβ BPT diagram. We adopted the classification of the galaxies in H II-region-like, Seyferts, and LINERs according to Kewley et al. (2006). The Kewley et al. (2001) extreme starburst line and the Kewley et al. (2006) Seyfert-LINER line are shown as the solid and dashed lines, respectively.
Current usage metrics show cumulative count of Article Views (full-text article views including HTML views, PDF and ePub downloads, according to the available data) and Abstracts Views on Vision4Press platform.
Data correspond to usage on the plateform after 2015. The current usage metrics is available 48-96 hours after online publication and is updated daily on week days.
Initial download of the metrics may take a while.