Fig. 6.
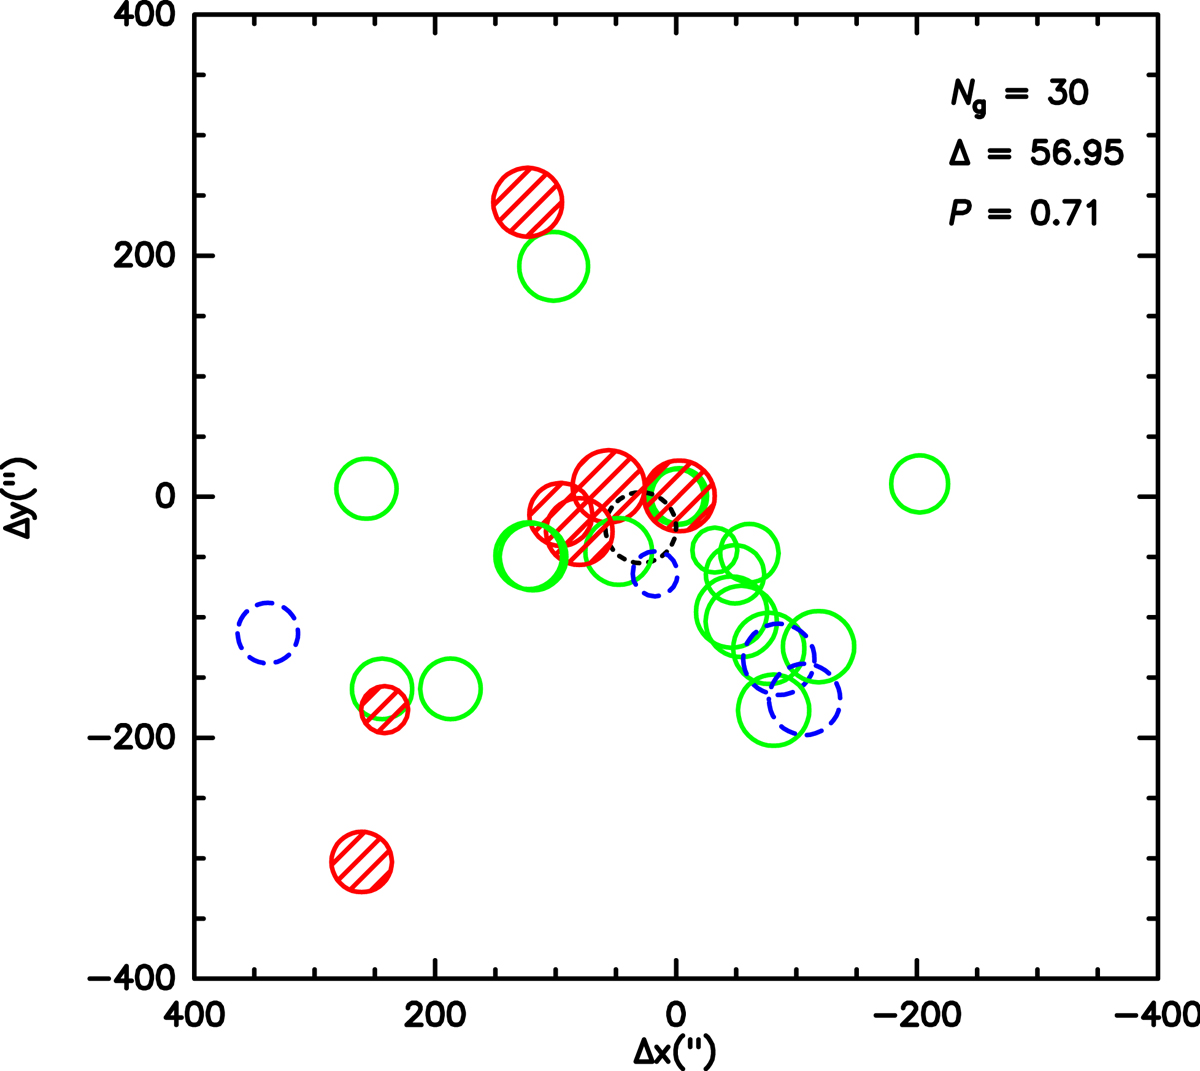
Dressler-Shectman (DS) plot. It shows the x, y location of the spectroscopically-confirmed proto-cluster members, centered on 7C 1756+6520. The DS test is applied to proto-cluster members with z within the range [−3σcl, +3σcl] from zcl. The radii of the plotted circles are proportional to eδ/2, where δ is the DS measurement of local deviation from the global velocity dispersion and mean recession velocity (cf. Eq. (2)). Depending on in which bin ![]() falls, the circles are: blue and dashed [−3σcl, −1σcl], green [−1σcl, +1σcl], red and hashed [+1σcl, +3σcl]. The black and dotted circle is the galaxy MSC2, excluded from the DS test because it has a
falls, the circles are: blue and dashed [−3σcl, −1σcl], green [−1σcl, +1σcl], red and hashed [+1σcl, +3σcl]. The black and dotted circle is the galaxy MSC2, excluded from the DS test because it has a ![]() that does not fall in the range [−3σcl, +3σcl]. The number of proto-cluster members Ng, the statistics Δ, and the statistical significance P are also given on the figure.
that does not fall in the range [−3σcl, +3σcl]. The number of proto-cluster members Ng, the statistics Δ, and the statistical significance P are also given on the figure.
Current usage metrics show cumulative count of Article Views (full-text article views including HTML views, PDF and ePub downloads, according to the available data) and Abstracts Views on Vision4Press platform.
Data correspond to usage on the plateform after 2015. The current usage metrics is available 48-96 hours after online publication and is updated daily on week days.
Initial download of the metrics may take a while.