| Issue |
A&A
Volume 616, August 2018
|
|
|---|---|---|
| Article Number | A168 | |
| Number of page(s) | 7 | |
| Section | Galactic structure, stellar clusters and populations | |
| DOI | https://doi.org/10.1051/0004-6361/201832999 | |
| Published online | 07 September 2018 | |
Chemical inhomogeneities amongst first population stars in globular clusters
Evidence for He variations
1
Laboratoire d’Astrophysique, École Polytechnique Fédérale de Lausanne, Observatoire de Sauverny, 1290 Versoix, Switzerland
e-mail: This email address is being protected from spambots. You need JavaScript enabled to view it.
2
Astrophysics Research Institute, Liverpool John Moores University, 146 Brownlow Hill, Liverpool L3 5RF, UK
3
Dipartimento di Fisica e Astronomia, Università degli Studi di Bologna, via Piero Gobetti 93/2, 40129 Bologna, Italy
4
INAF – Osservatorio di Astrofisica e Scienza dello Spazio di Bologna, via Gobetti 93/3, 40129 Bologna, Italy
5
Harvard-Smithsonian Center for Astrophysics, 60 Garden Street, Cambridge MA 02138, USA
Received:
10
March
2018
Accepted:
24
May
2018
Abstract
Spreads in light element abundances among stars (also known as multiple populations) are observed in nearly all globular clusters. One way to map such chemical variations using high-precision photometry is to employ a suitable combination of stellar magnitudes in the F275W, F336W, F438W, and F814W filters (called the “chromosome map”), to maximise the separation between the different multiple populations. For each individual cluster its chromosome map separates the first population (with metal abundance patterns typical of field halo stars) from the second population (which displays distinctive abundance variations among a specific group of light elements). Surprisingly, the distribution of first population stars in chromosome maps of several but not all clusters has been found to be more extended than expected from purely observational errors, suggesting a chemically inhomogeneous origin. We consider here three clusters with similar metallicity ([Fe/H] ~ −1.3) and different chromosome maps, namely NGC 288, M 3, and NGC 2808, and argue that the first population extended distribution (as observed in two of these clusters) is due to spreads of the initial helium abundance and possibly a small range of nitrogen abundances as well. The presence of a range of initial He and N abundances amongst stars traditionally thought to have homogeneous composition, and that these spreads appear only in some clusters, challenges the scenarios put forward so far to explain the multiple population phenomenon.
Key words: stars: abundances / stars: atmospheres / Hertzsprung / Russell and C-M diagrams / globular clusters: general / galaxies: groups: individual: NGC 288, M 3, NGC 2808
Hubble Fellow
© ESO 2018
1. Introduction
Globular clusters (GCs) host multiple populations (MPs) of stars, characterised by anti-correlations among C, N, O, Na, and He star-to-star differences (e.g. Bastian & Lardo 2018). Most scenarios for MPs invoke subsequent episodes of star formation (e.g. D’Ercole et al. 2008; Decressin et al. 2008) where stars with CNONa (and He) abundances similar to those observed in the field are the first stars to form, while stars enriched in N and Na (and He) and depleted in C and O were formed several 106 up to ~108 yr later, from freshly synthesised material ejected by some class of massive stars from the first epoch of star formation.
In the following, we denote as first population (P1), stars with field-like light element pattern. We refer to stars with enhanced N and Na as second population (P2). However, all the existing models have difficulties in quantitatively reproducing observations, and no consensus has been reached on the mechanism responsible for MP origin (e.g. Larsen et al. 2014; Kruijssen 2015; Bastian et al. 2015; Bastian & Lardo 2015, 2018; Renzini et al. 2015).
Key constraints on MPs can be derived from photometry of individual GC stars when suitable filters are used. Recently, the Hubble Space Telescope (HST) UV legacy survey of Galactic GCs (e.g. Piotto et al. 2015; Soto et al. 2017) has provided accurate photometry for 57 Galactic GCs in the Wide Field Camera 3 (WFC3) filters F275W, F336W, and F438W on board HST, perfectly suited to undertake photometric studies of MPs. Filters covering wavelengths shorter than ≲4500 Å are particularly sensitive to star-to-star differences in C, N, and O content. When complemented with the existing optical photometry from the Wide Field Channel of the HST Advanced Camera for Survey (WFC/ACS; Sarajedini et al. 2007) in the F606W and F814W filters, these UV observations have been widely used to identify MPs in individual GCs and to characterise their properties (number ratio between P1 and P2 stars, radial distributions, degree of N enrichment, and trends of such properties with cluster parameters; e.g. Piotto et al. 2015; Milone et al. 2017).
More specifically, Milone et al. (2015, 2017) introduced the pseudo two-colour diagram Δ(F275W−F814W) versus ΔC(F275W, F336W, F438W)—also called the chromosome map—where different GC subpopulations can be easily identified, especially when considering red giant branch (RGB) stars. RGB P1 stars which do not show Na-O abundance variations are expected to be generally distributed around the origin of the chromosome map and cover a narrow range of ΔC(F275W, F336W, F438W) values, while P2 stars (e.g. Na-rich and O-poor stars) span a wide range of both ΔC(F275W, F336W, F438W) and Δ(F275W−F814W) values (Milone et al. 2015, 2017; Carretta et al. 2018).
However, as reported by Milone et al. (2017), in the majority of the clusters the Δ(F275W−F814W) values, and those for ΔC(F275W, F336W, F438W) to a lesser extent, for P1 stars display a range much wider than expected from the photometric errors, implying a chemical inhomogeneity. This is a puzzling result given that according to self-enrichment models of MP formation these stars should all have essentially the same chemical composition within individual clusters (e.g. Gratton et al. 2012; Renzini et al. 2015), hence also the Δ(F275W−F814W) distribution of P1 stars should be narrow. The analysis by Milone et al. (2017) points out this puzzling result, but does not investigate the origin of the extended P1 distributions.
In this paper, we use synthetic spectra to investigate the origin of the extended distribution of P1 stars in the chromosome maps, by studying three clusters with similar iron content ([Fe/H] ~ −1.3; to minimise metallicity effects on the colours of stars) and different chromosome maps, namely NGC 288, M 3 (NGC 5272), and NGC 2808. M 3 and NGC 2808 were selected because they display a well-populated P1 in their chromosome maps, which spans wide ranges in Δ(F275W−F814W), as wide as those covered by P2 stars. NGC 288 is included as a counterexample given that P1 stars in this cluster have nearly homogeneous ΔC(F275W, F336W, F438W) and Δ(F275W−F814W) values.
The paper is structured as follows. We describe the data in Sect. 2, and discuss the observed P1 chromosome maps in terms of abundance variations in Sect. 3. Conclusions follow in Sect. 4.
2. Observational data set and cluster sample
Catalogues for NGC 288, M 3, and NGC 2808 are from the first public data release of the HST UV legacy survey of Galactic Globular Clusters and they are described in Soto et al. (2017). The data used in this work is different from that in Milone et al. (2017) although this does not affect the main result of our investigation. The available catalogues are based on a one-pass reduction with static library point spread functions and contain only those stars that were already found in Sarajedini et al. (2007). The colour-magnitude diagrams (CMDs) shown in Piotto et al. (2015) and Milone et al. (2017) are based on a different treatment of each cluster (including custom point spread function modelling for each exposure, UV-based star lists, etc.; see Soto et al. 2017). A collection of chromosome maps for the entire sample of the UV survey from Piotto et al. (2015) data can be found in Milone et al. (2017).
Given that we are interested in high-precision photometry of cluster members, we retain for our analysis only stars with a displacement in pixels less than ≤0.1 in both the x- and y-axis.
We also limited our study to stars with small photometric uncertainties (<0.03, 0.03, 0.02 in F275W, F336W, and F438W, respectively). RGB stars are selected as those stars lying onto the narrow RGB main locus in the F814W–(F606W−F814W) CMD, where the RGB sequence broadening due to light element inhomogeneities is minimised (e.g. Sbordone et al. 2011). Selected RGB stars are then plotted in the F814W–C(F275W, F336W, F438W) ≡ (F275W−F336W)−(F336W−F438) and F814W–(F275W−F814W) diagrams, to measure for each star its distance in C(F275W, F336W, F438W) and (F275W−F814W) with respect to reference ridge lines located at the blue and the red side of the RGB (Milone et al. 2017). Values for each star are then normalised, respectively, to the C(F275W, F336W, F438W) and (F275W−F814W) differences between the red and blue fiducials, taken 2.0 magnitudes above the main sequence turnoff in the F814W filter (these differences are denoted as WC(F275W,F336W,F438W) and WmF275W−mF814W in Milone et al. 2017).
We denote these indices for each RGB star as ΔC(F275W, F336W, F438W) and Δ(F275W−F814W), respectively, following Milone et al. (2017). The normalisation described above implies that the range of Δ(F275W−F814W) and ΔC(F275W, F336W, F438W) covered by stars in each cluster will be equal to the values of WC(F275W,F336W,F438W) and WmF275W−mF814W specific to each individual cluster. These two quantities vary from cluster-to-cluster (Milone et al. 2017) and depend on the specific chemical make-up of the underlying stellar populations.
Finally, ΔC(F275W, F336W, F438W) and Δ(F275W– F814W) are plotted against each other to derive the chromosome maps in Fig. 1. The same figure displays also the line used to separate between P1 and P2, as defined by Milone et al. (2017). P2 stars are those located above the dotted line of Fig. 1, while P1 stars are located below. This separation is based on the fact that spectroscopic analyses of a subsample of stars in NGC 6121 (M 4) included in the chromosome maps of Milone et al. (2017) show Na-O ratios typical of field halo stars, for objects lying in the P1 region of the maps. These photometric maps are very similar to the corresponding ones published by Milone et al. (2017) for the same clusters, and the values of WC(F275W,F336W,F438W) and WmF275W−mF814W we obtain are consistent with the corresponding values in Table 2 of Milone et al. (2017).
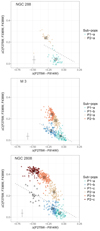 |
Fig. 1. Chromosome maps for RGB stars in the studied clusters. Dotted lines separate between P1 and P2 according to the definition given in Milone et al. (2017). The mean photometric errors are shown in the bottom left corner of each panel. Different subpopulations identified employing a k-means algorithm are shown with different colours and symbols, as labelled. Large empty black symbols denote the mean Δ (F275W−F814W) and ΔC(F275W, F336W, F438W) values of each subpopulation. 3D chromosome maps can be visualised at these links NGC 288, M 3, NGC 2808. |
3. The chromosome maps
Figure 1 shows chromosome maps for NGC 288, M 3, and NGC 2808. Stars in each cluster display their own distinctive pattern. We resorted to a clustering analysis to identify the subpopulations shown in the figure, employing a k-means algorithm (see e.g. Hartigan & Wong 1979). Most notably, the Δ(F275W−F814W) and ΔC(F275W, F336W, F438W) ranges spanned by both P1 and P2 stars in M 3 and NGC 2808 are significantly larger than expected from photometric errors alone (see Fig. 1). As noted by Milone et al. (2015, 2017), this means that both P1 and P2 groups host stars with inhomogeneous chemical compositions. While it is well established that P2 stars include different subpopulation with varying degrees of chemical enrichment (e.g. Carretta et al. 2009a,b; Milone et al. 2015, and references therein), P1 stars are not expect to display any intrinsic chemical variations within the standard scenarios proposed to explain the multiple population phenomenon. Still, the distribution of P1 stars along the Δ(F275W−F814W) and ΔC(F275W, F336W, F438W) axes is broader than expected from observational errors, for both M 3 and NGC 2808 (and for a large fraction of the 57 clusters presented in Milone et al. 2017, as also noted by these authors). Conversely, in the case of NGC 288, only two main populations with homogeneous internal composition can be identified. In particular, P1 stars appear to be strikingly homogeneous compared to the other two clusters.
3.1. Reading chromosome maps in terms of abundance variations
As shown by Piotto et al. (2015) and Lagioia et al. (2018), among others, the (F275W−F814W) colour of RGB stars is affected by variations in the oxygen abundance due to the presence in the spectrum of an OH molecular band within the F275W filter bandpass. At low [Fe/H] the effect of a substantial decrease in the oxygen abundance by 0.3 dex on the (F275W−F814W) colour is very small if not negligible, increasing only for [Fe/H] around and above ~−1.0 dex. This means that a variation in the initial oxygen cannot explain the extended P1 in the chromosome maps of clusters like M3 discussed in this paper. In addition, as previously mentioned, the location of P1 stars in the chromosome maps is defined in terms of their stellar Na and O abundances. Milone et al. (2017) shows that stars with spectroscopically measured Na-O ratios typical of field halo stars, hence homogeneous in Na and O, can be seen to occupy the full Δ(F275W−F814W) range of the extended P1 in the cluster M 4 ([Fe/H] ~ −1.0; see also Milone et al. 2015; Carretta et al. 2018). The availability of recent Na and O abundance determinations for RGB stars in NGC 2808 by Carretta et al. (2018) demonstrates that the P1 stars, as defined from the chromosome maps following Milone et al. (2017), all have homogeneous low Na and high O, typical of the field halo population1.
To understand the origin of the extended P1 we have proceeded as follows. It has been well known since Salaris et al. (2006), Sbordone et al. (2011), and Cassisi et al. (2013) that theoretical RGBs of P2 stars overlap with P1 RGBs in the log(L/L⊙)−log(Teff) diagram, unless the initial He abundance is different. The analysis by VandenBerg et al. (2012) shows however that variations in Mg and Si at constant Fe are able to change the Teff of metal poor RGB models; the clusters analysed here and the vast majority of Galactic GCs, bar a few exceptions, with or without an extended P1 do not show internal inhomogeneities in Fe abundances. Potentially, a range of Si and/or Mg amongst P1 stars may produce a spread in the chromosome maps of a given cluster; however, this cannot be the case for the clusters with an extended P1 studied here. We analyse here M 4 (chromosome map shown by Milone et al. 2017) and NGC 2808. The spectroscopic analysis by Carretta et al. (2009a) shows that P1 stars (defined as stars with low Na and high O, consistent with their identification in the chromosome maps) in NGC 2808 have homogenous Mg (with typical field-like abundances) and also homogeneous Si. Also in M 4 there is no spread of Mg and Si in P1 stars. This means that at fixed Y we can model the effects of C, N, O, Na variations by just calculating synthetic spectra with the appropriate composition, keeping the stellar parameters unchanged. We also know that Na variations do not affect the bolometric magnitudes in the filters used for the chromosome maps (see e.g. Sbordone et al. 2011; Piotto et al. 2015).
We took as reference parameters for our synthetic spectra calculations Teff = 5260 K and surface gravity log(g) = 3.3 (cgs units) corresponding to a RGB star along a representative [Fe/H] = −1.3, 12 Gyr α-enhanced, initial Y = 0.246 BaSTI isochrone (Pietrinferni et al. 2006, 2009), taken about 2.0 magnitudes above the main sequence turnoff in the F814W filter. This is the RGB level to which the chromosome map indices are normalised. In the spectrum calculations we first considered a representative P1 composition with [C/Fe] = −0.3, [N/Fe] = +0.2, [O/Fe] = +0.3 (Cohen et al. 2002; Carretta et al. 2009a); all other heavy elements scaled as in the α-enhanced metal mixture of the BaSTI models (see e.g. Sbordone et al. 2011), and Y = 0.246. We then considered a P2 composition with [C/Fe] = −0.4, [N/Fe] = +0.5, [O/Fe] = +0.2 (denoted P2-moderate) keeping all other abundances unchanged, and a more extreme P2 composition with [C/Fe] = −1.0, [N/Fe] = +1.3, [O/Fe] = −0.3 (denoted P2-extreme). These patterns are not necessarily characteristic of the three clusters studied here since no C, N, and O measurements (in the same star) are available in the literature, but they reflect the standard trends observed in Galactic GCs at this intermediate metallicity (Cohen et al. 2002; Carretta et al. 2009a). In addition, we calculated spectra of stars with P1, P2-moderate, and P2-extreme compositions including an enhancement of the He mass fraction of ΔY = 0.05. A variation in He affects the Teff of the RGB at the magnitude level assumed for the normalisation of the chromosome maps’ pseudo-colours. To this purpose, we first estimated from BaSTI isochrones that this Y enhancement causes an increase in the reference RGB Teff of ~70 K2. We then calculated spectra with the mentioned P1 and P2 metal distributions, considering a 70 K Teff increase in the corresponding model atmospheres with respect to the reference value adopted for the P1 and P2 compositions with normal Y. Finally, we computed a spectrum for a star with P1 composition and He enhancement ΔY = 0.15 (in this case the effect of the He increase on the reference RGB Teff is an increase of 170 K.
Calculations were performed with the ATLAS12 (Kurucz 2005; Castelli 2005; Sbordone et al. 2007) and SYNTHE (Kurucz 2005) codes, in the wavelength range 2000–10 600 Å. Bolomet-ric corrections in the VEGAMAG system were calculated for the F275W, F336W, F438W filters of UVIS/WFC3 and the F606W, F814W filters of ACS/WFC following Girardi et al. (2002), to determine C(F275W, F336W, F438W) and (F275W−F814W) differences with respect to a reference RGB star with P1 composition and standard helium. These differences correspond to values of the ΔC(F275W, F336W, F438W) and Δ(F275W−F814W) indices for these synthetic P2 and P1 enhanced helium populations, given that the canonical P1 with standard cosmological He is expected located at coordinates ΔC(F275W, F336W, F438W) = 0.0 and Δ(F275W−F814W) = 0.0 in the chromosome maps.
The results are plotted in the two panels of Fig. 2. We display on the horizontal axis the different chemical compositions investigated. The vertical axis displays the indices ΔC(F275W, F336W, F438W) and Δ(F275W−F814W) for all our synthetic populations. The results are quite clear. The index Δ(F275W−F814W) is affected essentially only by variations in Y; instead, the ΔC(F275W, F336W, F438W) index is in comparison weakly sensitive to Y, but is mainly affected by variations in N (e.g. Piotto et al. 2015). The range of Δ(F275W−F814W) values for P1 stars observed in several clusters like M 3 and NGC 2808 discussed here is therefore due to a range of Y abundances. This is however not found in other clusters, for example NGC 288. The extended P1 sequences in the chromosome maps also display a tilt towards increasing ΔC(F275W, F336W, F438W) for decreasing Δ(F275W−F814W) (e.g. Milone et al. 2017). Based on Fig. 2, this can possibly be explained by a narrow range of N amongst P1 stars. We conclude that the spread in P1 stars indicates that a relatively wide spread of Y is present within this population, possibly accompanied by a narrow range in N.
In summary, P1 stars are defined by their location on the chromosome maps, which is consistent with the position of stars with homogeneous and field-like [O/Fe] and [Na/Fe] measurements in the clusters like M 4 and NGC 2808 investigated here. These P1 stars are often called first-generation stars in the literature, according to the proposed cluster self-enrichment scenarios. We have shown here that P1 stars in clusters with extended P1 in their chromosome maps, such as NGC 2808 and M 3, show a spread of initial Y and a small range of N. In other cases, like NGC 288 with a non-extended P1 in the chromosome map, the Y and N abundances are also homogeneous, like O and Na.
The former behaviour is entirely unexpected in the context of all scenarios for the origin of MPs.
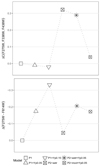 |
Fig. 2. Expected chromosome map indices of RGB stars with P1 chemical composition (squares), P1 with He enhanced by ΔY = 0.05 (triangles up), P1 with He enhanced by ΔY = 0.15 (triangles down), P2 extreme (crossed squares), P2 extreme with ΔY = 0.05 (stars), and P2 moderate with ΔY = 0.05 (crossed circle); see text for details. |
3.2. Distribution of the subpopulations along the RGB
An independent test for He-abundance variations among P1 stars is to look at the optical colour distributions of each of the identified subpopulations. Bolometric corrections in optical filters are negligibly affected when moving from typical P1 to P2 metal distributions (e.g. Sbordone et al. 2011), but an increase in Y shifts the RGB towards bluer colours because isochrones with enhanced He have hotter Teff values.
For each cluster, we first identified different RGB subpop-ulations from the chromosome maps in Fig. 1. The mean values of the ΔC(F275W, F336W, F438W) and Δ(F275W−F814W) indices, and the number of stars belonging to each subpopulation are listed in Table 1. The P1 population in M3 appears to be made of two subpopulations, denoted P1-a and P1-b, when moving from Δ(F275W−F814W) = 0.0 towards negative values. NGC 2808 displays three P1 subpopulations, denoted P1-a, P1-b, and P1-c. Both clusters display a number of P2 subpopulations, two in the case of M 3 and three in the case of NGC 2808. We then considered the F606W–(F606W−F814W) and F606W– (F438W−F814W) CMDs, including RGB stars from one magnitude below the RGB bump up to the bump location, a well-defined and populated part of the RGB. A RGB fiducial line using a polynomial regression was determined in each CMD, and for each star the colour differences Δ(F606W−F814W) and Δ(F438W−F814W) with respect to the colour of the fidu-cial line at the same F606W magnitude were determined. Figure 3 displays the resulting F606W–Δ(F606W−F814W) and F606W–Δ(F438W−F814W) diagrams, and the histograms of these colour differences for both clusters.
The larger baseline (F438W−F814W) colour is more sensitive to the stellar Teff (e.g. Teff changes are proxy for He variations), and in the F606W−(F438W−F814W) CMDs of both clusters P1 stars become on average increasingly bluer when moving from subpopulations P1-a to P1-b in the case of M 3, and P1-a to P1-c in the case of NGC 2808. This is consistent with the interpretation that P1 stars encompass a range of initial He abundances. The separation is larger for NGC 2808, consistent with a larger Y difference amongst the three P1 subpopulations relative to M 3. A separation can also be seen in the (F606W−F814W) colour (less sensitive to Teff) for NGC 2808, but not for M 3, consistent again with a wider He range for NGC 2808 P1 stars. Making use of BaSTI isochrones with varying initial Y, the mean Δ(F606W−F814W) colour differences between P1-a and P1-b in M 3, and P1-a and P1-c in NGC 2808 translate into ΔY ~ 0.024 and ~0.125, respectively.
As a consistency check we analysed in the same way the F606W–(F336W–F438W) and F606W–(F336W–F814W) CMDs, which are also sensitive to the different P1 and P2 metal mixtures (see Fig. 4). In the previous optical CMDs, P2 stars in both clusters were shifted to the blue compared to the P1-a sub-population (which has lower He), whereas at these shorter wavelengths the effect of the metal mixture is expected to shift P2 stars towards the red compared to P1-a stars, counterbalancing or even reversing the effect of an increased He. On the other hand, P1 stars with increased He should still be shifted to the blue compared to P1-a objects, despite the small enhancement of N necessary to explain their chromosome maps. This is exactly what we find when comparing the mean colour differences of the various subpopulations with respect to the fiducial lines, as shown in the lower panels of Figs. 3 and 4. The ordering of the various subpopulations in terms of Δ(F336W−F438W) and Δ(F336W−F814W) is different from the case of optical colours, with the various P2 subpopulations moving to the red relative to P1 subpopulations, compared to optical colours. On the other hand, P1-b and P1-c (in NGC 2808) stars are still bluer than P1-a objects, as in optical CMDs.
This consistency of the RGB colours of P1 (and P2) stars with a range of helium abundances for the specific case of NGC 2808 agrees with the in-depth analysis by Milone et al. (2015). In their paper, however, no link is made between the observed multiple He RGB sequences, and their belonging to low Na and high Na subpopulations.
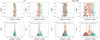 |
Fig. 3. Top panels: F606W–Δ(F606W−F814W) and F606W–Δ(F438W−F814W) diagrams for the various M 3 and NGC 2808 RGB subpopulations. Symbols are the same as in Fig. 1. Bottom panels: histograms of Δ(F606W−F814W) and Δ(F438W−F814W) for both clusters. Dotted lines denote the mean values of these colour differences for each subpopulation (see text for details). |
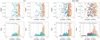 |
Fig. 4. As in Fig. 3, but for Δ(F336W−F438W) and Δ(F336W−F814W) colour differences (see text for details). |
4. Discussion and conclusions
It has been well established by Milone et al. (2017) that the distribution of first population stars in the chromosome maps of most but not all clusters is more extended than expected from purely observational errors, and that its extension is strongly correlated with the cluster mass. So far no clear explanation for the reasons of the observed extended P1 distributions has been provided. We have considered here three clusters with similar metallicity ([Fe/H] ~ −1.3) and different chromosome maps (and masses), namely NGC 288, M 3, and NGC 2808, the latter two displaying an extended P1 made of different subpopulations. Using synthetic spectra calculations, we have shown that this can be explained if M 3 and NGC 2808 P1 stars contain a range of He and possibly N abundances. The He inhomogeneity of P1 stars in these clusters is also confirmed by comparing the colour distribution of the various P1 subpopulations in standard CMDs. Among the nominal P1 stars there appears to be a significant He spread, ΔY ~ 0.024 and ~0.125 for M 3 and NGC 2808, respectively.
We note that the tests presented in Sect. 3.1 are not meant to directly estimate light element abundance variations for the clusters studied here, but rather they provide an interpretation of the properties of the chromosome maps. Only a handful of GC stars have been fully characterised spectroscopically in terms of their abundances of C, N, and O (Bastian & Lardo 2018), and more data is needed to perform a quantitative analysis. Moreover, UV theoretical spectra do not appear to be reliable enough to directly estimate accurate abundance variations from photometry (see Dotter et al. 2015, for a complete discussion). Nonetheless, we emphasise that while a quantitative characterisation of GC stars in terms of He, C, N, and O from their chromosome maps appears premature at this stage, the evidence that the range of colour spreads along the x- and y-axes in the chromosome maps correlate with the level of He and N enrichment is supported by the analysis presented in Sect. 3, which also includes a study of the P1 and P2 optical CMDs (see also Table 4 in Milone et al. 2015).
As mentioned already in Sect. 3.1, both Mg and Si variations amongst RGB P1 stars can affect their Teff, mimicking the presence of He variations (VandenBerg et al. 2012). However, the evidence of significant Mg and Si variations is found only for a few clusters (e.g. Carretta et al. 2009a; Pancino et al. 2017), whereas the P1 groups display extended (F275W−F814W) colour sequences in the majority of clusters studied by Milone et al. (2017). In the specific case of NGC 2808 investigated here (and in M 4, as already discussed), spectroscopic analyses reveal that P1 stars are homogeneous in Mg and Si.
According to standard self-enrichment models for MPs, in a given cluster only P2 stars as defined by their chromosome map location are expected to exhibit different levels of He and N, whereas P1 stars should have essentially the same chemical composition. The presence of a range of initial He and N abundances amongst stars with homogeneous Na and O content, and the fact that these inhomogeneities appear only in some clusters, challenge all scenarios proposed so far to explain the MP phenomenon in globular clusters. Clusters that display extended P1 and P2 have two distinct chemical abundance patterns. The upper branch, which starts around the origin of the chromosome maps and ends up with stars with high/low values of ΔC(F275W, F336W, F438W)/Δ(F275W−F814W), corresponds to the classical MP concept where stars show anti-correlated abundance patterns of Na-O, N-O and He-O. While this branch still remains to be understood, it has been well studied and has been confirmed to be present in nearly all the ancient GCs. The lower branch, however, is not universal amongst the ancient clusters. Some clusters have a tightly defined P1 population without any signs of internal abundance variations, while others display extended (and chemically inhomogeneous) P1 populations.
The extended P1 populations appear to be homogeneous in O, and instead are mainly driven (in the chromosome maps) by a spread in He abundances with potentially small variations in N as well. Such a pattern cannot be explained through the hot hydrogen burning channels that have generally been adopted to explain the classical multiple populations (i.e. P2) as large spreads in C, N, O, Na, and Al would be expected. Instead, the extended P1 pattern is more reminiscent of P-P chain hydrogen burning. This wholly unexpected result adds to the enigma of the multiple populations phenomenon.
Carretta et al. (2018) use a different pseudo-colour diagram in their analysis, but the correlation between the position of stars in their diagram and the chromosome maps can be easily established from the work by Milone et al. (2015), who cross-correlated stars in both the diagrams used by Carretta et al. (2018) and a chromosome map for NGC 2808, even if at that time they had not yet adopted the term chromosome map. This also means that the identification of P1 stars as stars with homogeneous field-like [Na/Fe] and [O/Fe] abundance ratios in terms of their location in the chromosome map of a generic cluster seems to be well established.
The corresponding change in surface gravity is small and has a negligible effect on the spectra.
Acknowledgments
We would like to warmly thank S. Cassisi, S. Larsen, S. Martell, E. Pancino, and M. Rejkuba for useful discussions. We thank the anonymous referee for the meritorious suggestions. CL acknowledges financial support from the Swiss National Science Foundation (Ambizione grant PZ00P2_168065). NB gratefully acknowledges financial support from the Royal Society (University Research Fellowship) and the European Research Council (ERC-CoG-646928, Multi-Pop). Support for this work was provided by NASA through Hubble Fellowship grant HST-HF2-51387.001-A awarded by the Space Telescope Science Institute, which is operated by the Association of Universities for Research in Astronomy, Inc., for NASA, under contract NAS5-26555.
References
- Bastian, N., & Lardo, C. 2015, MNRAS, 453, 357 [NASA ADS] [CrossRef] [Google Scholar]
- Bastian, N., & Lardo, C. 2018, ARA&A, accepted [arXiv:1712.01286] [Google Scholar]
- Bastian, N., Cabrera-Ziri, I., & Salaris, M. 2015, MNRAS, 449, 3333 [NASA ADS] [CrossRef] [Google Scholar]
- Carretta, E., Bragaglia, A., Gratton, R., & Lucatello, S. 2009a, A&A, 505, 139 [NASA ADS] [CrossRef] [EDP Sciences] [Google Scholar]
- Carretta, E., Bragaglia, A., Gratton, R. G., et al. 2009b, A&A, 505, 117 [NASA ADS] [CrossRef] [EDP Sciences] [Google Scholar]
- Carretta, E., Bragaglia, A., Lucatello, S., et al. 2018, A&A, 615, A17 [NASA ADS] [CrossRef] [EDP Sciences] [Google Scholar]
- Cassisi, S., Mucciarelli, A., Pietrinferni, A., Salaris, M., & Ferguson, J. 2013, A&A, 554, A19 [EDP Sciences] [Google Scholar]
- Castelli, F. 2005, Mem. Soc. Astron. It. Suppl., 8, 25 [Google Scholar]
- Cohen, J. G., & Meléndez, J. 2005, AJ, 129, 303 [NASA ADS] [CrossRef] [Google Scholar]
- Cohen, J. G., Briley, M. M., & Stetson, P. B. 2002, AJ, 123, 2525 [NASA ADS] [CrossRef] [Google Scholar]
- Decressin, T., Baumgardt, H., & Kroupa, P. 2008, A&A, 492, 101 [NASA ADS] [CrossRef] [EDP Sciences] [Google Scholar]
- D’Ercole, A., Vesperini, E., D’Antona, F., McMillan, S. L. W., & Recchi, S. 2008, MNRAS, 391, 825 [NASA ADS] [CrossRef] [Google Scholar]
- Dotter, A., Ferguson, J. W., Conroy, C., et al. 2015, MNRAS, 446, 1641 [NASA ADS] [CrossRef] [Google Scholar]
- Girardi, L., Bertelli, G., Bressan, A., et al. 2002, A&A, 391, 195 [NASA ADS] [CrossRef] [EDP Sciences] [Google Scholar]
- Gratton, R. G., Carretta, E., & Bragaglia, A. 2012, A&ARv, 20, 50 [CrossRef] [Google Scholar]
- Hartigan, J. A., & Wong, M. A. 1979, JSTOR: Appl. Stat., 28, 100 [CrossRef] [Google Scholar]
- Kruijssen, J. M. D. 2015, MNRAS, 454, 1658 [NASA ADS] [CrossRef] [Google Scholar]
- Kurucz, R. L. 2005, Mem. Soc. Astron. It. Suppl., 8, 14 [Google Scholar]
- Lagioia, E. P., Milone, A. P., Marino, A. F., et al. 2018, MNRAS, 475, 4088 [NASA ADS] [CrossRef] [Google Scholar]
- Larsen, S. S., Brodie, J. P., Forbes, D. A., & Strader, J. 2014, A&A, 565, A98 [NASA ADS] [CrossRef] [EDP Sciences] [Google Scholar]
- McLaughlin, D. E., & van der Marel, R. P. 2005, ApJS, 161, 304 [NASA ADS] [CrossRef] [Google Scholar]
- Milone, A. P., Marino, A. F., Piotto, G., et al. 2015, ApJ, 808, 51 [NASA ADS] [CrossRef] [Google Scholar]
- Milone, A. P., Piotto, G., Renzini, A., et al. 2017, MNRAS, 464, 3636 [NASA ADS] [CrossRef] [Google Scholar]
- Pancino, E., Romano, D., Tang, B., et al. 2017, A&A, 601, A112 [NASA ADS] [CrossRef] [EDP Sciences] [Google Scholar]
- Pietrinferni, A., Cassisi, S., Salaris, M., & Castelli, F. 2006, ApJ, 642, 797 [NASA ADS] [CrossRef] [Google Scholar]
- Pietrinferni, A., Cassisi, S., Salaris, M., Percival, S., & Ferguson, J. W. 2009, ApJ, 697, 275 [NASA ADS] [CrossRef] [Google Scholar]
- Piotto, G., Milone, A. P., Bedin, L. R., et al. 2015, AJ, 149, 91 [NASA ADS] [CrossRef] [Google Scholar]
- Renzini, A., D’Antona, F., Cassisi, S., et al. 2015, MNRAS, 454, 4197 [NASA ADS] [CrossRef] [Google Scholar]
- Salaris, M., Weiss, A., Ferguson, J. W., & Fusilier, D. J. 2006, ApJ, 645, 1131 [NASA ADS] [CrossRef] [Google Scholar]
- Sarajedini, A., Bedin, L. R., Chaboyer, B., et al. 2007, AJ, 133, 1658 [NASA ADS] [CrossRef] [Google Scholar]
- Sbordone, L., Bonifacio, P., & Castelli, F. 2007, in Convection in Astrophysics, eds. F. Kupka, I. Roxburgh, & K. L. Chan, IAU Symp., 239, 71 [NASA ADS] [Google Scholar]
- Sbordone, L., Salaris, M., Weiss, A., & Cassisi, S. 2011, A&A, 534, A9 [NASA ADS] [CrossRef] [EDP Sciences] [Google Scholar]
- Soto, M., Bellini, A., Anderson, J., et al. 2017, AJ, 153, 19 [NASA ADS] [CrossRef] [Google Scholar]
- VandenBerg, D. A., Bergbusch, P. A., Dotter, A., et al. 2012, ApJ, 755, 15 [NASA ADS] [CrossRef] [Google Scholar]
All Tables
All Figures
|
Fig. 1. Chromosome maps for RGB stars in the studied clusters. Dotted lines separate between P1 and P2 according to the definition given in Milone et al. (2017). The mean photometric errors are shown in the bottom left corner of each panel. Different subpopulations identified employing a k-means algorithm are shown with different colours and symbols, as labelled. Large empty black symbols denote the mean Δ (F275W−F814W) and ΔC(F275W, F336W, F438W) values of each subpopulation. 3D chromosome maps can be visualised at these links NGC 288, M 3, NGC 2808. |
| In the text | |
|
Fig. 2. Expected chromosome map indices of RGB stars with P1 chemical composition (squares), P1 with He enhanced by ΔY = 0.05 (triangles up), P1 with He enhanced by ΔY = 0.15 (triangles down), P2 extreme (crossed squares), P2 extreme with ΔY = 0.05 (stars), and P2 moderate with ΔY = 0.05 (crossed circle); see text for details. |
| In the text | |
|
Fig. 3. Top panels: F606W–Δ(F606W−F814W) and F606W–Δ(F438W−F814W) diagrams for the various M 3 and NGC 2808 RGB subpopulations. Symbols are the same as in Fig. 1. Bottom panels: histograms of Δ(F606W−F814W) and Δ(F438W−F814W) for both clusters. Dotted lines denote the mean values of these colour differences for each subpopulation (see text for details). |
| In the text | |
|
Fig. 4. As in Fig. 3, but for Δ(F336W−F438W) and Δ(F336W−F814W) colour differences (see text for details). |
| In the text | |
Current usage metrics show cumulative count of Article Views (full-text article views including HTML views, PDF and ePub downloads, according to the available data) and Abstracts Views on Vision4Press platform.
Data correspond to usage on the plateform after 2015. The current usage metrics is available 48-96 hours after online publication and is updated daily on week days.
Initial download of the metrics may take a while.