Fig. 1.
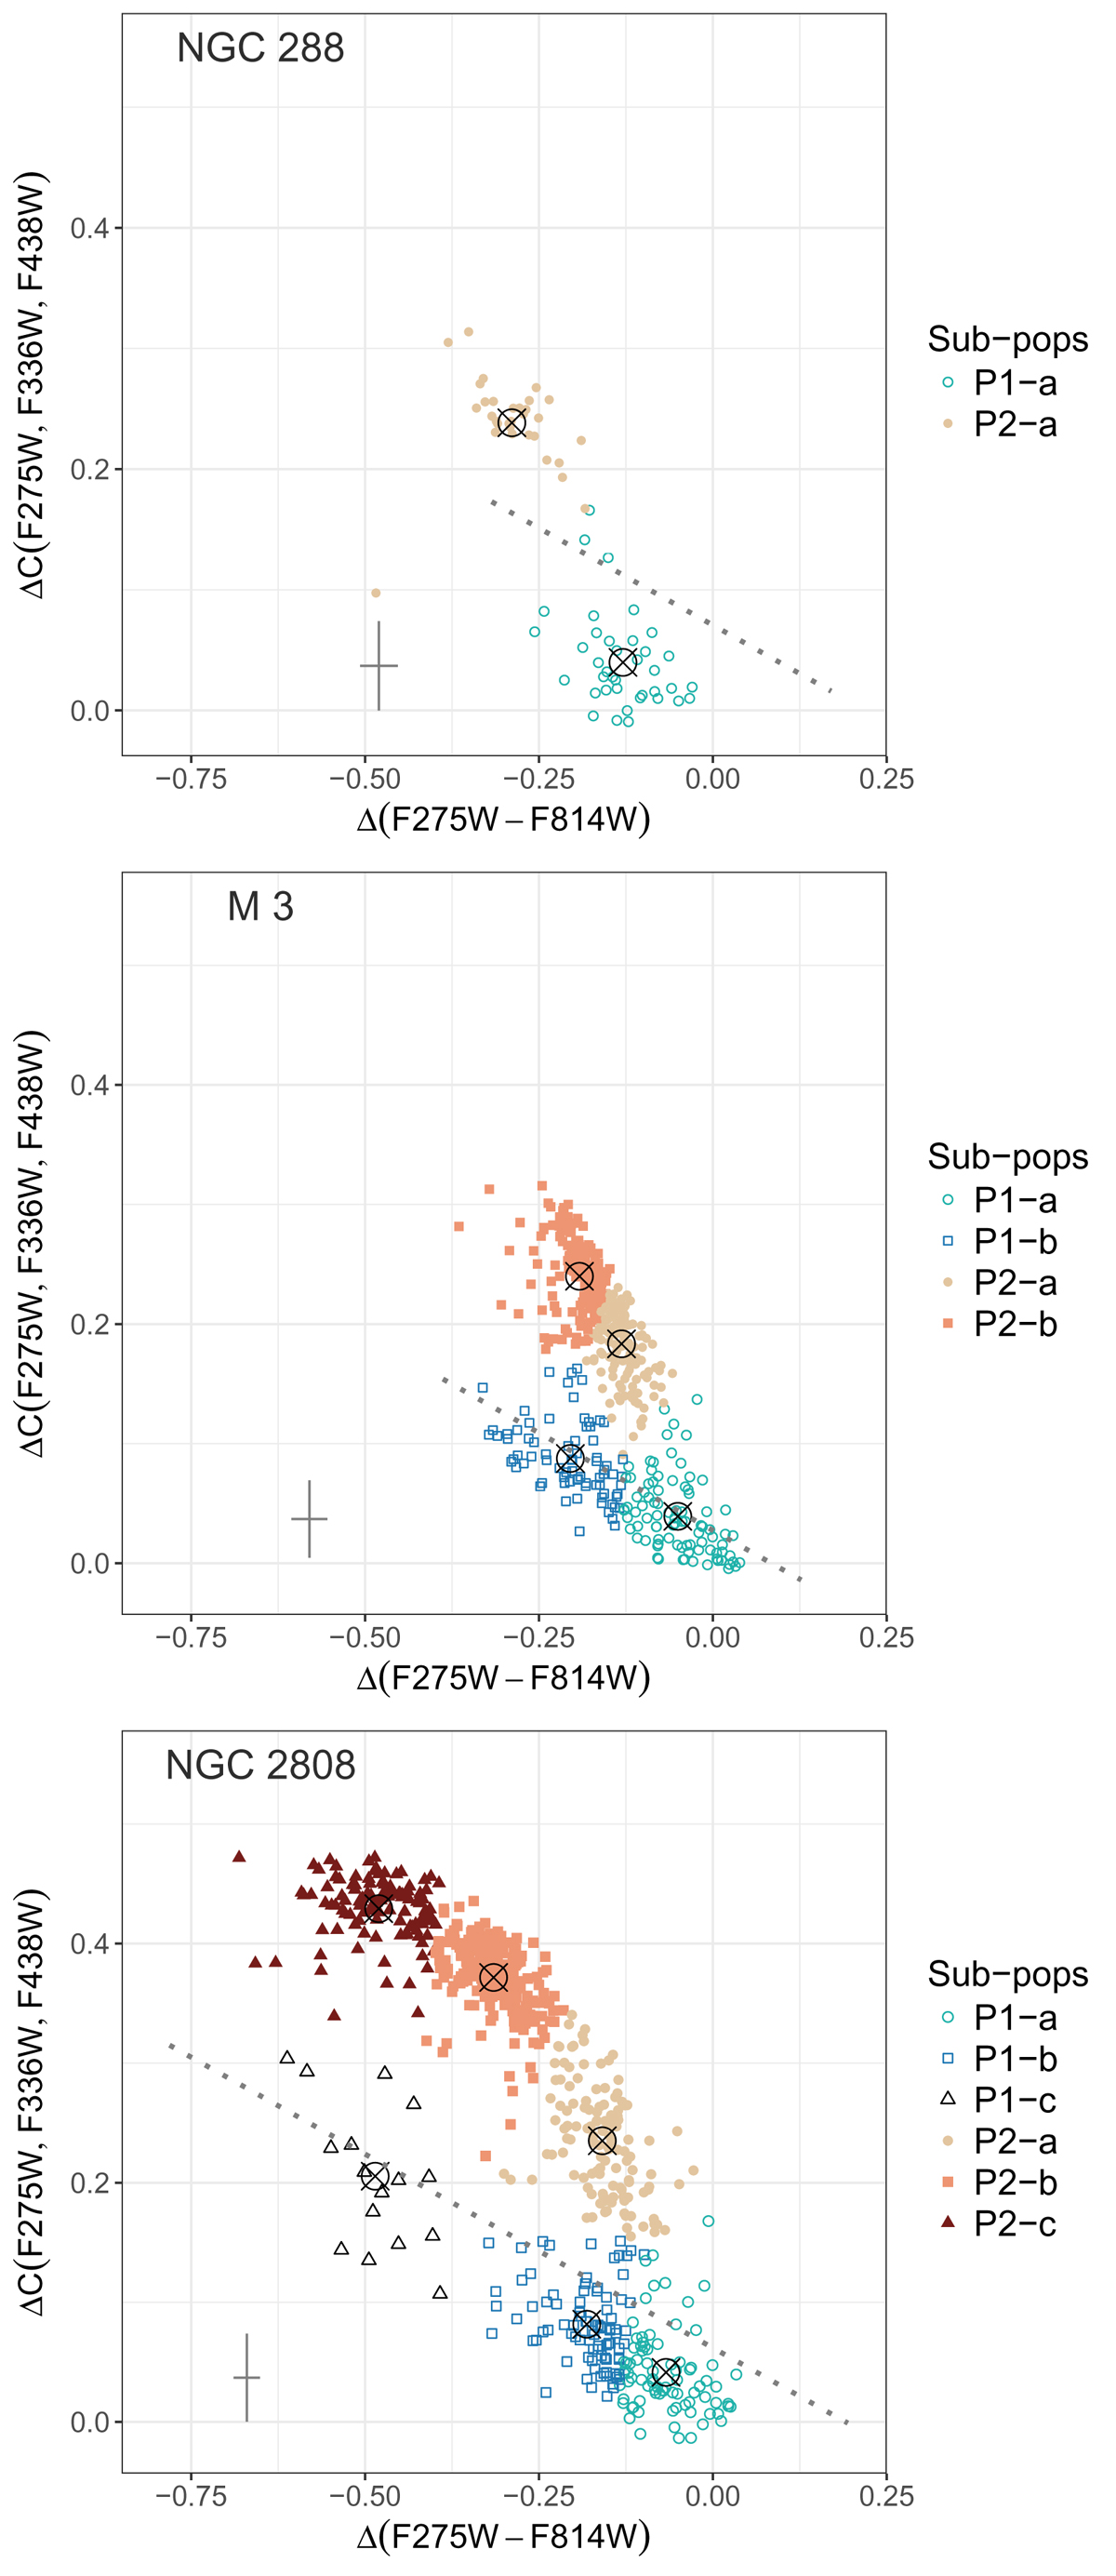
Chromosome maps for RGB stars in the studied clusters. Dotted lines separate between P1 and P2 according to the definition given in Milone et al. (2017). The mean photometric errors are shown in the bottom left corner of each panel. Different subpopulations identified employing a k-means algorithm are shown with different colours and symbols, as labelled. Large empty black symbols denote the mean Δ (F275W−F814W) and ΔC(F275W, F336W, F438W) values of each subpopulation. 3D chromosome maps can be visualised at these links NGC 288, M 3, NGC 2808.
Current usage metrics show cumulative count of Article Views (full-text article views including HTML views, PDF and ePub downloads, according to the available data) and Abstracts Views on Vision4Press platform.
Data correspond to usage on the plateform after 2015. The current usage metrics is available 48-96 hours after online publication and is updated daily on week days.
Initial download of the metrics may take a while.