Fig. 3.
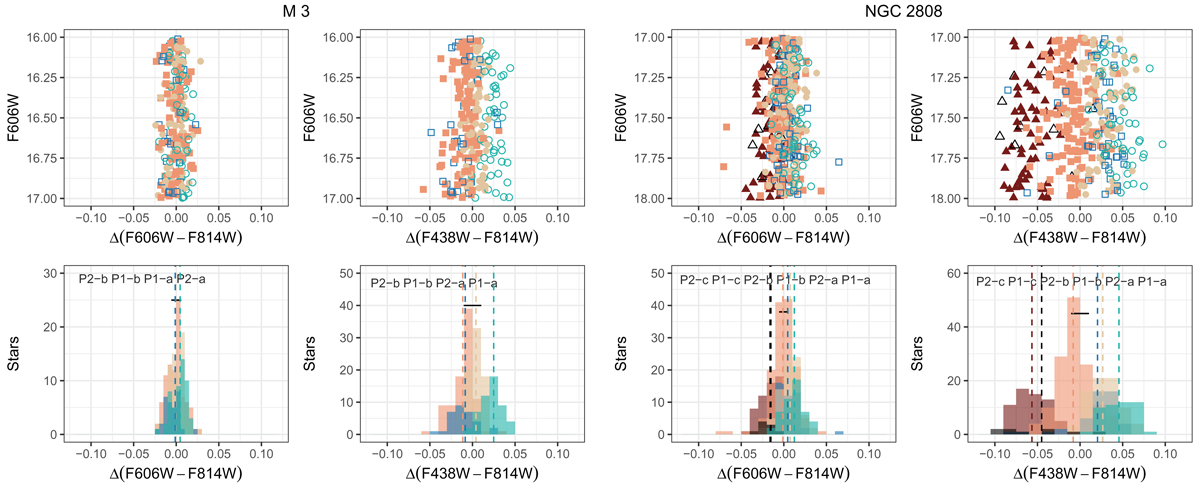
Top panels: F606W–Δ(F606W−F814W) and F606W–Δ(F438W−F814W) diagrams for the various M 3 and NGC 2808 RGB subpopulations. Symbols are the same as in Fig. 1. Bottom panels: histograms of Δ(F606W−F814W) and Δ(F438W−F814W) for both clusters. Dotted lines denote the mean values of these colour differences for each subpopulation (see text for details).
Current usage metrics show cumulative count of Article Views (full-text article views including HTML views, PDF and ePub downloads, according to the available data) and Abstracts Views on Vision4Press platform.
Data correspond to usage on the plateform after 2015. The current usage metrics is available 48-96 hours after online publication and is updated daily on week days.
Initial download of the metrics may take a while.