| Issue |
A&A
Volume 616, August 2018
|
|
|---|---|---|
| Article Number | A91 | |
| Number of page(s) | 12 | |
| Section | Interstellar and circumstellar matter | |
| DOI | https://doi.org/10.1051/0004-6361/201732354 | |
| Published online | 28 August 2018 | |
Dust cleansing of star-forming gas
I. Has radiation from bright stars affected the chemical composition of the Sun and M 67?
Department of Physics and Astronomy, Uppsala University, Sweden
e-mail: This email address is being protected from spambots. You need JavaScript enabled to view it.
Nordic Institute for Theoretical Physics (NORDITA), Stockholm, Sweden
Received:
24
November
2017
Accepted:
3
April
2018
Abstract
Aims. We explore the possibility that solar chemical composition, as well as the similar composition of the rich open cluster M 67, have been affected by dust cleansing of the presolar or precluster cloud due to the radiative forces from bright early-type stars in its neighbourhood.
Methods. We estimate possible cleansing effects using semi-analytical methods, which are essentially based on momentum conservation.
Results. Our calculations indicate that the amounts of cleansed neutral gas are limited to a relatively thin shell surrounding the H II region around the early-type stars.
Conclusions. It seems possible that the proposed mechanism acting in individual giant molecular clouds may produce significant abundance effects for masses corresponding to single stars or small groups of stars. The effects of cleansing are, however, severely constrained by the thinness of the cleansed shell of gas and by turbulence in the cloud. This is why the mechanism can hardly be important in cleansing masses corresponding to rich clusters, such as the mass of the original M 67.
Key words: Sun: abundances / stars: abundances / stars: early-type / dust / extinction / open clusters and associations: individual: Messier 67 / radiation mechanisms: general
© ESO 2018
1. Introduction
The finding by Meléndez et al. (2009) that the Sun departs from most solar twins in the solar neigbourhood in that the composition of its surface layers is comparatively rich in volatile and poor in refractory elements, has led to considerable discussion (for a recent review see Adibekyan et al. 2017). Although the finding, a correlation between the chemical abundances for the Sun relative to the twins with the condensation temperatures of the elements in a gas, has been verified by several independent studies, for example Ramírez et al. (2009), Gonzalez et al. (2010), Adibekyan et al. (2014), Nissen (2015), and Spina et al. (2016), its interpretation is still disputed. The early suggestion by Meléndez et al. (2009) that it could be due to the formation of terrestrial planets in the protoplanetary nebula before the latter was dumped onto the Sun, polluting its convection zone by dust-cleansed gas, requires either an unusually long-lived nebula or a very rapid retraction of the solar convection zone to the surface (cf. Gustafsson et al. 2010). As suggested by Önehag et al. (2011) this early retraction might result from the episodic accretion scenario suggested by Baraffe & Chabrier (2010), if applied to the Sun but not to the twins. The alternative – that the effect is due to Galactic chemical evolution and migration of the Sun from galactic regions other than those of the twins – was suggested and partly supported by tendencies found by Adibekyan et al. (2014), Maldonado et al. (2015), Maldonado & Villaver (2016), and Nissen (2015) for some correlation of the abundance effects to depend on stellar ages. Still another possibility was proposed by Gustafsson et al. (2010) that the presolar nebula was cleansed early on from dust by radiation pressure from hot stars in the neighbourhood. There are indications from the isotopic composition (primarily daughters of  Al and
  Ca) that the Sun was formed in a relatively rich cluster with at least one nearby core-collapse supernova affecting the solar composition (cf. Adams 2010 for a summary, see, however, Fujimoto et al. 2018 for an alternative scenario), and thus with some O- or B-type stars that could have partly cleansed the solar cloud before the solar system was formed. In order to test this hypothesis Önehag et al. (2011 and 2014) carried out detailed analyses of solar twins and solar analogues in the rich old cluster M 67, which is known to have an overall chemical composition close to solar and an age of the order of 4 Gyr. It was found that the cluster stars indeed have an abundance profile more similar to that of the Sun than most solar twins in the neighbourhood, which then seemed to support the assumption that the protocluster and proto-sun were indeed cleansed by radiation from hot stars.
Since the pioneering work by Schalén (1939) and Spitzer (1941) on radiatively accelerated interstellar dust grains, various effects of such grains on interstellar gas have been explored, for example on the dynamics of clouds in the Galaxy (Franco et al. 1991) or on the internal structure of star-forming clouds with H II regions hollowing their centres (Mathews 1967, Cochran & Ostriker 1977). Several relatively detailed numerical models of H II regions with dust-driven flows have been published. In addition to the static models by Draine (2011a), where the dust drift in the region was explored, resulting in piled-up dust in the surrounding outer shell of the region, dynamic simulations have been made in studies such as Arthur et al. (2004), Martínez-González et al. (2014), and Kim et al. (2016). Several studies have been focussed on the structure and evolution of density gradients and shock fronts in these objects (Franco et al. 1990, Shu et al. 2002) and the structure of the photoionization fronts (Diaz-Miller et al. 1998). Skinner & Ostriker (2015) have explored the feedback via dust grains of radiation from massive star clusters embedded in giant molecular clouds.
The issue studied in the present paper is whether the cleansing mechanism proposed could be efficient enough to deplete the dust, not only in the protosolar cloud, but even in the cloud in which M 67, with its initially about 20 000 stars (Hurley et al. 2005), once formed. In this study we use a simple model of a giant molecular cloud with massive stars to set upper limits of the amount of dust-cleansed neutral gas that could be expected. Thus, our aim is not to present a realistic model of this complex physical situation but sooner to obtain constraints on the possibilities of cleansing large gas masses by the mechanism proposed. Our study is also a simple preparatory work for possible more detailed numerical simulations provided that the present results suggest that such studies may be warranted.
Our model represents a star-forming cloud by an initially homogeneous sphere of dense neutral atomic or molecular gas with dust and with a bright light source in its centre. Initially, we follow how the dust is affected by the radiative pressure from the star(s) (Sect. 2.1). The friction force of the dust moving relative to the gas has to be considered, and this friction also moves the gas. However, we see (in Sect. 2.2) that the complex effects of this gas dynamics are to a considerable extent compensated for when the total amount of cleansed gas is calculated. Finally, the motion of the ionization front around the star also has to be considered; this ionization reaches the gas cleansed, presses it outwards, and may stop the possibilities for stars to form easily from that gas (Sect. 2.3). Unlike the model studies referred to above, the present work focusses on the dust in the neutral gas, outside the H II region. In Sect. 3 we draw conclusions concerning how great masses of cleansed gas that could possibly result and be available for forming stars.
2. Model
2.1. Dust front
In interstellar clouds, the mean free path of the molecules is orders of magnitude longer than the size of the dust grains. In this case the equation of motion for a single spherical dust grain, illuminated by a star with luminosity L, can be written (see Draine 2011a)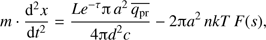 (1)
(1)
with![Mathematical equation: $ \begin{aligned} F(s)\approx \frac{s}{\alpha }[1+(\alpha \cdot s)^2]^{1/2} + \left(\frac{eU}{kT}\right)^2 \mathrm{ln}\,{ \it \Lambda } \frac{s}{3\sqrt{{\uppi }}/4 + s^3}, \end{aligned} $](/articles/aa/full_html/2018/08/aa32354-17/aa32354-17-eq4.gif) (2)
(2)
 (3)
(3)
Here, the motion of the dust grain, with mass m and radius a, in the x direction is along the light rays from the star with luminosity L. The light is attenuated by extinction and the grain is at time t located at an optical depth  and a distance d from the star. The quantity
  is a numerical factor, which is dependent on the grain composition, shape, and wavelength. For the relevant dust and stellar light discussed here a mean
  of about 1.5 may be adopted (Draine 2011a). The speed of light is c and the mass of the hydrogen atoms or molecules, whatever species assumed to dominate the gas, is
  . The dust grain is retarded by a drag force, described by the second term of the right-hand side of Eq. (1). The variable
  is the drift velocity of the grain relative to the gas with the number density of atoms or of molecules n and the kinetic temperature T. In the expression for F(s) in Eq. (2) the last term represents the Coulomb forces, where U is the grain potential, e the electron charge, and
  the electron density. Following Draine (2011a), we set
  . For our neutral gas (with degrees of ionization from Table 30.1 in Draine 2011b) we find the Coulomb force term to be negligible for cool (10–100 K) gas and even rather small for warm
  K gas as compared with the drag force due to the neutral gas collisions. We note that the dependence of the drag force on the drift velocity is linear for small speeds – in typical cases with
  K the shift to a mainly quadratic dependence occurs around
 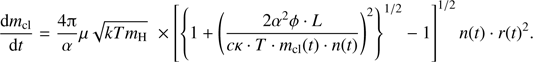 m s
m s , which is higher than typical sound speeds in the cool neutral gas. Below, we call the assumption of a linear dependence of the drag on the drift velocity the small velocity approximation.
For the cases to be discussed the acceleration term, the first term in Eq. (1), may often be neglected and we have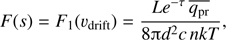 (4)
(4)
which then gives  from Eqs. (2) and (3). We note that
  is then independent of the grain size a, except for a possible weak dependence through
  .
.
In the idealized 1D case of a fully homogeneous gas and an initially equally homogeneous dust distribution in the gas, a stellar flux that is suddenly switched on may be expected to cause the dust to assemble in a narrow dust front. Grains that are first hit by the incoming radiation are rapidly accelerated until they reach an equilibrium with the gas friction at drift velocities of perhaps several hundred metres per second; this is dependent on the illuminating star, its distance, the extinction of its light and the gas density. When the optical depths increase due to shielding by the dust passed, and the available momentum flux from the light source is distributed on an increasing number of swept-up dust grains, the velocities are successively retarded to typically just a few metres per second. Dust grains lagging behind the dust front are exposed to the full illumination by the star; these are immediately accelerated and soon reach the front where they lose much of the driving momentum. An interesting aspect of this is that the bigger grains, which have greater inertia, may be expected to reach further into or across the dense front before they are halted by friction. Thus, some separation of dust of various sizes may occur. Similarly, dust grains ahead of the front, which have initially zero drift relative to the gas, are affected differently. The bigger grains should be passed by the front and be more slowly accelerated towards it, again because of their inertia. Thus, in this simplified model the big grains are more dispersed across the front than the small grains.
To explore this further, we modelled the dust distribution by solving Eq. (1) for a stack of plane-parallel dust sheets of equal masses, which are pushed along in a homogeneous and steady gas column by a light source that has a flux perpendicular to the plane of the sheets. Each dust sheet is free to move through the others and the relevant changes in the optical depths  are successively taken into account. To be specific, we set the dust mass density
  g cm
g cm and the gas-to-dust mass ratio
  . We switched on an illuminating star at a distance d from the column. Two different sizes of grains were explicitly considered; these have radii a of
  and
and  cm, respectively and have equal total mass contributions, and their combined effects were included in the calculation of
  . The density of H
 molecules
  cm
cm and for the stellar luminosity and distance we set
  erg s
erg s , and
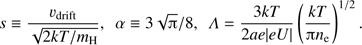
, and  1 pc. Typical results are shown in Figs. 1 and 2. In the first Figure we illustrate the evolution of a dust region just 50 au thick (limited in size for clarity) and embedded in an extensive homogeneous and static gas cloud. This figure shows how the smaller (black) grains gather in a thin decelerating dust front while the bigger (red) grains start more slowly, which is why they tend to lag behind the smaller grains during the first 50 kyr. Then the bigger grains pass to the front and lead, although the small grains gradually catch up. In Fig. 2, representing the evolution of the illuminated surface layers of an extended dusty gas, the distribution across the front for the two types of grains is shown for a number of times with intervals of 50 kyr. As is seen, the leading more massive grains actually show a two-peak distribution: with a first peak ahead of the small-grain dust front by at first typically 5 au and next successively thinner and the other and more massive dust front more aligned with the front of the small grains. Obviously, the front may be totally about 10 au wide for big grains, which have diameters of
  micron in typical cases, while the front of the smallest grains (
 microns) is just a few au.
The picture presented above is, however, too simplified. The front may have a speed relative to the gas of only some metres per second, and the grains that happen to be in front of it are affected by more dynamical forces and motions, for instance related to turbulence. Thus, the dust front may be much less well defined. In addition to this, it is easy to see that the dust front may be affected by instabilities; a spurious reduction of the number of grains in a section of the front admits radiation to push the dust (which may also drag the gas) in that section further ahead of the front. Similarly, an increase of the number of grains in a region causes it to move more slowly. If these perturbations occur early on, in regions with moderate optical depths, they may have noticeable consequences for the shape of the front such as the formation of finger-like structures beyond it.
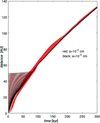 |
Fig. 1. Motion of a stack of 100 dust sheets, initially extending across 50 au, moving as a result of perpendicular radiative pressure (from below in the figure) through a homogeneous gas. The motions of small ( |


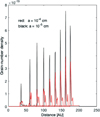 |
Fig. 2. Dust density in the dust front shown in Fig. 1, at 9 different consecutive times with intervals between them of 50 kyr for two different grain sizes. |
2.2. Motion of the dust front
We now estimate the velocity of the dust front through the neutral gas and subsequently explore the resulting cleansing effects. We make these estimates based on the assumption of spherical symmetry and the application of the momentum equation and conservation of the number of dust grains. We also make some simple approximations concerning the acceleration phase of the dust during its motion through optically thin layers. We show that the character of the narrow dust front discussed above substantially simplifies the discussion. A general schematic outline of our schematic model is shown in Fig. 3.
We first assume that the dust front becomes optically thick and we explore departures from this later. For the moving dust front at a distance r from the star or central group of stars, the total momentum transferred by the stellar radiation to the dust per second is represented by the LHS in Eq. (5), below. The variable  denotes the total gas mass swept over by the dust front, and thus cleansed, at time t. The radiative momentum partially goes into accelerating the new dust grains caught by the front from the gas to the dust-front velocity as well as accelerating the grains already present there, resulting in the acceleration
  . The total mass of this dust swept up by the front is
  , where
  is the gas to dust mass ratio. If the speed of the dust front is
  the added momentum per second to the new grains in the front, in addition to the momentum they have when swept along by the gas, is
  , where
  is the velocity of the gas and
  where Y and Z are the mass fractions of He and heavier elements in the gas, respectively. The value n(t) is the local number density of gas molecules (or atoms if the molecules are dissociated) at the dust front. The rest of the momentum is lost to the gas by friction, according to the last term in the following equation:
 (5)
(5)
The value of  is dependent on the detailed radiative transfer in the dust front. Assuming that the photons are finally absorbed and give up their total momentum in the optically thick front, we can set
  . The fourth term represents the gravity from the gas mass on the dust shell and the gravity from the stars with mass
  formed inside the dust shell at early stages before the cleansing process started. One should note that the local number density of H
 molecules or free hydrogen atoms n(t) may be very different from the initial density,
  . The temperature-dependent choice of hydrogen species is specified later.
The quantity N(a)da is the total number of dust grains in the dust front with radii in the interval ( da), and
  and
and  are the lower and upper limits, respectively, of this dust-size distribution. We have adopted the classical distribution
 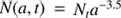 of Mathis et al. (1977), see also Casuso & Beckman (2010), in the range from
  –
– cm. It is worth noting that, with this size distribution, the most important grains contributing extinction (scaling as
  ) are those with smaller sizes, while the mass contribution (
 ) is more evenly distributed among the various sizes.
We can now normalize the dust size distribution, assuming spherical grains, to the proper dust mass ratio at the time t
 (6)
(6)
Since  we may neglect the
  term in Eq. (6) and obtain
 (7)
(7)
Correspondingly approximating the integral in Eq. (5) and defining  we may now write the equation of motion for the dust front, as
 (8)
(8)
Here (9)
(9)
and (10)
(10)
are two constants, depending on the dust properties and the chemical composition of the gas, respectively.
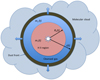 |
Fig. 3. Schematic picture of our model. The bright star(s) is located in the middle, surrounded by the expanding H II region with radius |

2.3. Cleansed gas mass
It is clear from Eq. (8) that for a full solution we must also supply information about the gas velocity  and gas density n(t) as functions of r and t. Another circumstance of importance is the handling of the radiative force term in the optically thin layers of the gas where this equation must be modified. We return to these complications but first develop a simple theory that partially circumvents these difficulties, keeping in mind that our main ambition is to obtain an estimate of the cleansed gas mass,
  , sooner than studying the detailed dynamics of the situation.
By direct solution with typical parameters we find that the first two terms of Eq. (8) after relatively short times,  , become unimportant in comparison with the third term, i.e. the dust grains relatively rapidly acquire the drift velocity. For a linear dependence of
  in Eq. (2) we find
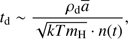 (11)
(11)
while for the case 
 (12)
(12)
Typically, this leads in both cases to  years or less and total masses of cleansed gas during this time of a few solar masses. For the optically thin case, similar results are obtained from Eqs. (5) and (19).
The neglect of the two first terms in the equation of motion for the dust front is subsequently called the drift approximation. In practice, with realistic values of  , we also find the gravity term in Eq. (8) to be unimportant. The gravity term would only be comparable to the dominating terms for relatively compact but massive regions in which
 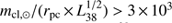 , where
  is the luminosity of the central star(s) in
  erg/s and
  is the cleansed mass in solar masses. Also, in such cases we have found by numerical experimentation that the gravity term does not increase the maximum value of
  . There is, however, the possibility that gravity could, in the long run, turn the expansion of the gas cloud to a collapse with a second phase of star formation. This is discussed later in this work. Thus, neglecting also the gravity term we get
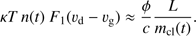 (13)
(13)
Defining F and s according to Eqs. (2) and (3) we find the solution for s from the resulting quadratic equation. Next, we obtain the gas mass passed (and thus cleansed) by the dust front in the time interval dt as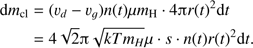 (14)
(14)
We now combine the solution for s and Eq. (14) to a differential equation from which  may be obtained, if the variation of the local density at the dust front, n(t), and the distance of the dust front from the star, r(t), are known as follows:
![Mathematical equation: $ \begin{aligned}\frac{\mathrm{d}m_\mathrm{{cl}}}{\mathrm{d}t} =\frac{4{\uppi }}{\alpha } \mu \sqrt{kTm_\mathrm{H}} \nonumber \ \times \left[ \left\{ 1+\left(\frac{2\alpha ^2\phi \cdot L}{c\kappa \cdot T\cdot m_\mathrm{{cl}}(t) \cdot n(t)}\right)^2\right\} ^{1/2} - 1\right]^{1/2} n(t) \cdot r(t)^2. \end{aligned} $](/articles/aa/full_html/2018/08/aa32354-17/aa32354-17-eq86.gif) (15)
(15)
In the early phase of the expansion of the dust front the second term in the RHS of Eq. (15) may dominate. In this case we find![Mathematical equation: $ \begin{aligned} \frac{\mathrm{d}m_\mathrm{{cl}}}{\mathrm{d}t} = \frac{8\sqrt{\uppi }}{3}\mu \cdot \left[\frac{\phi \rho _\mathrm{d} \overline{a} m_\mathrm{H}}{c} \cdot \frac{Ln(t)}{m_\mathrm{{cl}}(t)}\right]^{1/2}\cdot r(t)^2. \end{aligned} $](/articles/aa/full_html/2018/08/aa32354-17/aa32354-17-eq87.gif) (16)
(16)
However, as the dust front accumulates more dust, so that the stellar radiation momentum is distributed on a greater dust mass, the second term on the RHS of Eq. (15), gets  . Putting in realistic numbers, we find that in this case, implying a shift from a quadratic to a linear dependence of the friction force on the drift velocity, occurs when
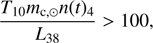 (17)
(17)
where  is the temperature in the dust shell in units of 10 K and
  is the local gas number density in
  cm
cm . This case thus applies if considerable masses (
 solar mass) are to be cleansed. It obviously corresponds to the small velocity approximation as discussed above. We have then
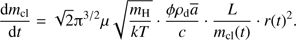 (18)
(18)
We note that the problem is significantly simplified when this approximation can be used. The explicit dependence on density fluctuations through n(t) is then cancelled. Hydrodynamics beyond the simple application of momentum conservation only appears indirectly through the radial distance of the dust front from the star, r(t), and a possible variation of the gas temperature T. Also in the high-velocity case (Eq. (16)) we note that the dependence on density only goes as  . Since r(t) is very much governed by the expansion of the H II region, the growth of
  is thus in general not very sensitive to the details of the structure of the neutral gas shell.
For the case of an optically thin gas Eq. (1) applies to every individual dust grain. In the extreme completely transparent case, with  , the grains initially closest to the star have been pushed out to a certain distance from the star by radiative pressure and there at a given time define the limits of the cleansed region. With the small velocity approximation and applying Eq. (14) we find
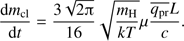 (19)
(19)
In this case, not only  and n(t) but also r are cancelled, and, with a constant T and L, the cleansed mass grows linearly with time.
It is easily seen by inserting typical numbers into Eqs. (18) and (19) that the growth of the cleansed mass may be orders of magnitude more rapid in the optically thin case than in the thick case. This is an obvious consequence of the shadowing in the thick case of radiation by the grains closest to the star, radiation that would otherwise directly strike further grains ahead. The optical depth  of the dust collected from the cleansed mass is
 (20)
(20)
where  , which we here set
  , is the absorption cross section per grain and
  ,
,  , depends on the r distribution of dust. The variable
  is the number of dust grains with radii in the interval
  per volume unit. The lowest value of
  , chosen subsequently, corresponds to a thin dust shell with radius r and the highest to the original homogeneous distribution.
It is important to consider how far the dust front proceeds through the gas before it gets optically thick. If we assume that the initial number density of H molecules in the gas was  and that all dust that was initially within the radius r(t) has been collected in the dust front when it reaches this radius at time t, we can use the condition that
  and Eq. (20) to estimate an upper limit of the maximum mass cleansed during this first phase when the dust front is optically thin. We find
 (21)
(21)
which, with characteristic numbers for the parameters leads to (22)
(22)
where  is in cm
 . Since the original molecular number density in the cores of Giant Molecular Clouds is typically of the order of
  cm
cm , we conclude that the mass cleansed in such a cloud during the optically thin phase is small.
As a check we modelled the dust motion in the optically thin layer of the dusty molecular cloud closest to the star by subdividing the region into ten different subshells, each with thickness corresponding to 0.2 in optical depth. For these subshells, we applied Eq. (8), properly modified with a factor of  multiplied to L. In solving the equation for each subshell individually, we found that these subshells pile up and merge in a dust front close to a common geometrical depth point P, and from that point and onwards we integrated Eq. (8) for the full front. In calculating the swept gas mass we added the different sub-layers for depths outside P. As expected, the effects of this more detailed treatment of the radiative transfer is minor for realistic shells.
It is easy to see that the optical depth of the dust shell increases linearly with its radius. The effect of the increase of the number of swept-up grains, varying as  , combines with that of the dispersion of the dust which varies as
  . This ends when the border of the cloud is reached. After that the optical depth decreases in proportion to
  . However, except for very small clouds, this occurs at such late stages in the evolution of the dust shell, when the speed of the shell is so slow and the star(s) in the centre have declined so much in brightness, that it does not affect the resulting cleansed gas mass much.
Regarding the motion of the dust front, we conclude that the front may be assumed to be optically thick and the drift approximation may be applied (i.e. Eq. (15) may be used), while the small velocity approximation with a linear dependence of the friction force on the drift velocity is not valid in early phases (small r) and strong luminosities (cf. Eq. (17)). It remains to allow for the effects of the functions r(t) and n(t) on the motion of the dust front. This requires considerations concerning the dynamics of the H II region and some discussion of the pressure equilibrium of the neutral gas.
2.4. Ionization front
The evolution of the region close to the bright illuminating star (or stars) is of key significance for the dust cleansing of the surrounding cool gas. The expanding H II region may well rapidly penetrate into the molecular cloud, heat it, and thus erode the possibilities for star formation. Also, this expansion, owing to the great pressure in the hot ionized gas ( K) and radiation pressure (Krumholz & Matzner 2009, Akimkin et al. 2015, Akimkin et al. 2017), pushes the cool gas with its dust front to a rapidly increasing distance from the star. The gas just outside the H II region is compressed by the outgoing shock wave to high densities (typically
  cm
cm just preceding the ionization front (Draine 2011a, Kim et al. 2016). We apply a simple approach to modelling the H II region to obtain a lower limit of r(t) in Eq. (15).
A bright and hot star that forms in a hydrogen cloud with initial mass density  very rapidly ionizes a region around it, generating an initial Strömgren sphere (Strömgren 1939) with a radius
 (23)
(23)
Here,  cm
cm s
s denotes the Case B recombination coefficient for hydrogen in the on-the-spot approximation (cf. e.g. Walch et al. 2012). The value X is the mass fraction of hydrogen in the gas, while f is the fraction of the stellar flux that is directly able to photoionize hydrogen from the ground state (i.e. with a wavelength
  nm). The value of f is typically 10–20% for O-type stars. Next, the great overpressure in this sphere, owing to its high temperature of
  K with respect to its surrounding, causes the gas to expand (D-type expansion). Bisbas et al. (2015) have found that the time development of the radius of the region,
  may be approximated by a combination of two functions,
  and
and  , according to
 (24)
(24)
where  and
and  are solutions to two ordinary differential equations (see Bisbas et al. 2015, their Eqs. (8) and (11), respectively). The authors compared this approximation with more detailed numerical simulations and found it to agree excellently with the detailed results obtained for
  Myr. We solved those ordinary differential equations adapted to our model parameters and consider that the cleansing process stops if or when the HII front reaches the dust front.
The effects on the dust cleansing in the molecular cloud are dependent on the early evolution of the bright star and its H II region, i.e. on the phase when the radiation, but not the ionization front, has penetrated into the neutral gas. The early evolution of massive stars and their surrounding ionized gas is much dependent on their accretion history. This has been investigated recently in a number of studies; for references see Haemmerlé & Peters (2016). These authors followed accretion histories of up to 10 years, where in some cases the model did not approach the zero-age main sequence until late, and found that convective pre-main-sequence (PMS) objects may delay the growth of the H II region by up to 10
 years. We schematically explored the consequences of this by assuming a linear growth of the Strömgren radius from an initial value corresponding to L / 10 to L within the time
  , which we varied from 0 to
  yr.
yr.
The assumed overall arrangement of the star, its expanding H II region into an H I region, and the H cloud where cleansing is expected to occur are illustrated in Fig. 3. In our calculations, we alternatively assumed all neutral gas to be molecular, or all to be atomic, with corresponding temperature corrections; see below. In our calculation of the cleansed mass available for new stars we subtracted this ionized gas. From Bisbas et al. (2015), their Eq. (7), we obtain the following mass estimate for the ionized gas
  :
: (25)
(25)
and thus get the reduced cleansed neutral mass  available for star formation as follows:
 (26)
(26)
The composition and fate of the dust in the H II region is an important issue. How much of the dust is destroyed in the hot region, how much is piled up at the border and then gradually pushed into the neutral gas, and how much dust is shot far outside the H II region and maybe even outside the molecular cloud? There have been works carried out on related situations (see e.g. Krumholz & Matzner 2009, Draine 2011a, Martínez-González et al. 2014, Kim et al. 2016), but not explicitly on the effects on the dust density in the gas outside the H II region.
2.5. Gas density and radius of the dust front
Obviously the gas plays an important role in regulating the cleansing effects, primarily through its velocity in the friction term in the equation of motion for the dust (Eq. (8)), but also more indirectly in affecting the density distribution and transporting mass and momentum through gas flows, sound waves, and shocks. Since our interest is focussed on determining an upper limit on the cleansed mass and the drift approximation may be used, we do not need to determine the gas velocity directly; what matters is primarily the local gas density at the dust front, n(t). In order to estimate that we applied the quasi-hydrostatic-equilibrium condition in the gas shell, following (Rahner et al. 2017) as suggested by the observations by Pellegrini et al. (2007). Thus, the gradient of the internal pressure in the gas, P, is assumed to be in equilibrium with the gradient of the deposited radiative momentum per surface area and time unit. For any given time t, we may then obtain the pressure structure by solving (27)
(27)
with the gradient of  from Eq. (20),
 (28)
(28)
We solve Eqs. (13) and (28) together with the proper differential equation (Eqs. (15) or (19)) and with the boundary conditions  ,
,  and the initial condition
  . We combine the solution P(r) with the equation of state to get
  (for values of the temperature T, see Sect. 2.6 below). We find an almost linear increase of log n(t) with log
 , up to a constant value at
  . This is found in practice to be independent on the values of
  , which are set to
  , and of
  . This value,
  is taken as representative for n(t), the density in the dust shell.
We also need to estimate the radius of the dust shell. This is done by noting that the gas pressure should dominate in the warm ionized gas (Lopez et al. 2014) and assuming that the gas pressures on each side of the ionization frontier are close to identical. Thus,  , where
  and
and  are the number density of particles (nuclei and electrons) and temperature, respectively, in the ionized zone and
  and
and  are the corresponding quantities in the neutral zone, extending from the ionization front to the inner border of the dust front. Kim et al. (2016) have shown that the piling up of ionized gas at the ionization front from radiative pressure may increase the thermal pressure at the border by as much as a factor of two or more for high values of L and
  , while the gas gets highly depleted inside the H II region. We find, however that such an increase of
  in our boundary condition only leads to small effects on the calculated cleansed mass. We obtain
 (29)
(29)
where  and
and  are mean molecular weights in the ionized and neutral regions, respectively. From this we find
![Mathematical equation: $ \begin{aligned} r (t) = R_\mathrm{H\,II}(t) \cdot \left[1 + 0.65\cdot \frac{m_\mathrm{{c}}(t)}{m_\mathrm{i}(t)}\frac{T_n}{T_i}\right]^{1/3}, \end{aligned} $](/articles/aa/full_html/2018/08/aa32354-17/aa32354-17-eq171.gif) (30)
(30)
and may thus estimate r(t) from  and
and  as obtained from Eqs. (24) and (25).
2.6. Model
In the model calculations the equation of motion for the dust front as transformed to the equation for the growth of the cleansed mass, alternatively Eqs. (15) and (19) depending on the optical depth, was solved together with the equation for the ionization front, Eq. (24), and its two underlying differential equations; these equations were supplied with the equations for estimating the density, optical depth, and radius of the dust front (Eqs. (27), (28), and (30)). The system of equations is efficiently solved by the Matlab ODE solver ODE23.
In combining the elements discussed above into a relevant model, a number of parameters are to be considered and set:
L: The luminosity of the illuminating bright star (or sum of luminosities for an ensemble of such stars). Values of L ranging from  erg s
erg s to
to  erg s
erg s have been chosen. A flux of
  erg s
erg s corresponds to a main-sequence star of 6–9
 ,
,  erg s
erg s to 14–16
 , and
, and  to 35–80
 , according to the mass-luminosity relations of Salaris & Cassisi (2005) and Eker et al. (2015), see also the evolution for a 60
 model by Groh et al. (2014). If we adopt a Salpeter initial mass function (IMF; Salpeter 1955) with
  , we find that the summed-up luminosity distribution from a young stellar generation peaks at stellar masses of

 , and that the light from stars around that value dominates over that from the much fewer stars with
  40
40 
 . It also follows that the integrated luminosity from 30 000 stars (i.e. of the magnitude, including binaries, suggested by Hurley et al. (2005) to constitute the starting population of the cluster M 67), distributed according to the Salpeter IMF, produces a luminosity of
  erg s
erg s . The strong luminosity increase of the stars in connection with their supernova phases turns out to be of less importance because of the short duration of those as compared with the main-sequence phases; we neglect the effects of the supernova winds, which are not thought to be very selective in their effects on grains relative to gas. The luminosity of an individual star as well as its effective temperature may however vary significantly during the accreting PMS phase with timescales as short as 100–1000 years (cf. Haemmerlé & Peters 2016); this leads to variations in the number of photoionizing photons by about a factor of two, which affects our f parameter.
f: The fraction of the stellar flux that is emitted at wavelengths shorter than 91.2 nm, i.e. that is able to photoionize hydrogen atoms from the ground state. Values chosen here are 0.1 and 0.2, as estimated from the model atmospheres of hot stars by Castelli & Kurucz (2004). We note however that according to the tables supplied by Rahner et al. (2017), values as high as 0.4 may be valid for early stellar populations.
 : The characteristic time for the H II region around the still forming bright star to grow to the initial Strömgren radius. As a standard, we set the parameter to 0, but also explored the effects of setting it to values up to 100 000 years. This, following Haemmerlé & Peters (2016), probably overestimates the effects of the delayed growth of the region.
 : The ending time for the evolution of the model system is set to 6 Myr. During this time the central star/s, after an initial brightening, is assumed to have a constant total luminosity. A value of 6 Myr is significantly longer than the lifetimes of the most massive stars, but since the stars with masses around 20 solar masses collectively contribute most ionizing radiation, and the formation time of such stars in a cluster may be somewhat different, we have chosen this value of
  . Also, we note that the cleansed mass
  tends to level out beyond 1 Myr (see Fig. 5), which makes the choice of
  less significant.
 : The initial density in the gas determines the expansion speeds of the H II region and the dust front and the rate of cleansing,
  . The density of H
 molecules in the cloud, or alternatively of H I if a temperature of 100 K is chosen (see below), is usually estimated to be in the range 10
 –10
–10 cm
cm (Bergin & Tafalla 2007) this range reflects the highly clumpy character of the medium. The various values in this range have been chosen alternatively.
 : The temperature of the neutral gas, alternatively chosen to be 10 and 100 K, for an adopted composition of H
 molecules and H atoms, respectively. The value
  is changed from the mass of one hydrogen molecule to the mass of one hydrogen atom, accordingly. As a standard, we chose the molecular alternative, i.e.
  K and
K and  g, and after that studied the consequences of the alternative choice.
 : The temperature of the gas with fully ionized hydrogen is set to 10 000 K.
 : The gas/dust ratio by mass in star-forming regions is usually set to 100 (see e.g. Liseau et al. 2015) and this value has been chosen here.
 : The mass density of the gas, as normalized on the mass density of hydrogen,
 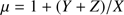 , is set equal to 1.35.
 : The mass density of the dust grains is set to 1.0 g cm
 .
.
The maximum cleansed masses in 6 Myr, as a function of the stellar luminosity, are illustrated for different  in Fig. 4. The time developments of the cleansed mass and radius of the dust front are shown for the various choices of the parameters in Fig. 5.
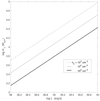 |
Fig. 4. Logarithmic cleansed mass, |


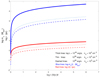 |
Fig. 5. Logarithmic cleansed mass, |


3. Results and discussion
3.1. Results
Figure 5 shows how the rapid growth of  , while the optical depth is small, decelerates when the dust front gets optically thick and then follows Eq. (18). We can easily understand the main behaviour in this figure by approximating r(t) by
  according to the Hosokawa & Inutsuka approximation (see Bisbas et al. 2015, their Eq. (13)) which for
  leads to
 (31)
(31)
Then, we find from the Eqs. (23) and (18) by integration (32)
(32)
and (33)
(33)
which agrees well with the tendencies in Figs. 4 and 5. It is interesting to note that the cleansed mass  is only substantially affected by the density in the cloud via the effects of the initial density
  onto the radius of the ionized region and that an increasing density thus leads to a reduction of
  .
.
A measure of some, but limited, value of the ability for stars to form by gravitational instability out of the cleansed gas would be the thickness of the cleansed shell D relative to the Jeans length,  ,
, (34)
(34)
We have used the last term of Eq. (30) to obtain D and estimated the gas density  as
as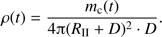 (35)
(35)
The results are illustrated in Fig. 6. It is seen that the thickness of the shell of cleansed gas is relatively small, as compared with the Jeans length, which seems to indicate that effective star formation in this shell may be problematic.
3.2. Discussion
It is clear from the results above that an efficient production of cleansed gas is favoured by a high stellar luminosity L and a relatively low initial gas density  . In order to obtain the observed abundance effect of Meléndez et al. (2009) complete dust cleansing is not necessary; a reduction limited to about 20
 of the refractories relative to volatiles would suffice. Thus, a cleansed mass of just 0.2
 would in principle be sufficient to produce the effect observed for the Sun, relative to solar twins in our neighbourhood in the Galaxy. However, this relaxing circumstance is counterbalanced by the fact that the star-fomation efficiency would probably not be much higher than 20% although local efficiencies of 50% or more cannot be excluded (see e.g. Kim et al. 2016 and references given there).
It is important to consider whether the rough approximations behind the present estimates may have led to severe underestimates of the cleansed masses. One such approximation may be the early evolution of the bright star with a successive brightening instead of, as supposed here, a direct switch on to a given constant L. We tested the effects of a gradual brightening of the star, from 1/10 L to L in  yr, but found only a small effect on the cleansed masses of less than a few percent. The effect of our schematic assumption of all the neutral gas to be molecular and at a low temperature was studied by adopting the alternative choice of atomic gas at 100 K. It was found that the reduction of
  by a factor of two only caused small changes in
  while the increase of the temperature typically reduced
  by a factor of 2.2. This may also be seen directly from Eq. (18). We also considered the possibility that the gas at the dust front and beyond that is molecular, while the cleansed gas is hotter and atomic again with small consequences. More important are the effects of inhomogeneities on the expansion rates of the H II regions, found by Bisbas et al. (2015) to slow the mean expansion by up to 40%. This would lead to a systematic increase of the possible cleansed masses by up to a factor of about 2.
A severe problem for the cleansing mechanism studied here is that mixing may even out the differences of gas to dust ratios between cleansed and uncleansed regions. Turbulence with typical velocities of 1–2 km s is observed in molecular clouds (see Hennebelle & Falgarone 2012 for a review). The extent to which turbulence is generated by self-gravity sooner than the result of, for example radiative feedback, from star-forming activity (for reviews, see Dobbs et al. 2014, Padoan et al. 2014, and also Raskutti et al. 2016) is still not clear. However, there are observational indications that turbulence may be strong in regions of a cloud in the early phases of star formation and even be the result of gravitational collapse (see Palau et al. 2015). It may also be driven by Rayleigh–Taylor and Kelvin–Helmholtz instabilities resulting from large-scale flows when the bubble of H II gas collides with the surrounding dense molecular gas; see Ochsendorf et al. (2014). Such turbulence could be assumed to erase the effects of radiative cleansing and fractionation discussed in this work; the velocities caused by the latter effects are about one to two orders of magnitude less than the observed turbulent velocities. As shown in Fig. 7, the drift velocities are only higher than 0.1 km s
 in the very first phases, that is when
  is less than
  of its final value, the mass of the dust in the dust front is small and the front is close to the radiatively accelerating star/s. It is clear from the Figure that the highest drift velocities, which could perhaps compete with the turbulent mixing, would be in the high-luminosity low-density case, where
  . If the dusty gas were still optically thin high velocities could possibly be expected even after a considerable gas mass were cleansed. Applying Eqs. (2), (3) and (4) it is easy to see that the key factor is
  where d is the distance from the star/s to the dust grain. Setting
  we find from Fig. 8 that
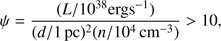 (36)
(36)
is the condition for  to be equal or greater than 1 km s
 in the optically thin case, for both the case of cool molecular and a somewhat hotter atomic hydrogen gas. Obviously, this condition on
  may be fulfilled, for example by the early M 67 cloud in which L may have been about
  , and in particular if n had been small.
However, the requirement of a small optical depth is indeed not met for this scenario. In order to obtain a satisfactory yield of cleansed gas to explain the M 67 abundances, we find from Eq. (20) that 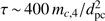 , where
  is the cleansed gas mass in units of
  solar masses. This estimate brings us back to the estimates made above for optically thick dust fronts. Obviously, it is impossible to meet both the requirements of a high drift velocity of the order of 1 km s
 and a high cleansed mass.
The question is then whether the small drift velocities, and the observed high turbulence velocities, make the radiative cleansing hypothesis untenable. If the minimum spatial scale of the turbulence is significantly smaller than our typical values of the thickness of the cleansed gas shell D, of the order of 10 000 au in typical cases, the cleansing is inhibited or at least reduced considerably. Although the spacial resolution in the observations are limited, there are no signs in present data suggesting that this turbulence would be confined to large scales. Instead, contemporary simulations suggest smaller scales (Seifried et al. 2017).
It remains to explore whether efficient small-scale mixing close to the dust front, and further successive small-scale mixing in the cleansed gas would be able to totally inhibit the effects of the cleansing.
The Giant Molecular Clouds are known to have complex structures that have dense clumps of H gas interfoliated with regions with cool molecular gas with much lower densities (see further Hennebelle & Falgarone 2012). If such a cloud is exposed to hot stellar radiation, the less dense regions may be rapidly cleansed. It can be argued that the inhomogeneities, including those in the dust distribution (cf. e.g. Hopkins & Lee 2016) could lead to instabilities in the neutral gas that could possibly amplify the radiative cleansing. Instabilities of various types are known to occur during the evolution of H II regions, not the least at their outer boundaries (Garcia-Segura & Franco 1996, Whalen & Norman 2008a,b). Of a certain interest are the “resonant drag instabilities” (RDIs) of dust-gas mixtures (Squire & Hopkins 2018), which are unstable at a wide range of spatial scales and rapidly growing, in particular when the phase velocity of a wave in the gas agrees with the drift velocity component along that wave propagation vector (Hopkins & Squire 2018a). As pointed out by the referee of the present paper, these instabilities might affect the degrees of radiative cleansing. It should be noted, however, that the cleansed gas borders the dust front which in itself is very over-rich in dust. It remains to study how great variations in the gas to dust ratio that may occur in these regions, and in particular what the possibilities are for dust-cleansed gas to remain so.
An argument against the effects of turbulent mixing of a cleansed and a more dust-rich gas could be the existence of magnetic fields in the gas. If the fields were structured perpendicularly relative to the direction towards the illuminating stars, the fields could hamper turbulence provided that the ionization of the gas is non-negligible. However, such fields would also reduce the drift of the photoelectrically charged dust grains and thus diminish radiative cleansing considerably; see Draine (2011a). As recently shown by Hopkins & Squire (2018b), the wealth of the newly discovered RDIs in magnetized dusty gases may, however, lead to modifications of this conclusion due to more or less vastly growing magneto-sonic RDIs. At any rate, the inhomogeneities and local instabilities discussed in this work would probably not contribute a systematic global dust cleansing of as much mass as needed for a cluster such as M 67.
An interesting issue is whether the small possibilities for global radiative cleansing could be increased by a second gravitational collapse of the star-forming cloud, such as that which may have affected the core of 30 Doradus where two different star generations have been found (Sabbi et al. 2012). Rahner et al. (2017) have studied the circumstances under which re-collapse may occur and found that the star-formation efficiency must be below a few percent for low-mass clouds and below about 25% for clouds with masses of the order of 

 to prevent stellar feedback due to the first generation of stars from totally dispersing the cloud. The characteristic time from a star-forming episode to the next would be of the order of some free-fall times (i.e. 3–6 Myr). If we could assume that the large-scale spherical symmetry could survive these episodes, such that the dust shell is not fully mixed into the collapsing cleansed gas within it, we might envisage a gradual dust-cleansing in several steps. For this to work, however, the effects of turbulence must again be limited. It is highly questionable whether this is possible. Certainly, during a collapse the drift speed increases with the decreasing distance d to the cloud centre in proportion to
  , but it also decreases with an increasing gas density
  ; at a uniform contraction this gas density dependence combines with the
  dependence to a linear dependence of the drift speed on d (cf. Eq. (1)). Thus, the drift speed in a cloud contracting towards newly formed stars in fact decreases to values far below turbulence velocities of the order of 1 km s
 .
.
 |
Fig. 6. Ratio of the thickness of the cleansed shell relative to the Jeans length, |


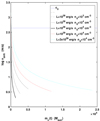 |
Fig. 7. Logarithmic drift velocity |


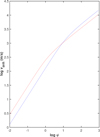 |
Fig. 8. Logarithmic drift velocity in m s |


4. Conclusions
Using simple arguments, essentially based on momentum conservation in a dusty neutral and homogeneous gas affected by radiative pressure from nearby hot stars, we have demonstrated that radiative cleansing of star-forming clouds might in principle explain composition differences between some single stars, such as the Sun as compared with solar twins. However, as shown in Fig. 6 the cleansed gas shell is so geometrically thin that considerable inhomogeneities are needed to induce gravitational instabilities of cleansed gas. In order to produce such abundance effects for a large percentage of stars in a rich cluster, such as those observed for M 67 (Önehag et al. 2011, 2014) an unrealistic radiative flux is required. As discussed above, the luminosity of all the cluster stars in its youth is expected to be about  erg/s. This may produce, following the results presented in Fig. 5, well-cleansed gas for maximally a few thousand stars. To this we should also apply the modifications due to the limits of 20% cleansing observed for the refractory elements and the counteracting star-forming efficiency discussed above. Another difficulty is posed by the relative chemical homogeneity found for the 14 cluster members measured by Önehag et al. (2014). It is hard to understand why the progression of the dust front in a molecular cloud, surrounding a massive association of hot and bright stars, would leave behind a gas that is systematically cleansed from dust and corresponding heavy elements to the observed degree. One order of magnitude more extensive cleansing than found in the present study is needed, or even more than that, since our estimates are believed to give upper boundaries to the real effects. We must conclude that the mechanism discussed in this work does not explain the composition of M 67. Also, shocks with density fluctuations, magnetic fields, and not the least turbulence should reduce the cleansing very considerably. The drift speeds of the dust relative to the gas in most of our models are an order of magnitude smaller than the observed turbulence velocities., which also casts considerable doubt on whether this is the real explanation for the odd solar composition.
More detailed 3D hydrodynamical simulations of dust cleansing at the rim of expanding H II regions with due consideration of shocks and instabilities would be interesting. We do not, however, consider it probable that such simulations will lead to results that enhance the cleansing effects enough to explain our observations of M 67. The present result urges continued detailed studies of accurate stellar abundances in M 67 and other rich clusters to verify our present observational finding of global enhancement of volatile elements (or missing refractories) in the cluster relative to the majority of field stars.
Looking back at the development of this line of research, our finding in itself may be reflected on with some irony. The discovery of the solar-composition peculiarity by Meléndez et al. (2009) stimulated various proposed explanations. One of these was the dust-cleansing hypothesis, which, in fact, was the reason for our decision to study M 67 in detail. We then thought that a demonstration of solar-like abundance anomalies for the cluster would be a clear indication that the solar composition is the result of dust cleansing. The anomaly was indeed found for the cluster by Önehag et al. (2011 and 2014) and later verified by Liu et al. (2016). But this fact, we now find, does not verify the hypothesis but just elicits further questions. It turns out to be too difficult to cleanse enough of gas to get a sufficiently cleansed protocluster of this magnitude. So, we cannot explain the composition of M 67, as the result of self-cleansing of the gas by the first hot stars in the forming cluster. Other possibilities, like those of the chemo-dynamical evolution of the Galaxy, have to be considered further.
Since the discovery by Meléndez et al. (2009), a trend contrary to the more or less uniform tendency for dust depletion of the M 67 stars has been discovered: several physical binary stars show significant abundance differences between their ingoing components and differences for the various elements are correlated with the condensation temperature of the element in several cases. Notable such cases are the binaries 16 Cyg (Tucci Maia et al. 2014, Nissen et al. 2017), XO-2N/XO-2S (Ramírez et al. 2015, Biazzo et al. 2015), WASP 94 A/B (Teske et al. 2016a), HD 133131 A/B (Teske et al. 2016b), HAT-P-4 (Saffe et al. 2017), and the co-moving pair HD 240430/HD 1240429 (Oh et al. 2018). These findings certainly suggest more local effects than those explored here for M 67. They are not in total disagreement with the hypothesis of dust cleansing by bright stars; the results of the present study indicate that if such cleansing occurs, it would be more local as a result of the thinness of the cleansed shell that is probably deformed by instabilities. Turbulent dust or gas separation, such as that discussed by Liu et al. (2016), may possibly also play a role here. Some further efforts should thus be spent on modelling the possible cleansing of individual smaller gas clouds, like the protosolar cloud, by neighbouring hot stars. Similar simulations, in 3D with proper treatment of instabilities in the neighbourhood of the HII front and its preceding shock front expanding into a clumpy molecular cloud, are already carried out by several groups, but might also include the radiative fields and turbulence and their effects on the dust drift to illuminate cleansing possibilities.
Other suggested reasons for the odd solar atmospheric composition, such as those presented in Sect. 1 including the early suggested planetary connection and the possibility of radiative self-cleansing from dust by protostars of their late accretion flows, should be further scrutinized.
Acknowledgments
Bengt Edvardsson, Kjell Eriksson, Bernd Freytag, Anders Johansen, Lars Mattsson, Jorge Meléndez, Dhruba Mitra, Poul Erik Nissen, and an unknown referee are thanked for many valuable suggestions and Amy Mednick for comments on the language of the manuscript.
References
- Adams, F. C. 2010, ARA&A, 48, 47 [NASA ADS] [CrossRef] [Google Scholar]
- Adibekyan, V. Z., González Hernández, J. I., Delgado Mena, E., et al. 2014, A&A, 564, L15 [NASA ADS] [CrossRef] [EDP Sciences] [Google Scholar]
- Adibekyan, V., Delgado-Mena, E., Feltzing, S., et al. 2017, Astron. Nachr., 338, 442 [NASA ADS] [CrossRef] [Google Scholar]
- Akimkin, V. V., Kirsanova, M. S., Pavlyuchenkov, Y. N., & Wiebe, D. S. 2015, MNRAS, 449, 440 [NASA ADS] [CrossRef] [Google Scholar]
- Akimkin, V. V., Kirsanova, M. S., Pavlyuchenkov, Y. N., & Wiebe, D. S. 2017, MNRAS, 469, 630 [NASA ADS] [Google Scholar]
- Arthur, S. J., Kurtz, S. E., Franco, J., & Albarrán, M. Y. 2004, ApJ, 608, 282 [NASA ADS] [CrossRef] [Google Scholar]
- Baraffe, I., & Chabrier, G. 2010, A&A, 521, A44 [NASA ADS] [CrossRef] [EDP Sciences] [Google Scholar]
- Bergin, E. A., & Tafalla, M. 2007, ARA&A, 45, 339 [NASA ADS] [CrossRef] [Google Scholar]
- Biazzo, K., Gratton, R., Desidera, S., et al. 2015, A&A, 583, A135 [NASA ADS] [CrossRef] [EDP Sciences] [Google Scholar]
- Bisbas, T. G., Haworth, T. J., Williams, R. J. R., et al. 2015, MNRAS, 453, 1324 [NASA ADS] [CrossRef] [MathSciNet] [Google Scholar]
- Castelli, F., & Kurucz, R. L. 2004, ArXiv e-prints [arXiv:astro-ph/0405087] [Google Scholar]
- Casuso, E., & Beckman, J. E. 2010, AJ, 139, 1406 [NASA ADS] [CrossRef] [Google Scholar]
- Cochran, W. D., & Ostriker, J. P. 1977, ApJ, 211, 392 [NASA ADS] [CrossRef] [Google Scholar]
- Diaz-Miller, R. I., Franco, J., & Shore, S. N. 1998, ApJ, 501, 192 [NASA ADS] [CrossRef] [Google Scholar]
- Dobbs, C. L., Krumholz, M. R., Ballesteros-Paredes, J., et al. 2014, Protostars and Planets VI, 3 [Google Scholar]
- Draine, B. T. 2011a, ApJ, 732, 100 [NASA ADS] [CrossRef] [Google Scholar]
- Draine, B. T. 2011b, Physics of the Interstellar and Intergalactic Medium [Google Scholar]
- Eker, Z., Soydugan, F., Soydugan, E., et al. 2015, AJ, 149, 131 [NASA ADS] [CrossRef] [Google Scholar]
- Franco, J., Tenorio-Tagle, G., & Bodenheimer, P. 1990, ApJ, 349, 126 [NASA ADS] [CrossRef] [Google Scholar]
- Franco, J., Ferrini, F., Barsella, B., & Ferrara, A. 1991, ApJ, 366, 443 [NASA ADS] [CrossRef] [Google Scholar]
- Fujimoto, Y., Krumholz, M. R., & Tachibana, S. 2018, MNRAS, in press, DOI:10.1093/mnras/sty2132 [Google Scholar]
- Garcia-Segura, G., & Franco, J. 1996, ApJ, 469, 171 [NASA ADS] [CrossRef] [Google Scholar]
- Gonzalez, G., Carlson, M. K., & Tobin, R. W. 2010, MNRAS, 407, 314 [NASA ADS] [CrossRef] [Google Scholar]
- Groh, J. H., Meynet, G., Ekström, S., & Georgy, C. 2014, A&A, 564, A30 [NASA ADS] [CrossRef] [EDP Sciences] [Google Scholar]
- Gustafsson, B., Meléndez, J., Asplund, M., & Yong, D. 2010, Ap&SS, 328, 185 [NASA ADS] [CrossRef] [Google Scholar]
- Haemmerlé, L., & Peters, T. 2016, MNRAS, 458, 3299 [NASA ADS] [CrossRef] [Google Scholar]
- Hennebelle, P., & Falgarone, E. 2012, A&ARv., 20, 55 [NASA ADS] [CrossRef] [Google Scholar]
- Hopkins, P. F., & Lee, H. 2016, MNRAS, 456, 4174 [NASA ADS] [CrossRef] [Google Scholar]
- Hopkins, P. F., & Squire, J. 2018a, MNRAS, 480, 2813 [NASA ADS] [CrossRef] [Google Scholar]
- Hopkins, P. F., & Squire, J. 2018b, MNRAS, 479, 4681 [NASA ADS] [CrossRef] [Google Scholar]
- Hurley, J. R., Pols, O. R., Aarseth, S. J., & Tout, C. A. 2005, MNRAS, 363, 293 [NASA ADS] [CrossRef] [Google Scholar]
- Kim, J.-G., Kim, W.-T., & Ostriker, E. C. 2016, ApJ, 819, 137 [NASA ADS] [Google Scholar]
- Krumholz, M. R., & Matzner, C. D. 2009, ApJ, 703, 1352 [NASA ADS] [CrossRef] [Google Scholar]
- Liseau, R., Larsson, B., Lunttila, T., et al. 2015, A&A, 578, A131 [NASA ADS] [CrossRef] [EDP Sciences] [Google Scholar]
- Liu, F., Asplund, M., Yong, D., et al. 2016, MNRAS, 463, 696 [NASA ADS] [CrossRef] [Google Scholar]
- Lopez, L. A., Krumholz, M. R., Bolatto, A. D., et al. 2014, ApJ, 795, 121 [NASA ADS] [CrossRef] [Google Scholar]
- Maldonado, J., & Villaver, E. 2016, A&A, 588, A98 [NASA ADS] [CrossRef] [EDP Sciences] [Google Scholar]
- Maldonado, J., Eiroa, C., Villaver, E., Montesinos, B., & Mora, A. 2015, A&A, 579, A20 [NASA ADS] [CrossRef] [EDP Sciences] [Google Scholar]
- Martínez-González, S., Silich, S., & Tenorio-Tagle, G. 2014, ApJ, 785, 164 [NASA ADS] [CrossRef] [Google Scholar]
- Mathews, W. G. 1967, ApJ, 147, 965 [NASA ADS] [CrossRef] [Google Scholar]
- Mathis, J. S., Rumpl, W., & Nordsieck, K. H. 1977, ApJ, 217, 425 [NASA ADS] [CrossRef] [Google Scholar]
- Meléndez, J., Asplund, M., Gustafsson, B., & Yong, D. 2009, ApJ, 704, L66 [NASA ADS] [CrossRef] [Google Scholar]
- Nissen, P. E. 2015, A&A, 579, A52 [NASA ADS] [CrossRef] [EDP Sciences] [Google Scholar]
- Nissen, P. E., Silva Aguirre, V., Christensen-Dalsgaard, J., et al. 2017, A&A, 608, A112 [NASA ADS] [CrossRef] [EDP Sciences] [Google Scholar]
- Ochsendorf, B. B., Verdolini, S., Cox, N. L. J., et al. 2014, A&A, 566, A75 [NASA ADS] [CrossRef] [EDP Sciences] [Google Scholar]
- Oh, S., Price-Whelan, A. M., Brewer, J. M., et al. 2018, ApJ, 854, 138 [NASA ADS] [CrossRef] [Google Scholar]
- Önehag, A., Korn, A., Gustafsson, B., Stempels, E., & Vandenberg, D. A. 2011, A&A, 528, A85 [NASA ADS] [CrossRef] [EDP Sciences] [Google Scholar]
- Önehag, A., Gustafsson, B., & Korn, A. 2014, A&A, 562, A102 [NASA ADS] [CrossRef] [EDP Sciences] [Google Scholar]
- Padoan, P., Federrath, C., Chabrier, G., et al. 2014, Protostars and Planets VI, 77 [Google Scholar]
- Palau, A., Ballesteros-Paredes, J., Vázquez-Semadeni, E., et al. 2015, MNRAS, 453, 3785 [NASA ADS] [CrossRef] [Google Scholar]
- Pellegrini, E. W., Baldwin, J. A., Brogan, C. L., et al. 2007, ApJ, 658, 1119 [NASA ADS] [CrossRef] [Google Scholar]
- Rahner, D., Pellegrini, E. W., Glover, S. C. O., & Klessen, R. S. 2017, MNRAS, 470, 4453 [NASA ADS] [CrossRef] [Google Scholar]
- Ramírez, I., Meléndez, J., & Asplund, M. 2009, A&A, 508, L17 [NASA ADS] [CrossRef] [EDP Sciences] [Google Scholar]
- Ramírez, I., Khanal, S., Aleo, P., et al. 2015, ApJ, 808, 13 [NASA ADS] [CrossRef] [Google Scholar]
- Raskutti, S., Ostriker, E. C., & Skinner, M. A. 2016, ApJ, 829, 130 [NASA ADS] [CrossRef] [Google Scholar]
- Sabbi, E., Lennon, D. J., Gieles, M., et al. 2012, ApJ, 754, L37 [NASA ADS] [CrossRef] [Google Scholar]
- Saffe, C., Jofré, E., Martioli, E., et al. 2017, A&A, 604, L4 [NASA ADS] [CrossRef] [EDP Sciences] [Google Scholar]
- Salaris, M., & Cassisi, S. 2005, Evolution of Stars and Stellar Populations, 400 [CrossRef] [Google Scholar]
- Salpeter, E. E. 1955, ApJ, 121, 161 [Google Scholar]
- Schalén, C. 1939, ZAp, 17, 260 [NASA ADS] [Google Scholar]
- Seifried, D., Walch, S., Girichidis, P., et al. 2017, MNRAS, 472, 4797 [NASA ADS] [CrossRef] [Google Scholar]
- Shu, F. H., Lizano, S., Galli, D., Cantó, J., & Laughlin, G. 2002, ApJ, 580, 969 [NASA ADS] [CrossRef] [Google Scholar]
- Skinner, M. A., & Ostriker, E. C. 2015, ApJ, 809, 187 [NASA ADS] [CrossRef] [Google Scholar]
- Spina, L., Meléndez, J., & Ramírez, I. 2016, A&A, 585, A152 [NASA ADS] [CrossRef] [EDP Sciences] [Google Scholar]
- Spitzer, Jr., L. 1941, ApJ, 94, 232 [NASA ADS] [CrossRef] [Google Scholar]
- Squire, J., & Hopkins, P. F. 2018, MNRAS, 477, 5011 [NASA ADS] [CrossRef] [Google Scholar]
- Strömgren, B. 1939, ApJ, 89, 526 [NASA ADS] [CrossRef] [Google Scholar]
- Teske, J. K., Khanal, S., & Ramírez, I. 2016a, ApJ, 819, 19 [NASA ADS] [CrossRef] [Google Scholar]
- Teske, J. K., Shectman, S. A., Vogt, S. S., et al. 2016b, AJ, 152, 167 [NASA ADS] [CrossRef] [Google Scholar]
- Tucci Maia, M., Meléndez, J., & Ramírez, I. 2014, ApJ, 790, L25 [NASA ADS] [CrossRef] [Google Scholar]
- Walch, S. K., Whitworth, A. P., Bisbas, T., Wünsch, R., & Hubber, D. 2012, MNRAS, 427, 625 [NASA ADS] [CrossRef] [Google Scholar]
- Whalen, D., & Norman, M. L. 2008a, ApJ, 673, 664 [NASA ADS] [CrossRef] [Google Scholar]
- Whalen, D. J., & Norman, M. L. 2008b, ApJ, 672, 287 [NASA ADS] [CrossRef] [Google Scholar]
All Figures
|
Fig. 1. Motion of a stack of 100 dust sheets, initially extending across 50 au, moving as a result of perpendicular radiative pressure (from below in the figure) through a homogeneous gas. The motions of small ( |
| In the text | |
|
Fig. 2. Dust density in the dust front shown in Fig. 1, at 9 different consecutive times with intervals between them of 50 kyr for two different grain sizes. |
| In the text | |
|
Fig. 3. Schematic picture of our model. The bright star(s) is located in the middle, surrounded by the expanding H II region with radius |
| In the text | |
|
Fig. 4. Logarithmic cleansed mass, |
| In the text | |
|
Fig. 5. Logarithmic cleansed mass, |
| In the text | |
|
Fig. 6. Ratio of the thickness of the cleansed shell relative to the Jeans length, |
| In the text | |
|
Fig. 7. Logarithmic drift velocity |
| In the text | |
|
Fig. 8. Logarithmic drift velocity in m s |
| In the text | |
Current usage metrics show cumulative count of Article Views (full-text article views including HTML views, PDF and ePub downloads, according to the available data) and Abstracts Views on Vision4Press platform.
Data correspond to usage on the plateform after 2015. The current usage metrics is available 48-96 hours after online publication and is updated daily on week days.
Initial download of the metrics may take a while.