| Issue |
A&A
Volume 615, July 2018
|
|
|---|---|---|
| Article Number | A142 | |
| Number of page(s) | 6 | |
| Section | Extragalactic astronomy | |
| DOI | https://doi.org/10.1051/0004-6361/201732560 | |
| Published online | 27 July 2018 | |
Extreme conditions in the molecular gas of lensed star-forming galaxies at z ~3★
1
European Southern Observatory,
Karl-Schwarzschild-Straße 2,
85748
Garching,
Germany
e-mail: This email address is being protected from spambots. You need JavaScript enabled to view it.
2
Leiden Observatory, Leiden University,
PO Box 9513,
2300 RA,
Leiden,
The Netherlands
e-mail: This email address is being protected from spambots. You need JavaScript enabled to view it.
3
Institute of Astronomy, University of Edinburgh, Royal Observatory,
Blackford Hill,
Edimburgh EH9 3HJ,
UK
4
Department of Physics, Section of Astrophysics, Astronomy and Mechanics, Aristotle University of Thessaloniki,
Thessaloniki,
Macedonia
54124,
Greece
5
Research Center for Astronomy, Academy of Athens,
Soranou Efesiou 4,
115 27 Athens,
Greece
6
School of Physics and Astronomy, Cardiff University, Queen’s Buildings,
The Parade,
Cardiff, CF24 3AA,
UK
7
European Southern Observatory, Alonso de Cordova, 3107, Vitacura,
Casilla 19001,
Santiago de Chile,
Chile
8
Max-Planck Institut für Astrophysik, Boltzmann strasse,
85748
Garching,
Germany
Received:
28
December
2017
Accepted:
22
March
2018
Abstract
Context. Atomic carbon can be an efficient tracer of the molecular gas mass, and when combined to the detection of high-J and low-J CO lines it yields also a sensitive probe of the power sources in the molecular gas of high-redshift galaxies.
Aims. The recently installed SEPIA 5 receiver at the focus of the APEX telescope has opened up a new window at frequencies 159–211 GHz allowing the exploration of the atomic carbon in high-z galaxies, at previously inaccessible frequencies from the ground. We have targeted three gravitationally lensed galaxies at redshift of about 3 and conducted a comparative study of the observed high-J CO/CI ratios with well-studied nearby galaxies.
Methods. Atomic carbon (CI(2–1)) was detected in one of the three targets and marginally in a second, while in all three targets the J = 7→6 CO line is detected.
Results. The CO(7–6)/CI(2–1), CO(7–6)/CO(1–0) line ratios and the CO(7–6)/(far-IR continuum) luminosity ratio are compared to those of nearby objects. A large excitation status in the ISM of these high-z objects is seen, unless differential lensing unevenly boosts the CO line fluxes from the warm and dense gas more than the CO(1–0), CI(2–1), tracing a more widely distributed cold gas phase. We provide estimates of total molecular gas masses derived from the atomic carbon and the carbon monoxide CO(1–0), which within the uncertainties turn out to be equal.
Key words: galaxies: starburst / galaxies: ISM / ISM: molecules / ISM: abundances / submillimeter: galaxies / techniques: spectroscopic
The reduced datacubes (FITS files) are only available at the CDS via anonymous ftp to cdsarc.u-strasbg.fr (130.79.128.5) or via http://cdsarc.u-strasbg.fr/viz-bin/qcat?J/A+A/615/A142
© ESO 2018
1 Introduction
The initial conditions of star formation inside molecular clouds are set by the gas temperature, density, dynamical state, and the local radiation field because they determine the free-fall time and the Jeans mass. Understanding these conditions is essential to fully understand the physics that drives the bulk of the star formation, especially during the early phase of the Universe.
Atomic carbon (CI) forbidden fine-structure lines1 have been proven to be a good tracer of total molecular gas (H2), even better than rotational transitions of carbon monoxide (CO) employed by traditional studies under a wide range of physical conditions (Gerin & Phillips 2000; Papadopoulos et al. 2004; Tomassetti et al. 2014). They have emergent flux densities per H2 column density higher than those of the low-CO rotational lines even at low metallicity and they are fully concomitant with CO line emission (Gerin & Phillips 2000; Papadopoulos et al. 2004; Alaghband-Zadeh et al. 2013).
There is a positive K-correction of the two CI lines versus the low-J CO transitions, yet their similar excitation characteristics start giving an advantage to the former at z≳0.5. CI lines can remain well-excited for cooler, lower density molecular gas. This allows the use of CI lines as tracers of the molecular gas mass and gas-rich galaxy dynamics over a much larger fraction of cosmic look-back time. Finally, they are optically thin (i.e. there is no need for an XCO-like factor), with only the [C/H2] abundance as their main source of uncertainty (an uncertainty common to all species that are not H2, e.g., 13CO lines or dust emission as H2 gas mass estimators).
The two high-J CO lines with frequencies similar to the CI lines (J = 4–3, 7–6) are typically bright in star-forming galaxies, but only trace the dense and warm H2 gas near star-forming regions, while the low-J CO and CI lines remain bright in relatively diffuse (103 cm−3) and colder (~10–30 K) gas phases. Furthermore, it is known that C is not limited only to a thin C→ CO transition zone of far-UV (FUV) illuminated clouds, as predicted by photon dissociation region (PDR) models, but remains concomitant with the entire CO-rich cloud, and its distribution may actually even go beyond the CO-rich parts (e.g. Papadopoulos et al. 2004; Bisbas et al. 2015). Thus, CO(high-J)/ CI line luminosity ratios can be considered good proxies of the (warm, dense, star-forming gas)/(total H2 gas) mass fraction, even as degeneracies between temperature, density, and line optical depths prevent us from attributing actual mass fractions to these line ratios.
Finally, although the emission of singly ionised carbon fine structure transition, CII, is much brighter than CI, and has already been detected in high-z galaxies (z ~ 5–7; e.g. De Breuck et al. 2014; Knudsen et al. 2016; Hayatsu et al. 2017; Bradac et al. 2017), its emission traces ionised gas (HII) and atomic gas (HI) dominated regions, making the interpretation as H2 gas mass distribution tracer cumbersome.
At very high redshifts CI lines are also much less affected by the cosmic microwave background than the low-J CO lines (Zhang et al. 2016). Moreover, the CI abundance is less sensitive to the astrochemical effects of enhanced cosmic ray (CR) densities expected in starbursts (e.g. submillimetre galaxies; SMGs) (Bisbas et al. 2015). CRs can effectively destroy CO throughout H2 clouds, leaving C (but not much CII), and unlike FUV photons that only act on the surface of the H2 clouds and produce CII, CRs destroy CO volumetrically and can make the clouds CO-invisible (Bisbas et al. 2017).
At redshifts z ~2–4, the CI lines are redshifted into observable windows from the ground. Several galaxies have been observed (Pety et al. 2004; Weiss et al. 2005; Walter et al. 2011; Alaghband-Zadeh et al. 2013; Omont et al. 2013; Yang et al. 2017; Bothwell et al. 2017; Popping et al. 2017, and references therein), showing that the SMGs share properties with local ultraluminous infrared galaxies and with less compact, local starburst galaxies, providing new evidence that many SMGs have extended star formation distributions. The total molecular mass inferred from these CI observations was found to be in disagreement with that obtained via the traditional conversion factor between CO mass and H2 (e.g. Popping et al. 2017).
Here we report the observations of CI(2–1) and the CO(7–6) lines towards three z ~ 3 lensed SMGs redshifted into the side bands of the ALMA Band 5 receiver installed at the APEX telescope, and offered to the science community since 2015. These targets have been selected from the HATLAS catalogue of bright submillimetre lensed objects (Bussmann et al. 2013) because of their brightness and their spectroscopic redshift, which allows the observations of the CI(2–1) within the SEPIA 5 receiver bandwidth.
2 SEPIA5/APEX observations
The observations were carried out with the SEPIA Band 5 receiver (Belitsky et al. 2018) at the Atacama Pathfinder EXperiment (APEX; Güsten et al. 2006). The receiver covers the frequency range 159–211 GHz. The lower and upper sidebands (LSB and USB) are separated by 12 GHz, and each sideband is recorded by two eXtended bandwidth fast fourier transform spectrometer (XFFTS) units of 2.5 GHz each, with a 1 GHz overlap.
The spectra have been smoothed to a spectral resolution of 20 km s−1 and the beam size is 35′′. We use a Jy/K factor of 34 to convert between antenna temperature  and flux density assuming point sources 2 (Billade et al. 2012; Immer et al. 2016).
We conducted observations towards G12v2.43 during science verification (Project ID: 095.F-9803; PI: Andreani) and then for all the three sources during normal PI observing time using the wobbler switch mode with precipitable water vapour (pwv) between 0.4 and 1.8 mm. The observations were carried out for a total time of 9.6 h, with 1, 2, 1.5 h on source. Pointings were regularly checked on RW-LMi and IRC+10216, and a calibration scan was taken every 10 min. Data were reduced using CLASS/Gildas2. The SEPIA receiver was tuned at 189.3906, 195.42896, and 196.2085 GHz in the LSB, respectively. This corresponds to the redshifted frequencies between the two restframe frequencies 809.3 and 806.65 GHz of the CI(2–1) and CO(7–6) lines.
We removed a linear baseline from each individual spectrum before averaging the data. The rms reached are 1.0, 0.33, 0.7 mK, respectively, at a 50 km s−1 resolution.
3 Results
3.1 Line ratio diagnostics
The spectra extracted from the SEPIA5 receiver are shown in Fig. 1. The CO(7–6) line is clearly detected in all three sources and the corresponding fluxes and linewidths resulting from the Gaussian best fit are listed in Table 1.
The CI(2–1) line is detected at a 4σ level in G12v2.30, marginally (~2σ) in NBv1.78 and not detected in G12v2.43. The corresponding fluxes or upper limits and linewidths are listed in Table 1, together with the CO(1–0) fluxes taken from Harris et al. (2012), CO(3–2) in NBv1.78 flux from Omont et al. (2013), the IR luminosities and magnification values from Zhang et al. (in prep.).
We use the line luminosity ratios  and
and  as proxies for the ratio of the warm (T ~ 100−150 K), dense (n > 104 cm−3) gas mass, MWD, to the total H2 gas, Mtot(H2), MWD∕Mtot(H2) mass fractions. Because the line radiative transfer model degeneracies prevent the computation of actual mass fractions, we use other galaxy-averaged ratios to place the gas conditions in the submm galaxies in perspective, and even examine whether the observed line ratios are compatible with only FUV photon-driven energy sources for their ISM. This is important since PDRs have often been found inadequate to account for the global CO line excitation measured in many starbursts (Papadopoulos et al. 2012, and references therein). In placing our observed line ratios among the same ones measured for other galaxies with much more molecular and atomic line data allow a determination of their MWD∕Mtot(H2) mass fractions (and whether these are sustainable by FUV radiation fields), we can circumvent to some degree the above-mentioned radiative transfer modelling uncertainties (which we do not attempt here), and examine the type of prevailing ISM power source in our galaxies as well.
In Fig. 2 we compare the ratio  between the line luminosities in K km s−1pc2 for the sources listed in Table 1 with the same values for nearby galaxies (Kamenetzky et al. 2014; Rosenberg et al. 2015; Lu et al. 2017; Kamenetzky et al. 2017). For the extended objects we consider those whose fluxes are aperture-corrected (Kamenetzky et al. 2014). The CO line luminosity has been computed following Solomon et al. (1997). We add in Fig. 2 the corresponding values of the Milky Way taken from the COBE observations for the Galactic centre (GC; Fixsen et al. 1999). The corresponding values of similar lensed sources taken from the literature (Walter et al. 2011; Oteo et al. 2017; Yang et al. 2017) are also shown for comparison.
The histogram in Fig. 2 can be used to examine the dominant power input of molecular gas reservoirs, whether it is provided by FUV photons or dominated by some other mechanisms (e.g. CRs and/or turbulence). In Fig. 2 we add a dashed black vertical line splitting the values of the  ratio between galaxies where other evidence demonstrated photon-heated molecular gas (low values), and objects with large ratios like the GC, the NGC253 nucleus and NGC 6240, systems where extensive studies of well-sampled molecular SLEDs concluded non-FUV photon-driven power sources for their molecular gas reservoirs.
We detect a slight trend with the IR luminosity, i.e. lower  are associated with galaxies with lower L(IR): values between 7 and 20 for luminous infrared galaxies (LIRGs) with L(IR) > 11.5 L⊙, values between 2 and 7 for IRGs with <11.0 < L(IR) < 11.5 L⊙, and lower values for galaxies with L(IR) < 11.0 L⊙. The targeted lenses are characterised by large values of the
  ratio and have intrinsic IR luminosity, L(IR) ≥ 1013L⊙. G12v2.43 has a
  value similar to the local starbursts and the Galactic centre, while the same ratio for the two other lenses is extreme and shows even more extreme conditions than ultraluminous IR galaxies (ULIRGs). We note that the value shown in Fig. 2 for NBv1.78 is actually
  , still sensitive to total (warm, dense)/totalH2 gas mass, but the corresponding actual
  can be lower by a factor of up to ~3, depending of the global CO(3–2)/(1–0) line ratio (~0.3 for cold non-star-forming gas).
Low values of the CO ratios are typical of low-infrared luminosity star-forming galaxies whose CO SLEDs are consistent with excitation by either photon-dissociation regions (PDRs) or mechanical excitation processes such as shocks and turbulence (Papadopoulos et al. 2012; Kamenetzky et al. 2017, and references therein). In more luminous galaxies, LIRGs and brighter, this ratio and the entire CO SLED, often cannot be explained solely by PDRs because the ratio of the brightness of the high-J CO lines to lower-J lines would be too low without extreme densities, n > 105 cm−3, and the far-infrared emission would be too faint given the CO line luminosities. Kamenetzky et al. (2016) report that the average SLEDs show increasing mid- to high-J CO luminosity relative to CO J = 1–0, from a few to ~100, with increasing L(IR). Even for the most luminous local galaxies, the high-J to J = 1–0 ratios do not exceed 180. In the Galaxy such CO line ratios can be that high only near compact hot regions in Galactic Molecular Clouds (GMCs), results of strong and localised excitation by intense FUV radiation from OB stars (Papadopoulos et al. 2012).
In high-luminosity galaxies, such as those in this work, different sources of excitation must be considered. One of these is the presence of the X-ray dominated regions (XDRs) where the chemistry is driven, not by FUV photons, but by X-ray photons that are able to penetrate deeper into the cloud without efficiently heating the dust at the same time. These X-rays are mostly produced by AGNs or in areas of extreme massive star formation. CRs can also heat the gas by penetrating into cloud centres, similarly to X-rays, and are typically produced by supernovae (Bisbas et al. 2015). Mechanical heating is another efficient source of gas heating. This is commonly attributed to turbulence in the ISM, which may be driven by supernovae, strong stellar winds, jets, galaxy mergers, cloud–cloud shocks, shear in the gaseous disc, or outflows (Meijerink et al. 2013; Rosenberg et al. 2015). These mechanisms, like main heating agents acting volumetrically on molecular gas clouds, unlike FUV photons, can create large mass fractions of MWD∕Mtot(H2). Such large masses of dense and warm gas are typical in merger-driven local starbursts (Papadopoulos et al. 2012), i.e. only in extreme environments where this gas fraction can reach roughly ten times the value found in quiescient galaxies (Papadopoulos et al. 2012, 2014; Lu et al. 2017).
Two of the three targets also show very large linewidths, so at least for G12v2.30 and NBv1.78 it can be interpreted as a possible sign of merger-driven velocity fields with expected large mechanical energy available as a source of energy for their molecular gas. The presence of an AGN seems to be excluded as discussed in Omont et al. (2013) and Yang et al. (2016) from the measured 1.4 GHz radio fluxes. However, recently an AGN signature has been found in one of the images of a lensed object, SDP9 (Massardi et al. 2017), and a hidden AGN contribution cannot be fully excluded. In the Local Universe, high-excitation galaxies with large linewidths are not necessarily associated with high AGN contributions and galaxies with large AGN contributions do not necessarily display large linewidths (Rosenberg et al. 2015), while low-excitation galaxies have smaller linewidths; this narrowness is interpreted as the sign of radiative energy as the major source of excitation.
Our three targets have gravitational lens magnifications μ of about 10 (Bussmann et al. 2013; Harris et al. 2012), determined from modelling the SMA continuum data at 880 μm. From these models alone, we cannot estimate how much the differential lensing affects this result. If CO(7–6) and CO(1–0) emissions come from different and decoupled regions (not overlapping along the line of sight), the strong lensing effect may act differently on the two emissions, the resulting magnification would be different, and the ratio would be altered. Yang et al. (2017) suggest that high-J CO lines may be magnified by a factor of at least 1.3 above the overall lensing magnification for CO(1–0), whose emission is expected to be more extended. The magnification factor by Yang et al. (2017) is derived by comparing the CO(1–0)/CO(3–2) ratio between a sample of unlensed SMGs (Bothwell et al. 2013) and the H-ATLAS lensed SMGs. We expect that high-J CO would be more compact, leaving this ratio a lower limit, as stated above. Even if we allow the ratios shown in Fig. 2 to decrease by this factor, the large detected excitation cannot be explained by differential lensing alone. It is worth noticing that if this were the case, G12v.2.43 would fall within the boundaries of a photon-dominated ISM.
In Fig. 3 we report the values of the  of the lensed galaxies compared with values for the Local Universe (Kamenetzky et al. 2014; Rosenberg et al. 2015). Also shown in the figureare the same ratios taken from the observations of similar objects by Walter et al. (2011) and Yang et al. (2017). Papadopoulos & Geach (2012) suggested that the ratio between the high-J CO line and the CI can be used as evidence forthe star-forming mode, indicating whether a system is merger driven (large values) or disc-like (low values), where the difference can be up to a factor of 10 between these two types of systems. CI(2–1) is a good H2 mass tracer (as long as Tk ≥ 30 K), even if CI(2–1) (or CI(1–0)) has not yet been well calibrated as H2 global mass tracers (Joao et al. 2017).
For disc-dominated environments the  ratio is expected to be lower than or roughly one, with the lowest value in the Outer Galaxy and quiescient clouds, while in merger-driven starbursts (ULIRGs and in the Galactic centre) this ratio may be a factor of ten larger. Papadopoulos & Geach (2012) suggest using this ratio as well as a tracer of the ratio between the molecular mass in dense environments and the total molecular mass, MWD∕Mtot(H2) (Papadopoulos & Geach 2012, and references therein). However, any differential lensing effects between the CI, which is easier to be excited, and the more extended emission with respect to the CO(7–6) emission would lower this ratio. If we were to consider the same factor as assumed for the CO(1–0) line, 1.3 less magnification than the higher-J CO lines for the CI(2–1), the corresponding ratio
  would be lower.
Even keeping in mind this effect, we can claim that most of the lensed high-redshift objects lie in the range characteristic of large molecular gas excitation. Neutral atomic carbon remains abundant in H2 gas over a large gas density range 100 ≤ n ≤ 104 cm−3, i.e. the bulk of mass of typical molecular clouds. It only becomes markedly less abundant at higher densities where C becomes increasingly locked in CO (Glover et al. 2015), but also where much less H2 gas mass resides in typical GMCs. However, for enhanced CR energy densities in these high-redshift galaxies C can remain abundant even at higher gas densities (Bisbas et al. 2015).
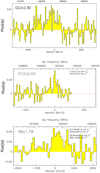 |
Fig. 1 Spatially integrated APEX/SEPIA5 spectra of the three lensed sources, targets of this work. The red lines represent the Gaussian fitting to the emission lines (CO(7–6) at approximately zero velocity and CI(2–1)). Zero velocity is set to the CO(1–0) and CO(3–2) line sky frequencies according to the previously measured spectroscopy redshifts given in Table 1. |
Observed line fluxes, velocities, and luminosities.
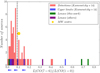 |
Fig. 2 Number of sources with a given CO(7–6)/CO(1–0) luminosity ratio (in units of K km s−1 pc2). Data from this work are marked in green; red and blue bars refer to detections and upper limits, respectively, taken from Kamenetzky et al. (2014). The value shown here for NBv1.78 is CO(7–6)/CO(3–2) (~ 0.8) and the corresponding CO(7–6)/CO(1–0) is expected to be lower by a factor of ~3. Data from other similar lensed targets are taken from Oteo et al. (2017); Yang et al. (2017) (shown in purple). The Milky Way value is from Fixsen et al. (1999) and corresponds to the centre of the Galaxy; values for the inner and outer Galaxy are upper limits (< 0.04 and < 0.07, respectively) and are not shown here. Values between 0.15 and 0.4 correspond to LIRGs (L(IR) > 11.5 L⊙), values between 0.05 and 0.15 correspond to IRGs with (11.0 < L(IR) < 11.5 L⊙) and submillimetre galaxies, while lower values to galaxies with (L(IR) < 11.0 L⊙). Lenses detected in this work show values higher than those of the local ULIRGs. The black dashed vertical line marks the values below which the objects are FUV photon dominated from those above which are non-FUV photon heated (like NGC253, NGC6240, Arp220, the Galactic centre, etc.). |
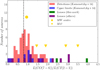 |
Fig. 3 Number of sources with a given CO(7–6)/CI(2–1) luminosity ratio (in units of K km s−1 pc2), colour-coded as in Fig. 2. Data for local galaxies are taken from Kamenetzky et al. (2014). A slight trend with IR luminosity is detected for the CO(7–6)/CI(2–1) ratio: higher values correspond to larger
L(IR). For comparison with values found in star-forming regions of the Galaxy, the range of ratios of M17 are also shown (Pérez-Beaupuits et al. 2010). The blue bars correspond to upper limits (the objects have an upper limit on the CO(7–6) line emission), while for the two lenses G12v2.43 (~1.1) and NBv1.78 (~4) the green bars correspond to lower limits and the corresponding ratio is higher. Also plotted are the values of other lensed objects reported in Yang et al. (2017). The vertical dashed line indicates the value of the ratio
|


3.2 Gas masses
We provide a rough estimate of H2 mass using the expression in Papadopoulos (2005; see also Weiss et al. 2005; Alaghband-Zadeh et al. 2013; Bothwell et al. 2017; Popping et al. 2017). However, a great source of uncertainty stems from the assumed excitation conditions that determine the gas excitation function, Q(n, T), which cannot be estimated without knowing the CI(1–0) luminosity. Although the CI(1–0) is a better tracer of the molecular mass because of the smaller deviation of the Q(n, T) value with respect to the local thermodynamical equilibrium (LTE) conditions (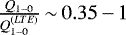
 ; Papadopoulos et al. 2004), here we make the following assumptions: (1) typical density of 100 < n < 5 104 cm−3, (2) kinetic temperatureTk = 20−60 K, and (3) Tk equivalent to the dust temperature. The third has been estimated from the dust spectral energy distribution and the far-infrared (FIR) luminosity Zhang et al. (in prep.) and the results are given in Table 2 where the gas mass values computed for the three targets used in this work are also listed.
The H2 mass found assuming a carbon abundance (in mass, relative to the molecular hydrogen) of X[CI] =M[CI] =6M(H2) = 3 × 10⁻⁵ (Papadopoulos & Greve 2004; Papadopoulos et al. 2004; Weiss et al. 2005; Bothwell et al. 2017; Popping et al. 2017, and references therein) is compared to the molecular mass estimated from the CO line luminosity (Harris et al. 2012; Yang et al. 2017); Zhang et al. (in prep.).
Values in Table 2 are not corrected for magnification because we are not able to define it for CI. Our goal here is to compare the values found with the different tracers to show that CI can be used to estimate the molecular mass. With all the uncertainties listed above, the agreement between the two estimations of the molecular masses is quite satisfactory.
Magnification uncorrected values of the neutral carbon and molecular masses.
3.3 Line to infrared luminosity ratios
In Fig. 4 we show the distribution of the values of the luminosity ratio CO (7 − 6)∕FIR for the lensed and the local galaxies (Kamenetzky et al. 2016). This ratio spans a wide range of values from 10−6 to 10−3, with a median of 3.5 × 10⁻⁵, but most of the galaxies, including the ULIRGs, have values between 10−5 and 10−4. The lowest value bins are occupied by galaxies such as NGC1097, CenA, NGC891, while the largest value is that of a dwarf low-metallicity galaxy, NGC 4560.
If we very conservatively allow a factor of 10 uncertainty because of the unknown effect of the gravitational lensing on the CO(7–6) emitting region and the overall FIR luminosity (which is likely due to the emission of the interstellar dust), the observed values for the three lenses show a wide range. The two lenses NBv1.78 and G12v2.30 have values largely exceeding the range defined by the local galaxies, consistent with that observed in NGC 6240 (Meijerink et al. 2013) and the Galaxy centre but still lower than those of NGC 4569. G12v2.43 has a value of (0.1−1.3) × 10−4 consistent with the characteristic values of the local IR galaxies, a result which confirms previous finding for SMGs and local galaxies (Lu et al. 2015). The high values of CO(7−6)∕FIR (and also of CI(2−1)∕FIR) in NBv1.78 and G12v2.30 are consistent with a chemistry driven by shocks (Pérez-Beaupuits et al. 2010). We note that shock, CR, or turbulent heating, quite unlike heating by FUV photons, do heat the dust as effectively as they do gas. Meijerink et al. (2013) find similar values in NGC6240, which they interpret as being related to shocks that compress the gas and heat it to higher temperatures, while not affecting the energy budget for the dust reservoir that remains much cooler. An even higher value is seen in NGC 4569, a low-IR luminosity galaxy in the Virgo cluster, which shows evidence of ram pressure stripping, with a deficiency of atomic hydrogen but with a large presence of molecular gas (5 × 10⁹ M⊙) (Boselli et al. 2016).
The CO(7−6)∕FIR luminosity ratio shows a slight dependence on the IR luminosity as seen in other SMGs and lensed objects (Walter et al. 2011; Lu et al. 2015; Yang et al. 2017), but overall it is very cumbersome to quantify this dependence in cases where the presence of an AGN altering either the FIR or both luminosities cannot be excluded.
The CO(7−6) luminosity is too high to be associated only with star formation rate processes as seen in local ULIRGs (Lu et al. 2015), but as discussed above without a detailed lensing model it is impossible to quantify the boosting of the different emitting components.
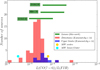 |
Fig. 4 Number of sources with a given CO(7–6)/FIR luminosity ratio, colour-coded as in Fig. 2. Data are taken from Kamenetzky et al. (2014). Values for the lens ratios show a range containing the observed values Zhang et al. (in prep.) and an uncertainty of a factor of 10, likely comprehensive of the unknown effect of the gravitational lensing effect. For comparison, the value of the Galaxy centre, and inner and outer Galaxy are also shown (Fixsen et al. 1999). |
4 Conclusions
Three strongly lensed galaxies at redshift z ~ 3 have been observed and detected with APEX/SEPIA5. The CO(7–6) emission has been detected in all three objects, while CI(2–1) in G12v2.30, marginally in NBv1.78 and not detected in G12v2.43.
The observed global CO(7−6)∕CI(2−1), CO (7−6)∕CO(1−0), and CO (7 − 6)∕L(FIR) luminosity ratios, when compared with well-studied local galaxies, show evidence for some mechanism other than the FUV heating by star formation as the dominant power source for their molecular ISM. Mechanical energy in the form of shocks and/or strong turbulence and/or high CR energy densities can maintain large amounts of very warm and dense gas, which would imply that the average initial conditions of star formation may no longer be those found in less vigorously star-forming galaxies.
We have computed the molecular masses from the CI luminosity and find it in agreement with that derived from CO (1−0) within the uncertainties of both methods.
Higher angular resolution imaging together with a detailed lensing model is required to examine in detail the effect of the magnification on the different gas tracers, to discern the relative distributions of warm dense gas associated with star formation with respect to cooler lower density gas (therefore altering their instrinsic ratios), and also to probe the dynamics of these remarkable objects.
Acknowledgements
We would like to thank both the SEPIA team and the APEX operating team on site for their hard work in making the SEPIA commissioning a success and for conducting PI observations (under PI project 098.F-9302). We would like to thank the referee for the suggestions that improved the readability of the paper. CY was supported by an ESO Fellowship. APEX is a collaboration between the Max-Planck-Institut fur Radioastronomie, the European Southern Observatory (ESO), and the Onsala Space Observatory. SEPIA is a collaboration between Sweden and ESO.
References
- Alaghband-Zadeh, S., Chapman, S. C., Swinbank, A. M., & Ian Smai. 2013, MNRAS, 435, 1493 [Google Scholar]
- Belitsky, V., Lapkin, I., Fredrixon, M., et al. 2018, A&A, 612, A23 [Google Scholar]
- Billade, B., Nystrom, O., Meledin, D., et al. 2012, IEEE Trans. Terahertz Sci. Technol., 2, 208 [NASA ADS] [CrossRef] [Google Scholar]
- Bisbas, T. M., Papadopoulos, P. P., & Viti, S. 2015, ApJ, 803, 37 [NASA ADS] [CrossRef] [Google Scholar]
- Bisbas T. M., van Dishoeck E. F., Papadopoulos, P. P., et al. 2017, ApJ, 839, 90 [NASA ADS] [CrossRef] [Google Scholar]
- Boselli, A., Cuillandre, J. C., Fossati, M., Boissier, C., & Bomans, G. 2016, A&A, 587, A68 [NASA ADS] [CrossRef] [EDP Sciences] [Google Scholar]
- Bothwell, M. S., Smail, I., Chapman, S. C., Genzel, R., & Ivison, R. J. 2013, MNRAS, 429, 3047 [NASA ADS] [CrossRef] [Google Scholar]
- Bothwell, M. S., Aguirre, J. E., Aravena, M., Bethermin, M., & Bisbas, T. G. 2017, MNRAS, 466, 2825 [Google Scholar]
- Bradac, M., Garcia-Appadoo, D., Vallini, L., Hoag, A., & Treu, T. 2017, ApJ, 836, L2 [NASA ADS] [CrossRef] [Google Scholar]
- Bussmann, R. S., Pérez-Fournon, I., Amber, S., Calanog, J., & Gurwell, M. A. 2013, ApJ, 779, 25 [NASA ADS] [CrossRef] [Google Scholar]
- Carilli, C., & Walter, F. 2013, ARAA, 51, 10 [Google Scholar]
- De Breuck, C. J. Williams, R., Swinbank, M., Caselli, P., & Coppin, K. 2014, A&A, 565, A59 [NASA ADS] [CrossRef] [EDP Sciences] [Google Scholar]
- Fixsen, D. J., Bennett, C. L., & Mather, J. C. 1999, ApJ, 526, 207 [NASA ADS] [CrossRef] [Google Scholar]
- Fu, H., Jullo, E., Cooray, A., Bussmann, R.S., & Ivison, R. J. 2012, ApJ, 753, 134 [NASA ADS] [CrossRef] [Google Scholar]
- Gerin, M., & Phillips, T. 2000, ApJ, 537, 644 [NASA ADS] [CrossRef] [Google Scholar]
- Glover, S. C., & Clark, P. C. 2016, MNRAS, 456, 3596 [NASA ADS] [CrossRef] [Google Scholar]
- Glover, S. C., Clark, P. C., Micic, M., & Molina, F. 2015, MNRAS, 448, 1607 [NASA ADS] [CrossRef] [Google Scholar]
- Güsten, R., Nyman, L. Å., Schilke, P., Menten, K., & Cesarsky, C. 2006, A&A, 454, 13 [Google Scholar]
- Harris, A. I., Baker, A. J., Frayer, D. T., Swinbank, A. M., & Riechers, D. A. 2012, ApJ, 752, 152 [NASA ADS] [CrossRef] [Google Scholar]
- Hayatsu N., Matsuda Y., Umehata H., et al. 2017, PASP, 69, 45 [Google Scholar]
- Immer, K., Belitsky, V., Olberg, M., et al. 2016, The Messenger, 165, 13 [NASA ADS] [Google Scholar]
- Jiao, Q., Zhao, Y., Zhu, M., Lu, N., & Gao, Y. 2017, ApJ, 840, L18 [NASA ADS] [CrossRef] [Google Scholar]
- Kamenetzky, J., Rangwala, N., Glenn, J., Maloney, P. R., & Conley, A. 2014, ApJ, 795, 174 [NASA ADS] [CrossRef] [Google Scholar]
- Kamenetzky, J., Rangwala, N., Glenn, J., Maloney, P. R., & Conley A. 2016, ApJ, 829, 93 [NASA ADS] [CrossRef] [Google Scholar]
- Kamenetzky, J., Rangwala, N., & Glenn, J. 2017, MNRAS, 471, 2917 [NASA ADS] [CrossRef] [Google Scholar]
- Knudsen, K., Richard, J., Kneib, Jean-Paul, Jauzac, M., & Clement, B. 2016, MNRAS, 462, L6 [NASA ADS] [CrossRef] [Google Scholar]
- Lu, N., Zhao, Y., Xu, C. K., Gao, Y., & Díaz-Santos, T. 2015, ApJ, 802, L11 [NASA ADS] [CrossRef] [Google Scholar]
- Lu, N., Zhao, Y., Díaz-Santos, T., Xu, C. K., & Gao, Y. 2017, ApJ Supp., 230, 1L [Google Scholar]
- Massardi, M., Enia, A. F. M., Negrello, M., et al. 2017, A&A, 610, A53 [Google Scholar]
- Meijerink, R., Kristensen, L. E, Weiß, A., van der Werf, P. P., & Walter, F. 2013, ApJ, 762, L16 [NASA ADS] [CrossRef] [Google Scholar]
- Omont, A., Yang, C., Cox, P., Neri, R., & Beelen, A. 2013, A&A, 551, 115 [Google Scholar]
- Oteo, I., Zhang, Z. Y., Yang C., et al. 2017, ApJ, 850, 170 [NASA ADS] [CrossRef] [Google Scholar]
- Papadopoulos, P. P. 2005, ApJ, 623, 763 [NASA ADS] [CrossRef] [Google Scholar]
- Papadopoulos, P. P., & Geach, J. E. 2012, ApJ, 757, 157 [NASA ADS] [CrossRef] [Google Scholar]
- Papadopoulos, P. P., & Greve T. 2004, ApJ, 615, L29 [NASA ADS] [CrossRef] [Google Scholar]
- Papadopoulos, P. P., Thi, W. F., & Viti, S. 2004, MNRAS, 351, 147 [NASA ADS] [CrossRef] [Google Scholar]
- Papadopoulos, P. P., van der Werf, P., & Isaak K. 2010, ApJ, 715, 775 [NASA ADS] [CrossRef] [Google Scholar]
- Papadopoulos, P. P., van der Werf, P. P., Xilouris, E. M., Isaak, K. G., & Gao, Y. 2012, MNRAS, 426, 2601 [NASA ADS] [CrossRef] [Google Scholar]
- Papadopoulos, P. P., Zhang, Z.-Y., & Xilouris, E. M. 2014, ApJ, 788, 153 [NASA ADS] [CrossRef] [Google Scholar]
- Pérez-Beaupuits, J. P., Spaans, M., Hogerheijde, M. R., et al. 2010, A&A, 510, A87 [NASA ADS] [CrossRef] [EDP Sciences] [Google Scholar]
- Pety, J., Beelen, A., Cox, P., et al. 2004, A&A, 428, 21 [NASA ADS] [CrossRef] [EDP Sciences] [Google Scholar]
- Popping, G., Decarli, R., Man, A. W. S., et al. 2017, A&A, 602, 11 [Google Scholar]
- Rosenberg, M. J. F., van der Werf, P. P., & Aalto, S. 2015, ApJ, 801, 72 [NASA ADS] [CrossRef] [Google Scholar]
- Saito, T., Iono, D., Xu, C. K., et al. 2017, ApJ, 835, 174 [NASA ADS] [CrossRef] [Google Scholar]
- Solomon, P. M., Downes, D., Radford, S. J. E., et al. 1997, ApJ, 478, 144 [NASA ADS] [CrossRef] [Google Scholar]
- Tomassetti, M., Porciani, E., Romano-Díaz, E., Ludlow, A.D., & Papadopoulos, P.P. 2014, MNRAS, 445, L124 [NASA ADS] [CrossRef] [Google Scholar]
- Walter, F., Weiß, A., Downes, D., et al. 2011, ApJ, 730, 18 [NASA ADS] [CrossRef] [Google Scholar]
- Weiß, A., Downes, D., Henkel, C., & Walter, F. 2005, A&A, 429, L25 [NASA ADS] [CrossRef] [EDP Sciences] [Google Scholar]
- Yang, C., Omont, A., Beelen, A., et al. 2016, A&A, 595, A80 [NASA ADS] [CrossRef] [EDP Sciences] [Google Scholar]
- Yang, C., Omont, A., Beelen, A., et al. 2017, A&A, 608, A144 [Google Scholar]
- Zhang, Z.-Y., Henkel, C., Gao, Y., et al. 2014 A&A, 568, A122 [NASA ADS] [CrossRef] [EDP Sciences] [Google Scholar]
- Zhang, Z.-Y., Papadopoulos, P. P., Ivison, R. J., et al. 2016, R. Soc. Open Sci., 3, 160025 [Google Scholar]
The CI excited fine levels 3P1 and 3P2 lie 23.6 and 62.4 K above the ground state (3P0) and are therefore easily populated by particle collisions in the cold interstellar medium (ISM). Two magnetic-dipole transitions are allowed between the fine-structure levels: 3P1→3P0 (CI(1–0)) has a rest frequency of 492.1607 GHz, while 3P2→3P1 (CI(2–1)) of 809.3435 GHz.
All Tables
All Figures
|
Fig. 1 Spatially integrated APEX/SEPIA5 spectra of the three lensed sources, targets of this work. The red lines represent the Gaussian fitting to the emission lines (CO(7–6) at approximately zero velocity and CI(2–1)). Zero velocity is set to the CO(1–0) and CO(3–2) line sky frequencies according to the previously measured spectroscopy redshifts given in Table 1. |
| In the text | |
|
Fig. 2 Number of sources with a given CO(7–6)/CO(1–0) luminosity ratio (in units of K km s−1 pc2). Data from this work are marked in green; red and blue bars refer to detections and upper limits, respectively, taken from Kamenetzky et al. (2014). The value shown here for NBv1.78 is CO(7–6)/CO(3–2) (~ 0.8) and the corresponding CO(7–6)/CO(1–0) is expected to be lower by a factor of ~3. Data from other similar lensed targets are taken from Oteo et al. (2017); Yang et al. (2017) (shown in purple). The Milky Way value is from Fixsen et al. (1999) and corresponds to the centre of the Galaxy; values for the inner and outer Galaxy are upper limits (< 0.04 and < 0.07, respectively) and are not shown here. Values between 0.15 and 0.4 correspond to LIRGs (L(IR) > 11.5 L⊙), values between 0.05 and 0.15 correspond to IRGs with (11.0 < L(IR) < 11.5 L⊙) and submillimetre galaxies, while lower values to galaxies with (L(IR) < 11.0 L⊙). Lenses detected in this work show values higher than those of the local ULIRGs. The black dashed vertical line marks the values below which the objects are FUV photon dominated from those above which are non-FUV photon heated (like NGC253, NGC6240, Arp220, the Galactic centre, etc.). |
| In the text | |
|
Fig. 3 Number of sources with a given CO(7–6)/CI(2–1) luminosity ratio (in units of K km s−1 pc2), colour-coded as in Fig. 2. Data for local galaxies are taken from Kamenetzky et al. (2014). A slight trend with IR luminosity is detected for the CO(7–6)/CI(2–1) ratio: higher values correspond to larger
L(IR). For comparison with values found in star-forming regions of the Galaxy, the range of ratios of M17 are also shown (Pérez-Beaupuits et al. 2010). The blue bars correspond to upper limits (the objects have an upper limit on the CO(7–6) line emission), while for the two lenses G12v2.43 (~1.1) and NBv1.78 (~4) the green bars correspond to lower limits and the corresponding ratio is higher. Also plotted are the values of other lensed objects reported in Yang et al. (2017). The vertical dashed line indicates the value of the ratio
|
| In the text | |
|
Fig. 4 Number of sources with a given CO(7–6)/FIR luminosity ratio, colour-coded as in Fig. 2. Data are taken from Kamenetzky et al. (2014). Values for the lens ratios show a range containing the observed values Zhang et al. (in prep.) and an uncertainty of a factor of 10, likely comprehensive of the unknown effect of the gravitational lensing effect. For comparison, the value of the Galaxy centre, and inner and outer Galaxy are also shown (Fixsen et al. 1999). |
| In the text | |
Current usage metrics show cumulative count of Article Views (full-text article views including HTML views, PDF and ePub downloads, according to the available data) and Abstracts Views on Vision4Press platform.
Data correspond to usage on the plateform after 2015. The current usage metrics is available 48-96 hours after online publication and is updated daily on week days.
Initial download of the metrics may take a while.