Fig. 2
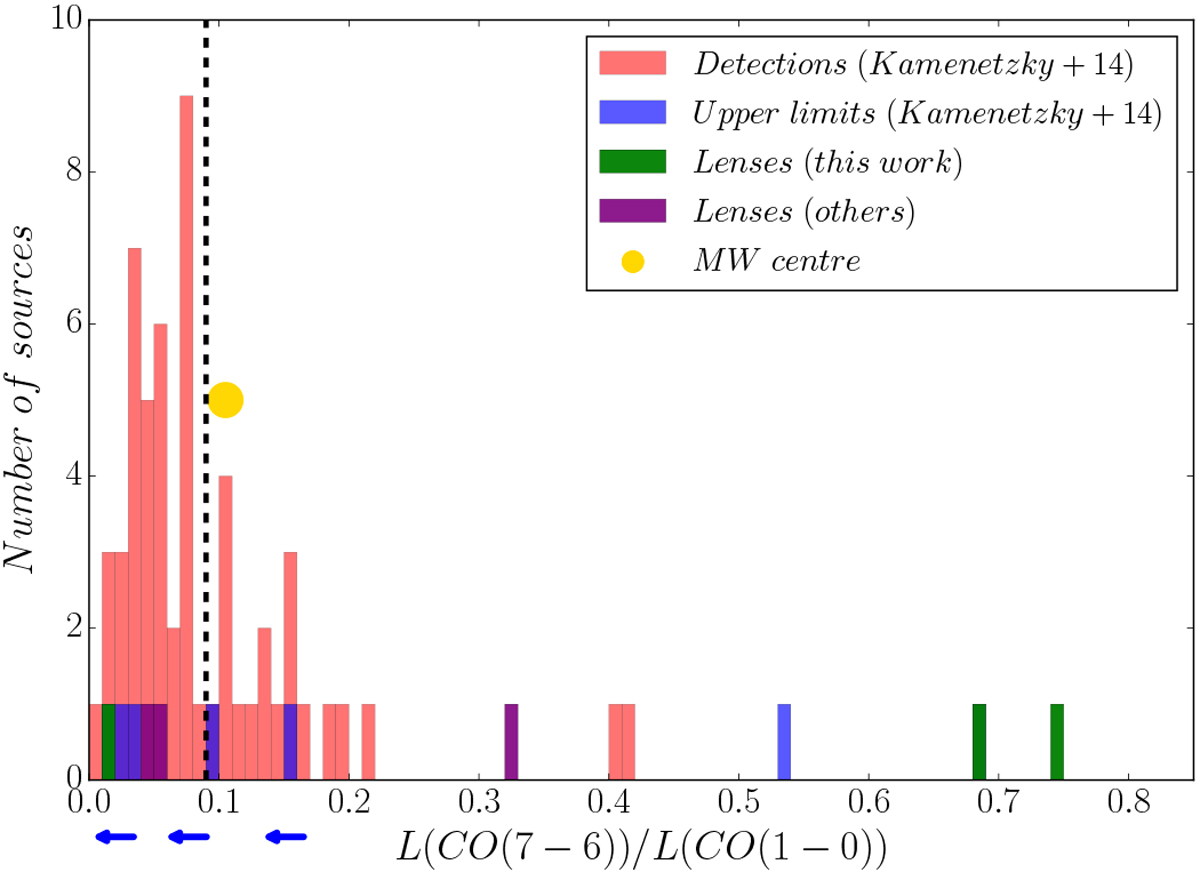
Number of sources with a given CO(7–6)/CO(1–0) luminosity ratio (in units of K km s−1 pc2). Data from this work are marked in green; red and blue bars refer to detections and upper limits, respectively, taken from Kamenetzky et al. (2014). The value shown here for NBv1.78 is CO(7–6)/CO(3–2) (~ 0.8) and the corresponding CO(7–6)/CO(1–0) is expected to be lower by a factor of ~3. Data from other similar lensed targets are taken from Oteo et al. (2017); Yang et al. (2017) (shown in purple). The Milky Way value is from Fixsen et al. (1999) and corresponds to the centre of the Galaxy; values for the inner and outer Galaxy are upper limits (< 0.04 and < 0.07, respectively) and are not shown here. Values between 0.15 and 0.4 correspond to LIRGs (L(IR) > 11.5 L⊙), values between 0.05 and 0.15 correspond to IRGs with (11.0 < L(IR) < 11.5 L⊙) and submillimetre galaxies, while lower values to galaxies with (L(IR) < 11.0 L⊙). Lenses detected in this work show values higher than those of the local ULIRGs. The black dashed vertical line marks the values below which the objects are FUV photon dominated from those above which are non-FUV photon heated (like NGC253, NGC6240, Arp220, the Galactic centre, etc.).
Current usage metrics show cumulative count of Article Views (full-text article views including HTML views, PDF and ePub downloads, according to the available data) and Abstracts Views on Vision4Press platform.
Data correspond to usage on the plateform after 2015. The current usage metrics is available 48-96 hours after online publication and is updated daily on week days.
Initial download of the metrics may take a while.