Fig. 3
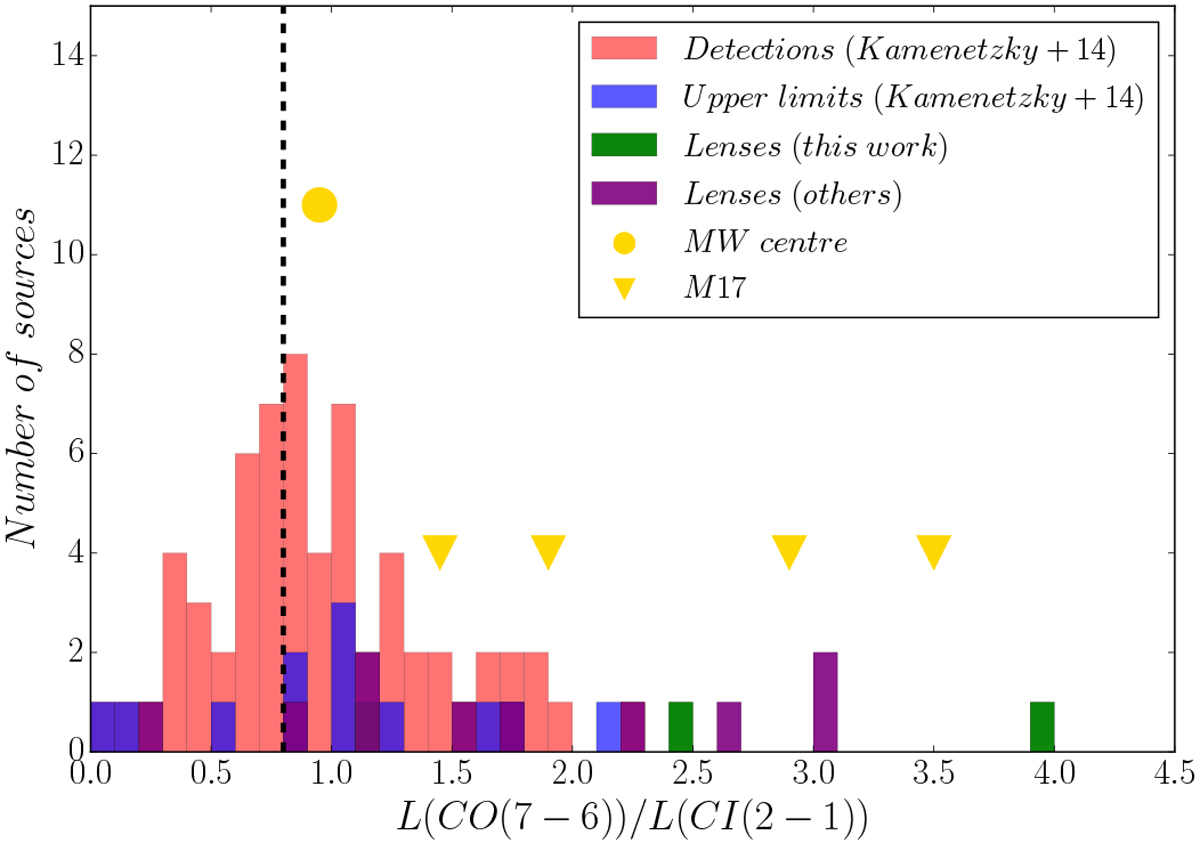
Number of sources with a given CO(7–6)/CI(2–1) luminosity ratio (in units of K km s−1 pc2), colour-coded as in Fig. 2. Data for local galaxies are taken from Kamenetzky et al. (2014). A slight trend with IR luminosity is detected for the CO(7–6)/CI(2–1) ratio: higher values correspond to larger
L(IR). For comparison with values found in star-forming regions of the Galaxy, the range of ratios of M17 are also shown (Pérez-Beaupuits et al. 2010). The blue bars correspond to upper limits (the objects have an upper limit on the CO(7–6) line emission), while for the two lenses G12v2.43 (~1.1) and NBv1.78 (~4) the green bars correspond to lower limits and the corresponding ratio is higher. Also plotted are the values of other lensed objects reported in Yang et al. (2017). The vertical dashed line indicates the value of the ratio
![]() below which the ISM is dominated by the FUV heating, while those at higher values need other excitation mechanisms to explain the high value of the
below which the ISM is dominated by the FUV heating, while those at higher values need other excitation mechanisms to explain the high value of the
![]() .
.
Current usage metrics show cumulative count of Article Views (full-text article views including HTML views, PDF and ePub downloads, according to the available data) and Abstracts Views on Vision4Press platform.
Data correspond to usage on the plateform after 2015. The current usage metrics is available 48-96 hours after online publication and is updated daily on week days.
Initial download of the metrics may take a while.