Fig. 1
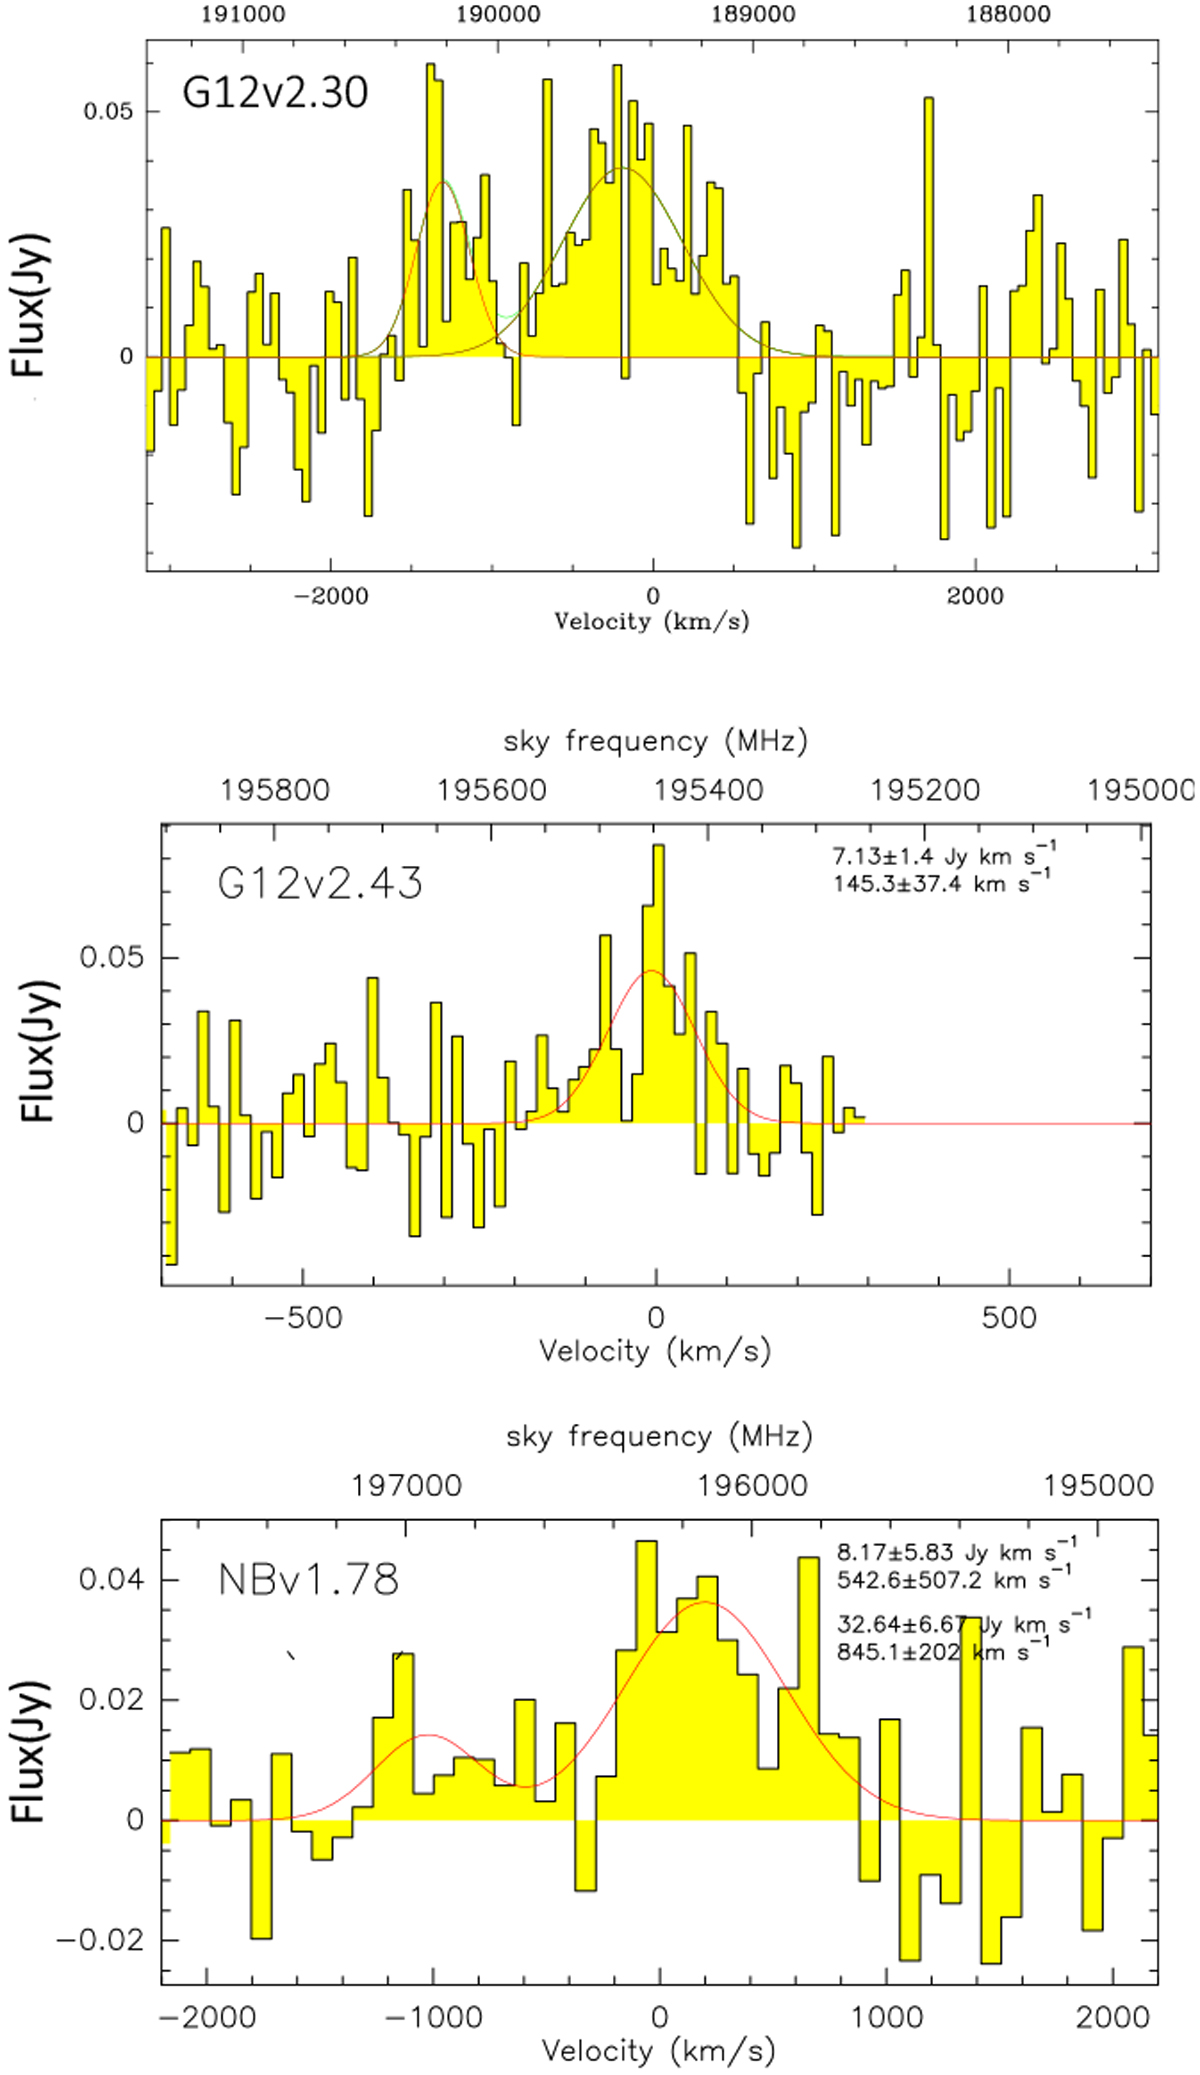
Spatially integrated APEX/SEPIA5 spectra of the three lensed sources, targets of this work. The red lines represent the Gaussian fitting to the emission lines (CO(7–6) at approximately zero velocity and CI(2–1)). Zero velocity is set to the CO(1–0) and CO(3–2) line sky frequencies according to the previously measured spectroscopy redshifts given in Table 1.
Current usage metrics show cumulative count of Article Views (full-text article views including HTML views, PDF and ePub downloads, according to the available data) and Abstracts Views on Vision4Press platform.
Data correspond to usage on the plateform after 2015. The current usage metrics is available 48-96 hours after online publication and is updated daily on week days.
Initial download of the metrics may take a while.