Fig. 5
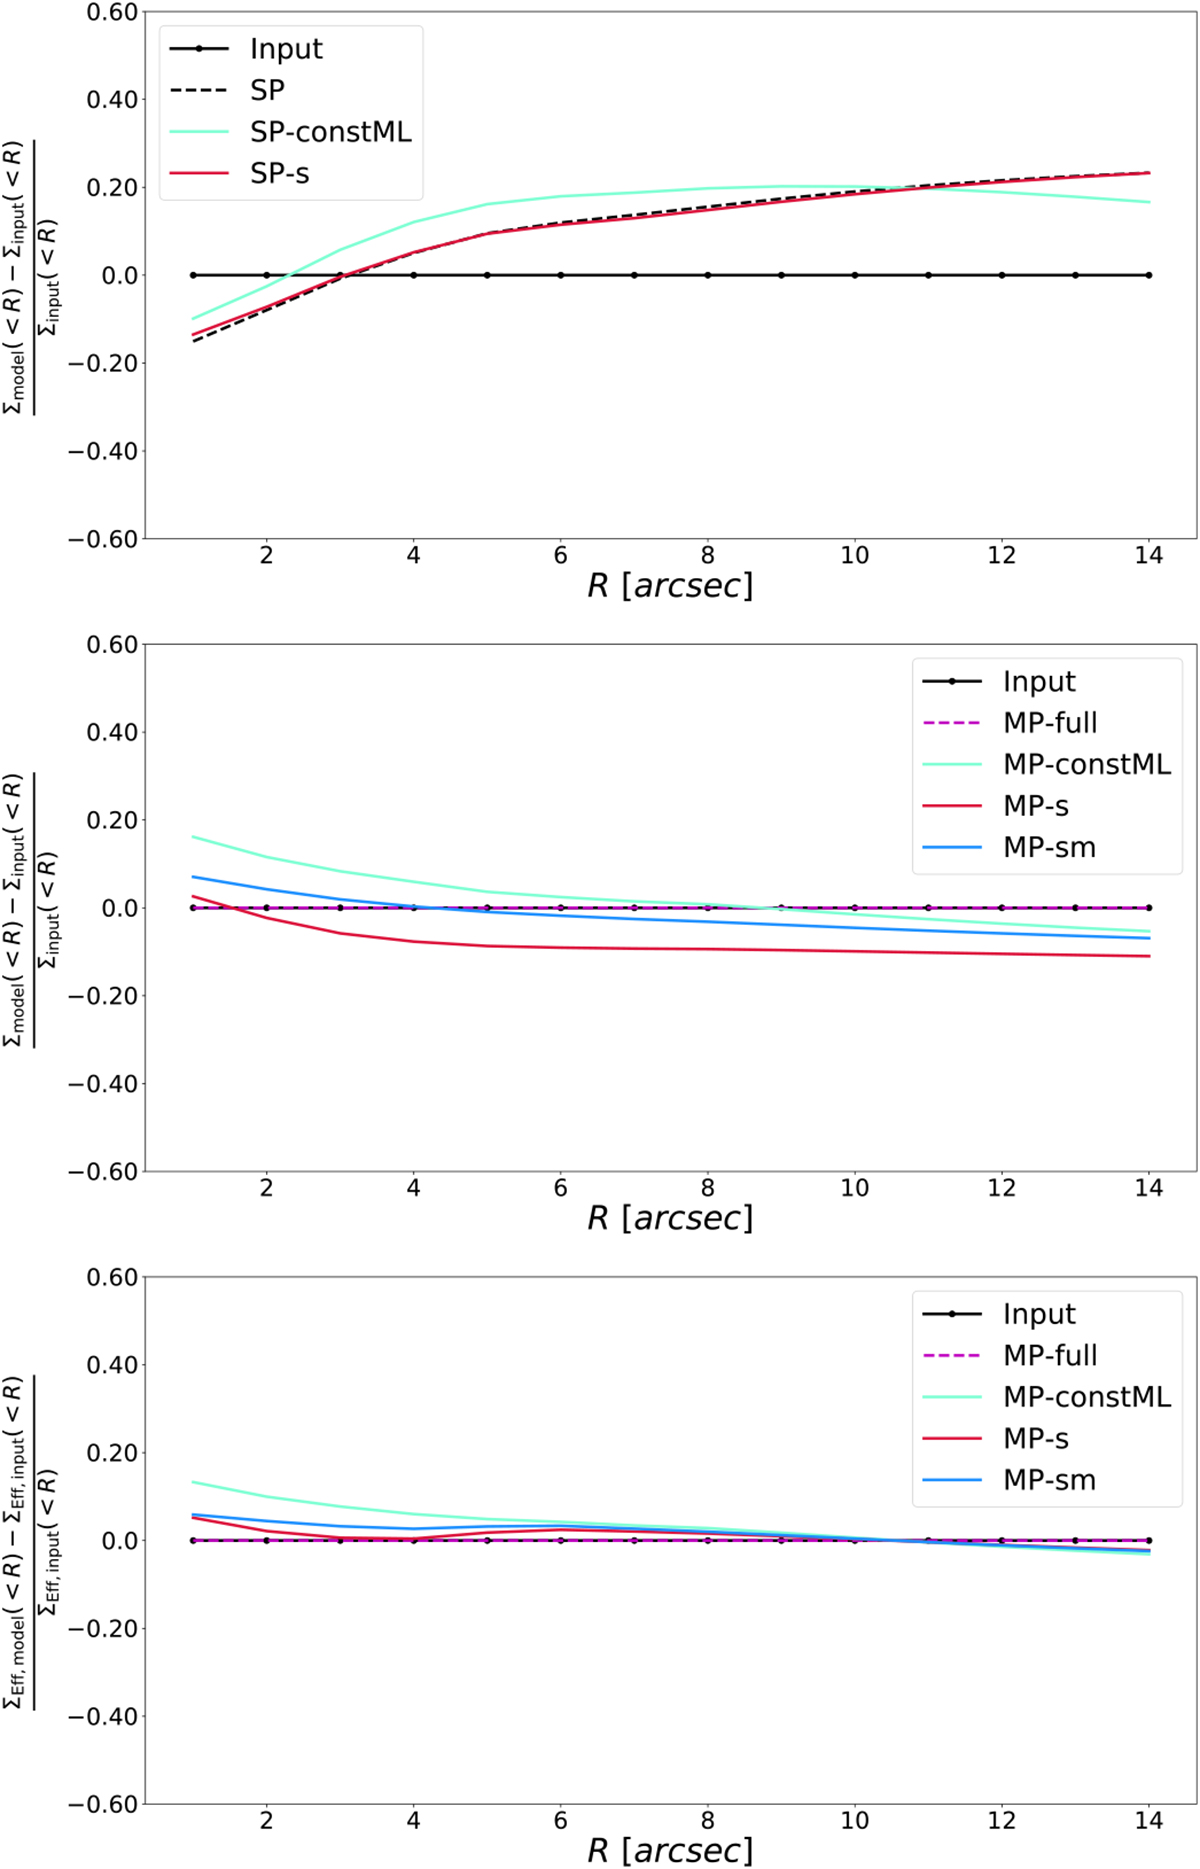
Relative error on the average surface mass density Σ(< R) as a function of radius from the BCG for the best-fit models of Mock mass distribution 2. From top to bottom: single plane cluster, cluster (without LOS perturbers) from multi-plane models, and total multi-plane configuration. In each plot, the lines represent the input (solid black), the multi-plane model (dashed magenta), the single-plane model (dashed black) the model where we assumed constant mass-to-light ratio (light blue), the model where we assumed spherical galaxies (red) and, only in the multi-plane cases, the model where we assumed only spherical cluster members (blue). We note that in the total multi-plane configuration the ΣEff is derived from the total deflection angle and computed for a source at zs = 2, as explained in Sect. 2.1. We observe that at θE,tot ~ 10″ all models converge to a certain value of Σ(< R) and ΣEff in the top and bottom panels, showing that strong lensing provides accurate mass enclosed within the Einstein radius.
Current usage metrics show cumulative count of Article Views (full-text article views including HTML views, PDF and ePub downloads, according to the available data) and Abstracts Views on Vision4Press platform.
Data correspond to usage on the plateform after 2015. The current usage metrics is available 48-96 hours after online publication and is updated daily on week days.
Initial download of the metrics may take a while.