Fig. 3
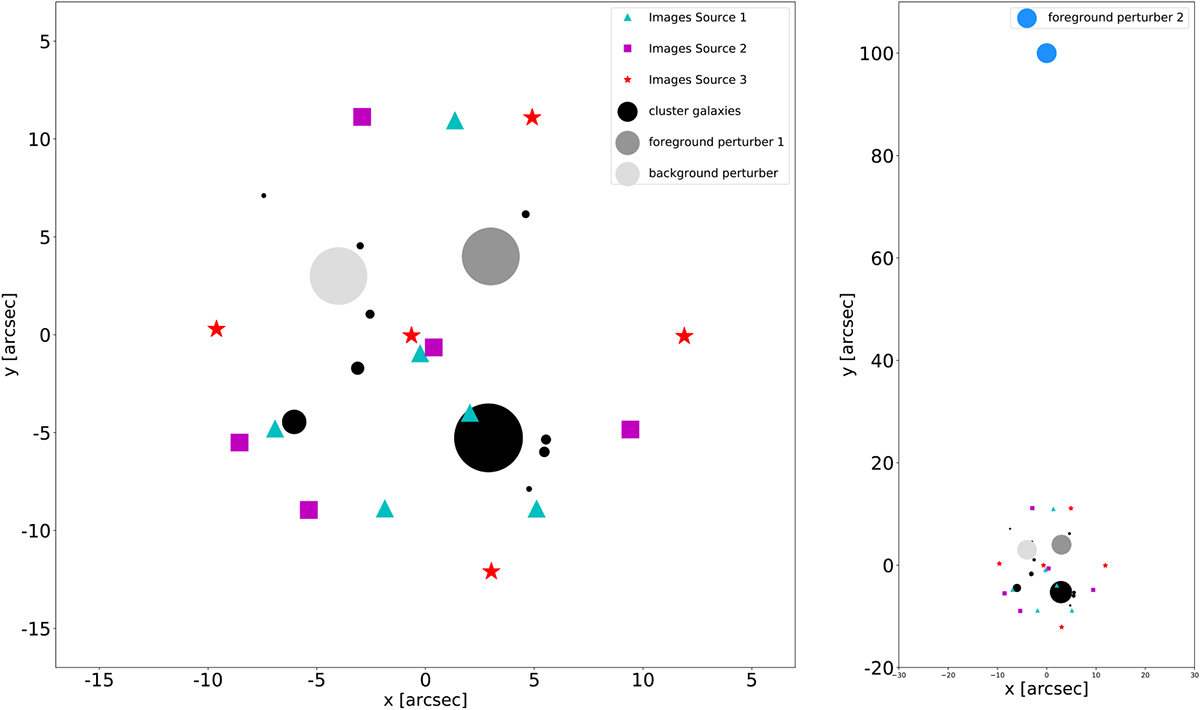
Mock cluster lensing mass distribution 2. The black circles represent the lenses (cluster members), the grey circles the foreground galaxy (darker grey) and the background galaxy (lighter grey). The cyan triangles, magenta squares and red stars represent the images of the three sources, respectively at zs1 = 1.5, zs2 = 2.0, zs3 = 2.5. The circles radii are proportional to the galaxy’s luminosity relative to the BCG (biggest circle). One far-in-projection foreground galaxy, shown in blue in the right panel, was added to this system (100″ away from the BCG).
Current usage metrics show cumulative count of Article Views (full-text article views including HTML views, PDF and ePub downloads, according to the available data) and Abstracts Views on Vision4Press platform.
Data correspond to usage on the plateform after 2015. The current usage metrics is available 48-96 hours after online publication and is updated daily on week days.
Initial download of the metrics may take a while.