Fig. 14
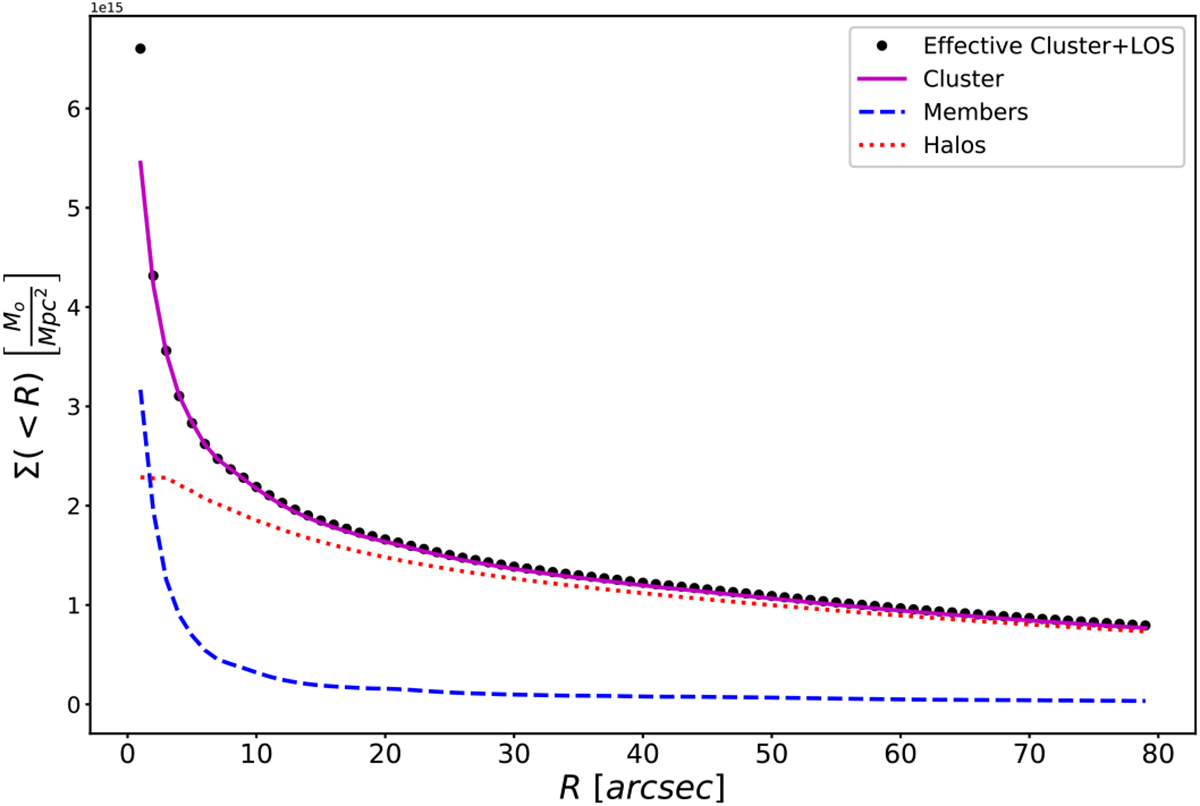
Average surface mass density Σ(< R) as a function of radius (from G1) for the best-fit model of MACS J0416.1–2403 for the total mass of the cluster (magenta line), for the cluster members (dashed blue) and for the dark matter halos (dotted red). The black points represents the effective average surface mass density Σeff (< R) (for source at redshift zs = 3) of the cluster and the LOS galaxies, as explained in Sect. 2.1. Of particular interest is the Σ(< R) within ~80″, which approximately corresponds to the HST FoV at z = 0.396 (~420 kpc).
Current usage metrics show cumulative count of Article Views (full-text article views including HTML views, PDF and ePub downloads, according to the available data) and Abstracts Views on Vision4Press platform.
Data correspond to usage on the plateform after 2015. The current usage metrics is available 48-96 hours after online publication and is updated daily on week days.
Initial download of the metrics may take a while.