| Issue |
A&A
Volume 611, March 2018
|
|
|---|---|---|
| Article Number | A98 | |
| Number of page(s) | 10 | |
| Section | Astronomical instrumentation | |
| DOI | https://doi.org/10.1051/0004-6361/201731883 | |
| Published online | 12 April 2018 | |
ALMA Band 5 receiver cartridge
Design, performance, and commissioning
1
Group for Advanced Receiver Development (GARD), Department of Space, Earth and Environment, Chalmers University of Technology,
41296
Gothenburg, Sweden
e-mail: This email address is being protected from spambots. You need JavaScript enabled to view it.
2
NOVA, The Netherlands Research School for Astronomy, Kapteyn Astronomical Institute,
Landleven 12,
9747 AD
Groningen, The Netherlands
3
European Southern Observatory (ESO),
Karl-Schwarzschild-Str. 2,
85748
Garching bei München, Germany
4
National Radio Astronomy Observatory (NRAO), NTC,
1180 Boxwood Estate Road,
Charlottesville,
VA 22903-4608, USA
5
ALMA Observatory,
Alonso de Córdova 3107,
Vitacura – Santiago, Chile
Received:
1
September
2017
Accepted:
27
November
2017
Abstract
We describe the design, performance, and commissioning results for the new ALMA Band 5 receiver channel, 163–211 GHz, which is in the final stage of full deployment and expected to be available for observations in 2018. This manuscript provides the description of the new ALMA Band 5 receiver cartridge and serves as a reference for observers using the ALMA Band 5 receiver for observations. At the time of writing this paper, the ALMA Band 5 Production Consortium consisting of NOVA Instrumentation group, based in Groningen, NL, and GARD in Sweden have produced and delivered to ALMA Observatory over 60 receiver cartridges. All 60 cartridges fulfil the new more stringent specifications for Band 5 and demonstrate excellent noise temperatures, typically below 45 K single sideband (SSB) at 4 K detector physical temperature and below 35 K SSB at 3.5 K (typical for operation at the ALMA Frontend), providing the average sideband rejection better than 15 dB, and the integrated cross-polarization level better than –25 dB. The 70 warm cartridge assemblies, hosting Band 5 local oscillator and DC bias electronics, have been produced and delivered to ALMA by NRAO. The commissioning results confirm the excellent performance of the receivers.
Key words: instrumentation: detectors / instrumentation: spectrographs / methods: observational / techniques: spectroscopic
© ESO 2018
 Open Access article, published by EDP Sciences, under the terms of the Creative Commons Attribution License (http://creativecommons.org/licenses/by/4.0;), which permits unrestricted use, distribution, and reproduction in any medium, provided the original work is properly cited.
1 Introduction
The new ALMA Band 5 receiver (the specification summarized in Table 1), covering the frequency range 163–211 GHz, has the center frequency that nearly coincides with the 183.3 GHz water line. Some features and functionality of the Band 5 receiver are applicable for the extended RF range, 158–211 GHz. One of the key science topics with the ALMA Band 5 receivers (Laing et al. 2010) is the detection of water in the Universe, for example, (Humphreys et al. 2016); spectral lines of H2S, SO and SO2 also are visible in this band and the 158 μm line emission of C+ can be detected from objects at high redshift, in the range of z = 8–10.65. This will allow us to probe the Universe at the earliest epoch of galaxy and star formation.
The initial development of the ALMA Band 5 receiver cartridge was performed as part of ALMA Enhancement Program funded by EC FP6, contract No 515906. Within this project, GARD in collaboration with the Rutherford Appleton Laboratory, UK, developed and built six preproduction ALMA Band 5 cartridges (Billade et al. 2012). The success of that project and the new exciting science case (Laing et al. 2010) triggered interest to deploying the Band 5 receivers across all ALMA antennas. The ALMA Band 5 Full Production Project was initiated by ESO in 2013. Within the Band 5 Full Production project funded by ESO, GARD in collaboration with NOVA took responsibility to produce, verify and deliver the cold cartridge assemblies (CCA) whereas production of the Band 5 local oscillator (LO) and warm cartridge assembly (WCA) was carried out by NRAO with funding from NSF. ESO also committed to the overall project coordination and providing the Band 5 front-end (FE) cryostat windows, IR filters and supplying FE DC bias modules. The Project delivers in total seventy-three Band 5 receiver cartridges for installation on all 66 ALMA antennas with 7 spare cartridges and additionally some more spare parts.
ALMA band 5 receiver specifications.
2 ALMA Band 5 cold cartridge design
The ALMA Band 5 receiver cartridge provides the ability to observe in one of the ten frequency bands of the ALMA Observatory. It uses standard FE cartridge bodies of 170 mm in diameter. The cartridge employs cold optics, a feedhorn, and a waveguide orthomode transducer (OMT) to separate signals with orthogonal linear polarizations, sideband separating (2SB) fixed tuned SIS mixers and cryogenic intermediate frequency (IF) amplifiers. Figure 1 presents the block diagram of the Band 5 CCA. The signal enters the Band 5 receiver channel through the cold optics and after separation of polarizations is fed to the 2SB mixers. The two intermediate frequency (IF) outputs go through the final stage of the sideband separation in the IF hybrid and each, upper sideband (USB) and lower sideband (LSB) then amplified by low-noise cryogenic amplifiers (LNAs). The IF bandwidth is 4–8 GHz for both the USB and LSB and for both polarizations, giving 16 GHz IF bandwidth with the capability to measure full polarization. The reference LO signal is generated by a WCA (not shown in Fig. 1), multiplied x2 by the polarization-dedicated doublers installed at 110 K and further guided to the 2SB SIS mixers installed at the 4 K cartridge thermal plate. The DC bias electronics (frontend bias module) is hosted by the WCA, outside the CCA.
Band 5 is the lowest ALMA frequency band that employs all cold optics. As a consequence of the (relatively) low frequency, the rim sizes of the mirrors M1 and M2 (Fig. 2) guiding the signal from the antenna to the mixer are the biggest amongst the ALMA frequency channels with cold optics. Figure 2 shows the optical layout of the Band 5 receiver following the design guidelines. During the design stage, the Band 5 optics were first simulated using Gaussian beams with the beam clearance of 5ω, optimized to achieve the required efficiency and frequency independent illumination of the secondary mirror and then further verified by employing Physical Optics software GRASP9 (Whale et al. 2008).
The optics design as part of the prototype receiver cartridge has been experimentally verified by the receiver beam vector measurements (Nyström et al. 2010). In the ALMA Band 5 production cartridge, mechanical design of the optics has been changed, whereas the shape of the mirrors and the structure of the corrugated horn and their positions remained unchanged. The mechanical layout modifications made by NOVA were motivated by the changed specifications requiring a stricter alignment of the receiver input beam with respect to the nominal position 2.38 degree from the vertical direction within ± 3 mrad. The entire production optics block is manufactured from a single block of aluminum alloy with a single mounting on the milling machine providing ultimate fabrication accuracy.
Like the other existing ALMA receiver bands, Band 5 is a dual polarization receiver. A OMT is used to separate signals with orthogonal linear polarizations, Pol0 and Pol1 (not shown in Fig. 1). The Band 5 OMT design was inspired by the ALMA Band 4 OMT, which was further developed and modified by GARD in collaboration with S. Asayama (Asayama & Kamikura 2009) to fit the Band 5 RF frequency range and the receiver components’ layout of the Band 5 cartridge. Specifically, together with optimizing for the Band 5 internal design, the OMT elements, the outputs of the OMT with Pol0 and Pol1 signals were placed at the opposite sides of the Band 5 OMT block. The opposite position of the OMT outputs in combination with 90-degree waveguide twist at one of the OMT outputs allowed the use of identical 2SB mixer assemblies for each polarization yielding a very compact mixer assembly layout and facilitating production. Figure 3 shows the ALMA Band 5 cold receiver assembly comprising the corrugated horn, the OMT, the 90-degree waveguide twist and two 2SB mixer assemblies with IF hybrids.
Each of the two 2SB mixers uses a modular design with the center waveguide block comprising the LO power divider and LO injection directional coupler with about –18 dB coupling and the RF signal 90-degree hybrid. In order to improve the sideband rejection of the ALMA Band 5 mixer, a novel waveguide RF hybrid (Rashid et al. 2014)has been implemented with very good phase and amplitude imbalances measured to be less than ± 4° and 0.3 dB correspondingly across the entire ALMA Band 5 RF band. The center waveguide block couples the LO and RF signals to two DSB SIS mixers, which IF outputs are coupled to the IF hybrid assembly. The ALMA Band 5 DSB SIS mixers use end-piece configuration, design and performance as specified in (Billade et al. 2012, 2013). Figure 4 shows the interior of the Band 5 DSB mixer.
To improve the IF performance, all cold receiver components at IF are connected directly via gender-matched SMA contacts without intermediate coaxial cables. This approach removes electrically long transmission lines between the components and thus increases period of ripples and reduces RF-loss-induced slope in the IF response. The IF hybrid assembly has the pitch between the input SMA contacts which is matched to the outputs of the 2SB SIS mixer and thus allows seamless integration of two components. In the Band 5 production cartridge, the SIS mixer bias circuitry PCB is integrated onto the IF hybrid assembly box. The IF hybrid assembly is integrated into a box with five separate substrates: two bias-T chips, the IF 90-degree hybrid chip, and two output transmission line chips as depicted in Fig. 5. These substrates employ high resistivity silicon material and niobium superconducting microstrip transmission lines to minimize the IF signal loss in the IF hybrid assembly. At the operational temperature around 4 K, the niobium circuitry becomes superconducting and, specifically for IF frequencies 4–8 GHz, is equivalent to the perfect conductor that eliminates conducting RF loss whereas the high resistivity silicon performs as a nearly perfect dielectric with all electrons and holes frozen out. At room temperatures, the niobium becomes highly resistive while the silicon substrate has some high but finite conductivity; this combination provides additional protection of the SIS junctions against, for example, static electricity. In the production Band 5 IF hybrid assembly, an improved broadband 4–8 GHz IF hybrid is used, which employs the layout described by Rashid et al. (2014) with amplitude imbalance below 0.6 dB (average imbalance 0.3 dB in 3.5–8.5 GHz band) and phase imbalance ± 3°.
After the IF hybrid assembly, the USB and LSB signals are connected to the low-noise cryogenic amplifiers (LNA1 ; Lopez-Fernandez et al. 2003) via isolators2 . Because of the very limited space available for the IF components at the CCA 4 K thermal plate, the isolators and the LNAs are placed in the space between the CCA 4 K and 15 K plates. Again, gender-matched SMA connectors were employed to achieve IF chain minimum length. In order to facilitate production, the Band 5 CCA design allows preassembly of the cold cartridge assembly parts. For example, the CCA parts between the 300 K plate and 110 K plate with all necessary internal parts could be assembled separately and be integrated with the rest of the Band 5 CCA assembly. Figure 6 displays the CAD drawing of the Band CCA with fiberglass spacers removed to improve visibility of all internal components at the left and the picture of the fully assembled Band 5 CCA at the right. The LO signal transport inside the cartridge carried through oversized WR-10 waveguides are made of coin silver and stainless steel materials. The IF output signals are guided by four stainless steel cryogenic coaxial cables. The Band 5 CCA internal harness is made of cryogenic wires and traced through the cartridge thermal stages with intercepting thermal links to minimize thermal influx from hotter temperature stages to the 4 K stage. The entire design and layout of the Band 5 CCA maximizes access to internal critical components, which should facilitate exchange of the components and repair of the receiver when needed.
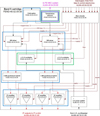 |
Fig. 1 Block diagram for the ALMA Band 5 receiver. The cartridge is a dual-polarization receiver and employs 2SB SIS mixers covering the RF band of 163–211 GHz (with some requirements applicable for the extended RF range, 158–211 GHz). The green box encloses the internal Band 5 receiver components installed at the 110 K temperature stage, the magenta box at 15 K and the blue boxes contain components at 4 K physical temperature. The rest of the components are outside the frontend cryostat. |
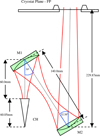 |
Fig. 2 ALMA Band 5 optical layout, not to scale. Optics includes two ellipsoidal mirrors, M1 and M2, and a circular corrugated horn (CH). The design provides frequency independent illumination of the secondary mirror with the edge-taper of about –11.5 dB (Whale et al. 2008). |
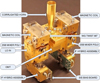 |
Fig. 3 ALMA Band 5 mixer assembly built by GARD. Corrugated horn, OMT and the two 2SB mixers with their associated IF hybrids are integrated in a very compact modular unit allowing effective use of the very limited space inside the Band 5 cartridge, next to the M2 mirror. |
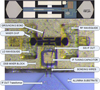 |
Fig. 4 Interior of ALMA Band 5 DSB SIS mixer. The mixer uses the end-piece configuration (Billade et al. 2013). The Nb-AlOx-Nb SIS junctions have a nominal area of 3 μm2, a normal state resistance of Rn = 5 Ω (for twin-junction configuration Belitsky & Tarasov 1991), a quality factor Rj ∕Rn ≥ 20, and employ crystal quartz substrates of 90 μm thick. The insert on top shows the details of the Band 5 SIS mixer chip layout to scale. The SIS mixer chips were fabricated by GARD (Pavolotsky et al. 2011) using the Nanofabrication Laboratory Clean room facility at Chalmers University. |
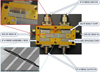 |
Fig. 5 ALMA Band 5 IF hybrid assembly. The IF hybrid assembly is integrated into a box with five separate silicon substrates with niobium superconducting circuitry: two bias-T chips for DC / IF separation, the IF 90-degree hybrid chip, and two output transmission lines (Rashid et al. 2014). The inserts show magnified DC/IF bias-T chip (upper left inset) and the scanning electron microscope image (lower left inset) of the air-bridges with the height of about 5 μm, which connect the fingers of the Lange coupler. All internal parts of the IF hybrid assembly were fabricated by GARD using the Nanofabrication Laboratory Clean room facility at Chalmers University. |
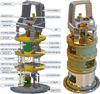 |
Fig. 6 ALMA Band 5 cold cartridge assembly. Left: CAD drawing of the Band 5 CCA with fiberglass spacers removed to improve visibility of all internal components. Right: the picture of the fully assembled Band 5 CCA. |
3 ALMA Band 5 LO and warm cartridge
The LO system for the ALMA Band 5 receiver was designed and built by NRAO and comprises, as for other ALMA Bands (Bryerton et al. 2013), components at room temperature that are integrated into the WCA, and cold components integrated into the CCA. The two frequency doublers (labeled “LO X2 Multiplier” in Fig. 6) in the Band 5 CCA are placed at the 110 K level (see Figs. 1 and 6). The LO / WCA block diagram is presented in Fig. 7. Figure 8 shows a photograph of ALMA Band 5 WCA.
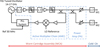 |
Fig. 7 ALMA Band LO/WCA block diagram (Ermakov et al. 2016). |
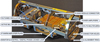 |
Fig. 8 Photo of the ALMA Band 5 WCA. The room temperature IF amplifiers and respective cables and the IF connectors are not mounted on the WCA. |
4 ALMA Band 5 receiver cartridge performance
The cartridge characterization was verified in a specialized test setup built by NOVA around the single-cartridge test cryostat supplied by the National Astronomy Observatory of Japan. The qualification tests of the Band 5 receiver cartridge were always performed at the 4 K physical temperature read by the temperature sensor at the test cryostat 4 K plate. The setup was controlled by a specialized scripting software, which is run to perform the following tests: characterization of the cartridge optical performance (vector measurements of the input beam pattern, cross-pol measurements); sideband rejection characterization and noise temperature measurements for 2 polarizations and USB/LSB IF outputs; phase and amplitude stability of the receiver cartridge under the test; IF output signal variation, slope and out-of-IF band spurious, IF bands’ crosstalk and saturation. Figures 9–13 show the typical for the 73 produced Band 5 cartridges’ performances. All optical measurements were measured at three representative RF frequencies: 165, 197, and 203 GHz.
From the verification in the laboratory and results of the on-site acceptance measurements, it is concluded that the performance of the ALMA Band 5 production cartridge for the produced 73units are meeting their specifications with a comfortable margin.
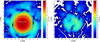 |
Fig. 9 Typical co-polar (left) and cross-polar beam pattern (right) of a Band 5 receiver cartridge, with the secondary telescope mirror indicated by white dash circle on the co-polar plot. This pattern corresponds to polarization 1 in cartridge #53 measured at the LO frequency of 203 GHz. |
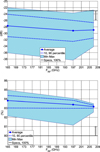 |
Fig. 10 Measured integrated cross-polar (upper panel) and aperture efficiency (lower panel) of the 73 produced Band 5 receiver cartridges vs. signal frequency. The solid black line in each plot shows the ALMA Band 5 specification (for cross-polar purity, lower is better; for aperture efficiency, higher is better). For both plots, the blue solid line is the value averaged over 73 cartridges and blue dash lines indicate 10% and 90%. The light-blue colored area covers all measured values. The gray arrow in each plot points toward the range of the better performance. |
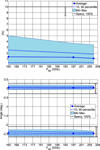 |
Fig. 11 Measured beam squint (upper panel) and angular alignment (lower panel) of the 73 produced Band 5 receiver cartridges vs. signal frequency. The solid black line in each plot shows the ALMA specification (for beam squint, lower is better; for alignment, it is important the measured values fall within the region specified by the black lines). The blue solid line is the value averaged over 73 cartridges and blue dash lines indicate 10 and 90%. The light-blue colored area covers all measured values. The gray arrow(s) in each plot pointed toward the range of the better performance or indicates the allowed range of the measured performance. |
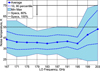 |
Fig. 12 Receiver noise temperature as function of LO frequency. The data from 73 produced Band 5 cartridges have been averaged over polarization channels, IF bandwidth and the sidebands. The solid black line at 75 K shows the upper limit acceptable for the ALMA Band 5 specification. The data show that all receivers have noise temperatures below the limit at all frequencies within the RF band of 163–211 GHz. The dashed black line shows the specification (55 K) where all receivers must have a noise temperature below this value for 80% of the frequencies within the RF band of 163–211 GHz. The blue solid line is the noise temperature value averaged over 73 cartridges and the blue dashed lines indicate the 10th and 90th percentile deviations from the average. The light-blue colored area covers all measured values. The gray arrow in the plot points toward the range of the better performance. |
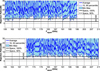 |
Fig. 13 Sideband rejection ratio as function of signal frequency. The data from 73 produced Band 5 cartridges have been averaged over polarization channels. The solid black line shows the specification (10 dB) where the receiver sideband rejection ratio must be above for 90% at all IF frequencies within the RF band of 163–211 GHz. The dashed black line shows the specification (7 dB) where the receiver sideband rejection ratio must be above at all frequencies of the 163–211 GHz RF band. The blue solid line is the value averaged over 73 cartridges and blue dash lines indicate 10 and 90%. The light-blue colored area cover all measured values. The upper plot displays the sideband rejection ratio for lower sideband (LSB) and the lower plot - for the upper sideband (USB). The gray arrows in the plot indicate the range of the better performance. |
5 ALMA Band 5 commissioning
In preparation to the integration process, all Band 5 receiver subassemblies are carefully tested and qualified against their technical specifications before shipment to the ALMA Operation Support Facilities (OSF). As described in Sect. 4, the CCAs were tested at 4 K physical temperature level in a test cryostat at NOVA, and the warm cartridges (WCAs) were tested at the NRAO Technology Center, in a process called preliminary acceptance in-house (PAI). So far, 70 WCAs and over 60 CCAs have been successfully accepted through this process. If a noncompliance with respect to specification was detected, requests for waiver were raised, which were evaluated on a case-by-case basis. Once all PAI results were accepted and eventual waivers approved, the receiver subassemblies were shipped to the ALMA OSF. There, engineering verification takes place, followed by science verification (SV).
6 Integration and engineering verification at ALMA operation support facilities (OSF)
All Band 5 cold receiver cartridges were paired with the warm receiver cartridges and go through a series of tests. At room temperature, the so-called provisional acceptance on-site (PAS) was run, mainly to certify integrity after shipment by cross-check with reference PAI results. The cartridges (a CCA + WCA pair) were then integrated in a suitable FE, typically when this FE is removed from an ALMA antenna for regular maintenance. The integration process was not limited to the installation of the CCA + WCA pair only but also of the cryostat Band 5 vacuum window, IR filters, cold cartridge bias module, power supply module (CPDS), monitor and control configuration parameters including CCA thermometers calibration curves, finding and programming optimal bias voltages and currents of the SIS mixers and IF LNAs. Before cooling down, another warm health check was done to verify the hardware integrity following the integration process. After cool down, the receiver was configured based on the tuning parameters provided by NOVA, for 3.5 K receiver physical temperature (FE typical operation) and 4.0 K (specifications) reference temperatures. Verification tests, which include noise temperature optimization, beam pattern verification, and a number of other specific tests, for example to assess the receiver stability as a function of FE tilt, are performed on the FE Test and Measurement System (FETMS, which is a sort of antenna simulator).
The results are compared against PAI test results and if consistent (preacceptance) the FE with the newly integrated Band 5 is then installed in one of the 66 ALMA array elements (AE) at the Array Operation Site (AOS, at altitude of 5100 m, at the Chajnantor plateau). The following step of the integration process (engineering verification) includes a series of tests, which consist of the receiver re-optimization once installed into the antenna and the total power amplitude stability (measured in terms of Allan variance). These tests were mainly focused on verifying the overall performance of the receiver at system level before delivering them for scientific use. In Figs. 14 and 15 respectively, the noise temperature performances for all the integrated Band 5 receivers and a representative sample of Allan variance results are displayed.
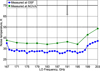 |
Fig. 14 Comparison of the receiver noise temperature measured at NOVA and at OSF vs. LO frequency. The data from the produced Band 5 cartridges have been averaged over polarization channels, IF bandwidth and the sidebands at each location. The solid black line shows the specification (75 K) where the receiver noise temperature must be below at all frequencies within the RF band of 163–211 GHz. The dash black line shows the specification (55 K) where the receiver noise temperature must be below at 80% of frequencies within the RF band of 163–211 GHz. The green solid line is the value averaged over 73 cartridges measured at NOVA and the blue solid line provides averaged noise temperature measurements performed at OSF. Lower operational temperature of the FE cryostat (3.5 K, OSF data compared to 4 K @cold plate NOVA data, Fig. 12) manifests itself with significantly lower receiver noise temperatures around 33 K single sideband. The gray arrow in the plot points toward the range of the better performance. |
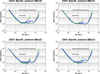 |
Fig. 15 Output total power stability measured on the antenna, post- installation, after the second down-conversion in the four base-bands (USB, LSB for Pol0 and Pol1). Four base-bands have 2 GHz width (max bandwidth 8 GHz). Each base-band can be placed anywhere inside the receiver IF sideband and can overlap. The base-band signals are fed into the correlator. The blue and green lines show Allan variance (2-sample) for Pol0 and Pol1 correspondingly. The upper solid black line show the specification for regular ALMA antenna, the measured Allan variance value to be better than 4 × 10⁻⁷ between 0.05 and 100 seconds and better than 9 × 10⁻⁶ at 300 seconds. The lower solid black line is the specification for ALMA four single-dish antennas better than 1.6 × 10⁻⁷ between 0.05 and 1 seconds. |
7 Science verification
Once all tests within engineering verification process are completed and successful, the ALMA AE with the Band 5 receiver integrated is considered delivered to and fully accepted by the Science Operations team for the final step of integration into the array and verification on sky. The process, common to all bands, mainly consists of verification that the receivers are able to properly lock to the reference LO frequency in the entire range of the operational frequencies, and can detect and measure selected spectral lines (e.g., Fig. 16) of well-known astronomical sources.
The data acquisition for the ALMA Band 5 science verification observations took place during July to October 2016, and is described in detail in (Humphreys et al. 2017). The purpose of science verification was to check different observing modes using Band 5 produced science grade data. To this end, it was decided to study targets at or near the atmospheric water absorption feature at 183.3 GHz. Three observations were carried out, one of which was in full polarization mode at high spectral resolution. Two of these were primarily imaging observations, and the third was a spectral scan across most of the receiver band in order to assess the performance across the full Band 5 frequency range. The targets selected included extragalactic and galactic targets: the nearby merging galaxy Arp 220, the evolved star VY CMa and the massive star-forming region Sgr B2. On-sky receiver performance was consistent with expectations. The data, images and scripts produced to analyze the observational data were released to the astronomical community in December 2016.
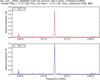 |
Fig. 16 Detection of the HCN (J = 2–1, v = 0) line with rest frequency at ~177.261 GHz in the Orion OMC1 region. The line is detected at ~177.235 GHz in both polarizations for FE 32 installed in DA60. |
7.1 Arp 220
The observations of Arp 220 (z ≈ 0.018) were made on 26 July 2016, during excellent weather conditions (precipitable water vapor of ~0.3 mm). Twelve ALMA antennas were used, on baselines ranging from ~30 to 480 meters. The resulting synthesized beam was 0.7″ × 0.6″. To test the consistency the data were calibrated both manually and using the ALMA Pipeline. They were then imaged manually, which yielded maps of several lines including H2 O, CS and HNC. Arp 220 has a double nucleus with a projected separation of about 1.1 arcsec, for example (Scoville et al. 2016), and these are clearly apparent in the Band 5 data (Humphreys et al. 2017). König et al. (2017) compared the ALMA H2 O 183 GHz line with that observed using the IRAM 30 m and APEX telescopes (see Cernicharo et al. 2006 and Galametz et al. 2016 respectively). The line profiles are surprisingly similar over ten years, given that maser emission can display high variability. König et al. (2017) conclude that the emission is associated with star formation, and that the line profile is composed of the emission of many unresolved maser features that, on average, result in approximately constant flux.
7.2 VY CMa
Full polarisation, high spectral resolution observations of VY CMa were made on 16 October 2016 using fifteen antennas. The resulting synthesized beam size (i.e., resolution) was ~0.8″× 0.3″. The five spectral windows of the observations covered the frequencies of the 183.3 GHz H2 O line and those of the SiO v = 0 and 1, J = 4–3 lines. It also included some broad windows aimed at providing high continuum sensitivity. The SiO and H2 O masers are well-known in the circumstellar envelope of VY CMa, for example (Richards et al. 2014; Humphreys et al. 2017), and maser radiation can be highly polarised. Vlemmings et al. (2017) used the ALMA Band 5 science verification data to show that the VY CMa continuum emission and SiO lines are polarized. The continuum polarisation is interpreted as due to emission from magnetically aligned grains. The SiO line polarisation is also thought to be tracing the magnetic field structure. For evolved stars such as VY CMa, and those of lower mass, the full polarisation capabilities of ALMA are likely to prove transformational in understanding asymmetry in the mass loss process and shaping of asymptotic giant branch stars to Planetary Nebulae.
7.3 Sgr B2
For observing the massive star-forming region Sgr B2, a region known for its rich chemistry (e.g. Belloche et al. 2013), a hybrid ALMA array including eight to twelve 12 m antennas and four 7 m antennas was used. The 12 m antennas were on baselines of up to 1.6 km. An almost complete spectral scan of the Band 5 receiver frequency range was obtained, using thirteen separate tunings. The uv-coverage of these observations was relatively sparse, and the source morphology very complex, such that imaging was challenging. Compared with standard ALMA observations the resulting image fidelity was relatively low. Nonetheless the dataset reveals a forest of molecular lines at a velocity resolution of ~1 km s−1. Sgr B2 had previously been observed using APEX SEPIA Band 5 (Immer et al. 2016). The brightest lines, which arise from more extended emission recovered by the APEX observations, are not fully recovered in the ALMA observations (whereas more compact structures are recovered well). It was also possible to map some of the water maser features associated with the massive star-forming region.
7.4 Cycle 5 capabilities
ALMA Band 5 capabilities will be offered for Principal Investigator (PI) science during Cycle-5 (starting mid-cycle in March 2018) with the following guidelines: 43 × 12 m, 10 × 7 m, and three total power (TP) antennas for a total of 56 available. The guideline for the minimum number of antennas to perform science observations in Cycle 5 is 41 × 12 m + 9 × 7 m + 3 × TP = 53 antennas.
Acknowledgements
The Atacama Large Millimeter/submillimeter Array (ALMA), an international astronomical facility, is a partnership of the European Organisation for Astronomical Research in the Southern Hemisphere (ESO), the U.S. National Science Foundation (NSF) and the National Institutes of Natural Sciences (NINS) of Japan in cooperation with the Republic of Chile. ALMA is funded by ESO on behalf of its Member States, by NSF in cooperation with the National Research Council of Canada (NRC) and the National Science Council of Taiwan (NSC) and by NINS in cooperation with the Academia Sinica (AS) in Taiwan and the Korea Astronomy and Space Science Institute (KASI). Further information on the ALMA organization, site, and instruments could be found online: http://www.almaobservatory.org/. We would like to thank T. de Graauw, former ALMA Director, who supported ALMA Band 5 Full Production project. We would like to thank J. Kooi, C. Honingh, J.D. Gallego, B. Jackson, A.W. Lichtenberger, S. Thacker, S. Mahieu, D. Rabanus, N. Whyborn, all experts involved in the PDR, CDR and MRR meetings where the design of the Band 5 receiver was reviewed critically and valuable feedback was provided. We thank Joint ALMA Observatory and European ARC Node staff and fellows, Neil Phillips, Hau-Yu (Baobab) Lu and Katharina Immer, for their participation in the Band 5 commissioning and science verification.
References
- Asayama, S., & Kamikura, M. 2009, J. Infrared Milli. Terahz. Waves, 30, 573 [CrossRef] [Google Scholar]
- Belitsky, V., & Tarasov, M. 1991, IEEE Trans. Magn., 27, 2638 [NASA ADS] [CrossRef] [Google Scholar]
- Belloche, A., Müller, H. S. P., Menten, K. M., Schilke, P., & Comito, C. 2013, A&A, 559, A47 [NASA ADS] [CrossRef] [EDP Sciences] [Google Scholar]
- Billade, B., Nystrom, O., Meledin, D., et al. 2012, IEEE Trans. Terahertz Sci. Technol., 2, 208 [NASA ADS] [CrossRef] [Google Scholar]
- Billade, B., Pavolotsky, A., & Belitsky, V. 2013, IEEE Trans. Terahertz Sci. Technol., 3, 416 [NASA ADS] [CrossRef] [Google Scholar]
- Bryerton, E., Saini, K., Muehlberg, J., Vaselaar, D., & Thacker, D. 2013, in 2013 IEEE MTT-S Int. Microwave Symp. Digest (MTT) IEEE, 1 [Google Scholar]
- Cernicharo, J., Pardo, J. R., & Weiss, A. 2006, ApJ, 646, 49 [NASA ADS] [CrossRef] [Google Scholar]
- Ermakov, A., Belitsky, V., Ahgdam, P., et al. 2016, in 27th Int. Symp. Space Terahertz Technol., Nanjing, 113 [Google Scholar]
- Galametz, M., Zhang, Z.-Y., Immer, K., et al. 2016, MNRAS, 462, 36 [Google Scholar]
- Humphreys, E. M. L., Vlemmings, W. H. T., Impellizzeri, C. M. V., et al. 2016, A&A, 592, L13 [NASA ADS] [CrossRef] [EDP Sciences] [Google Scholar]
- Humphreys, L., Biggs, A., Immer, K., et al. 2017, The Messenger, 167, 7 [NASA ADS] [Google Scholar]
- Immer, K., Belitsky, V., Olberg, M., et al. 2016, The Messenger, 165, 13 [NASA ADS] [Google Scholar]
- König, S., Martín, S., Muller, S. et al. 2017, A&A, 602, A42 [NASA ADS] [CrossRef] [EDP Sciences] [Google Scholar]
- Laing, R., Maiolino, R., Rykaczewski, H., & Testi, L. 2010, The Messenger, 141, 41 [NASA ADS] [Google Scholar]
- Lopez-Fernandez, I., Diez, C., Gallego, J. D., & Barcia, A. 2003, in 14th Int. Symp. Space Terahertz Technol., 502 [Google Scholar]
- Nyström, O., Rashid, H., Billade, B., et al. 2010, in 21st Int. Symp. Space Terahertz Technol. 2010, ISSTT 2010 [Google Scholar]
- Pavolotsky, A., Dochev, D., & Belitsky, V. 2011, J. Appl. Phys., 109, 024502 [NASA ADS] [CrossRef] [Google Scholar]
- Rashid, H., Meledin, D., Desmaris, V., Pavolotsky, A., & Belitsky, V. 2014, IEEE Trans. Terahertz Sci. Technol., 4, 193 [Google Scholar]
- Richards, A. M. S., Impellizzeri, C. M. V., Humphreys, E. M., et al. 2014, A&A, 572, L9 [Google Scholar]
- Scoville, N., Sheth, K., Aussel, H., et al. 2016, ApJ, 820, 1 [Google Scholar]
- Vlemmings, W. H. T., Khouri, T., Martí-Vidal, I., et al. 2017, A&A, 603, A92 [NASA ADS] [CrossRef] [EDP Sciences] [Google Scholar]
- Whale, M., Trappe, N., & Belitsky, V. 2008, in 19th Int. Symp. Space Terahertz Technol., 368 [Google Scholar]
See TTI Norte, 39011 Santander, Cantabria, Spain, http://www.ttinorte.es/
See QuinstarTechnology Inc., http://www.quinstar.com/
All Tables
All Figures
|
Fig. 1 Block diagram for the ALMA Band 5 receiver. The cartridge is a dual-polarization receiver and employs 2SB SIS mixers covering the RF band of 163–211 GHz (with some requirements applicable for the extended RF range, 158–211 GHz). The green box encloses the internal Band 5 receiver components installed at the 110 K temperature stage, the magenta box at 15 K and the blue boxes contain components at 4 K physical temperature. The rest of the components are outside the frontend cryostat. |
| In the text | |
|
Fig. 2 ALMA Band 5 optical layout, not to scale. Optics includes two ellipsoidal mirrors, M1 and M2, and a circular corrugated horn (CH). The design provides frequency independent illumination of the secondary mirror with the edge-taper of about –11.5 dB (Whale et al. 2008). |
| In the text | |
|
Fig. 3 ALMA Band 5 mixer assembly built by GARD. Corrugated horn, OMT and the two 2SB mixers with their associated IF hybrids are integrated in a very compact modular unit allowing effective use of the very limited space inside the Band 5 cartridge, next to the M2 mirror. |
| In the text | |
|
Fig. 4 Interior of ALMA Band 5 DSB SIS mixer. The mixer uses the end-piece configuration (Billade et al. 2013). The Nb-AlOx-Nb SIS junctions have a nominal area of 3 μm2, a normal state resistance of Rn = 5 Ω (for twin-junction configuration Belitsky & Tarasov 1991), a quality factor Rj ∕Rn ≥ 20, and employ crystal quartz substrates of 90 μm thick. The insert on top shows the details of the Band 5 SIS mixer chip layout to scale. The SIS mixer chips were fabricated by GARD (Pavolotsky et al. 2011) using the Nanofabrication Laboratory Clean room facility at Chalmers University. |
| In the text | |
|
Fig. 5 ALMA Band 5 IF hybrid assembly. The IF hybrid assembly is integrated into a box with five separate silicon substrates with niobium superconducting circuitry: two bias-T chips for DC / IF separation, the IF 90-degree hybrid chip, and two output transmission lines (Rashid et al. 2014). The inserts show magnified DC/IF bias-T chip (upper left inset) and the scanning electron microscope image (lower left inset) of the air-bridges with the height of about 5 μm, which connect the fingers of the Lange coupler. All internal parts of the IF hybrid assembly were fabricated by GARD using the Nanofabrication Laboratory Clean room facility at Chalmers University. |
| In the text | |
|
Fig. 6 ALMA Band 5 cold cartridge assembly. Left: CAD drawing of the Band 5 CCA with fiberglass spacers removed to improve visibility of all internal components. Right: the picture of the fully assembled Band 5 CCA. |
| In the text | |
|
Fig. 7 ALMA Band LO/WCA block diagram (Ermakov et al. 2016). |
| In the text | |
|
Fig. 8 Photo of the ALMA Band 5 WCA. The room temperature IF amplifiers and respective cables and the IF connectors are not mounted on the WCA. |
| In the text | |
|
Fig. 9 Typical co-polar (left) and cross-polar beam pattern (right) of a Band 5 receiver cartridge, with the secondary telescope mirror indicated by white dash circle on the co-polar plot. This pattern corresponds to polarization 1 in cartridge #53 measured at the LO frequency of 203 GHz. |
| In the text | |
|
Fig. 10 Measured integrated cross-polar (upper panel) and aperture efficiency (lower panel) of the 73 produced Band 5 receiver cartridges vs. signal frequency. The solid black line in each plot shows the ALMA Band 5 specification (for cross-polar purity, lower is better; for aperture efficiency, higher is better). For both plots, the blue solid line is the value averaged over 73 cartridges and blue dash lines indicate 10% and 90%. The light-blue colored area covers all measured values. The gray arrow in each plot points toward the range of the better performance. |
| In the text | |
|
Fig. 11 Measured beam squint (upper panel) and angular alignment (lower panel) of the 73 produced Band 5 receiver cartridges vs. signal frequency. The solid black line in each plot shows the ALMA specification (for beam squint, lower is better; for alignment, it is important the measured values fall within the region specified by the black lines). The blue solid line is the value averaged over 73 cartridges and blue dash lines indicate 10 and 90%. The light-blue colored area covers all measured values. The gray arrow(s) in each plot pointed toward the range of the better performance or indicates the allowed range of the measured performance. |
| In the text | |
|
Fig. 12 Receiver noise temperature as function of LO frequency. The data from 73 produced Band 5 cartridges have been averaged over polarization channels, IF bandwidth and the sidebands. The solid black line at 75 K shows the upper limit acceptable for the ALMA Band 5 specification. The data show that all receivers have noise temperatures below the limit at all frequencies within the RF band of 163–211 GHz. The dashed black line shows the specification (55 K) where all receivers must have a noise temperature below this value for 80% of the frequencies within the RF band of 163–211 GHz. The blue solid line is the noise temperature value averaged over 73 cartridges and the blue dashed lines indicate the 10th and 90th percentile deviations from the average. The light-blue colored area covers all measured values. The gray arrow in the plot points toward the range of the better performance. |
| In the text | |
|
Fig. 13 Sideband rejection ratio as function of signal frequency. The data from 73 produced Band 5 cartridges have been averaged over polarization channels. The solid black line shows the specification (10 dB) where the receiver sideband rejection ratio must be above for 90% at all IF frequencies within the RF band of 163–211 GHz. The dashed black line shows the specification (7 dB) where the receiver sideband rejection ratio must be above at all frequencies of the 163–211 GHz RF band. The blue solid line is the value averaged over 73 cartridges and blue dash lines indicate 10 and 90%. The light-blue colored area cover all measured values. The upper plot displays the sideband rejection ratio for lower sideband (LSB) and the lower plot - for the upper sideband (USB). The gray arrows in the plot indicate the range of the better performance. |
| In the text | |
|
Fig. 14 Comparison of the receiver noise temperature measured at NOVA and at OSF vs. LO frequency. The data from the produced Band 5 cartridges have been averaged over polarization channels, IF bandwidth and the sidebands at each location. The solid black line shows the specification (75 K) where the receiver noise temperature must be below at all frequencies within the RF band of 163–211 GHz. The dash black line shows the specification (55 K) where the receiver noise temperature must be below at 80% of frequencies within the RF band of 163–211 GHz. The green solid line is the value averaged over 73 cartridges measured at NOVA and the blue solid line provides averaged noise temperature measurements performed at OSF. Lower operational temperature of the FE cryostat (3.5 K, OSF data compared to 4 K @cold plate NOVA data, Fig. 12) manifests itself with significantly lower receiver noise temperatures around 33 K single sideband. The gray arrow in the plot points toward the range of the better performance. |
| In the text | |
|
Fig. 15 Output total power stability measured on the antenna, post- installation, after the second down-conversion in the four base-bands (USB, LSB for Pol0 and Pol1). Four base-bands have 2 GHz width (max bandwidth 8 GHz). Each base-band can be placed anywhere inside the receiver IF sideband and can overlap. The base-band signals are fed into the correlator. The blue and green lines show Allan variance (2-sample) for Pol0 and Pol1 correspondingly. The upper solid black line show the specification for regular ALMA antenna, the measured Allan variance value to be better than 4 × 10⁻⁷ between 0.05 and 100 seconds and better than 9 × 10⁻⁶ at 300 seconds. The lower solid black line is the specification for ALMA four single-dish antennas better than 1.6 × 10⁻⁷ between 0.05 and 1 seconds. |
| In the text | |
|
Fig. 16 Detection of the HCN (J = 2–1, v = 0) line with rest frequency at ~177.261 GHz in the Orion OMC1 region. The line is detected at ~177.235 GHz in both polarizations for FE 32 installed in DA60. |
| In the text | |
Current usage metrics show cumulative count of Article Views (full-text article views including HTML views, PDF and ePub downloads, according to the available data) and Abstracts Views on Vision4Press platform.
Data correspond to usage on the plateform after 2015. The current usage metrics is available 48-96 hours after online publication and is updated daily on week days.
Initial download of the metrics may take a while.