Fig. 11
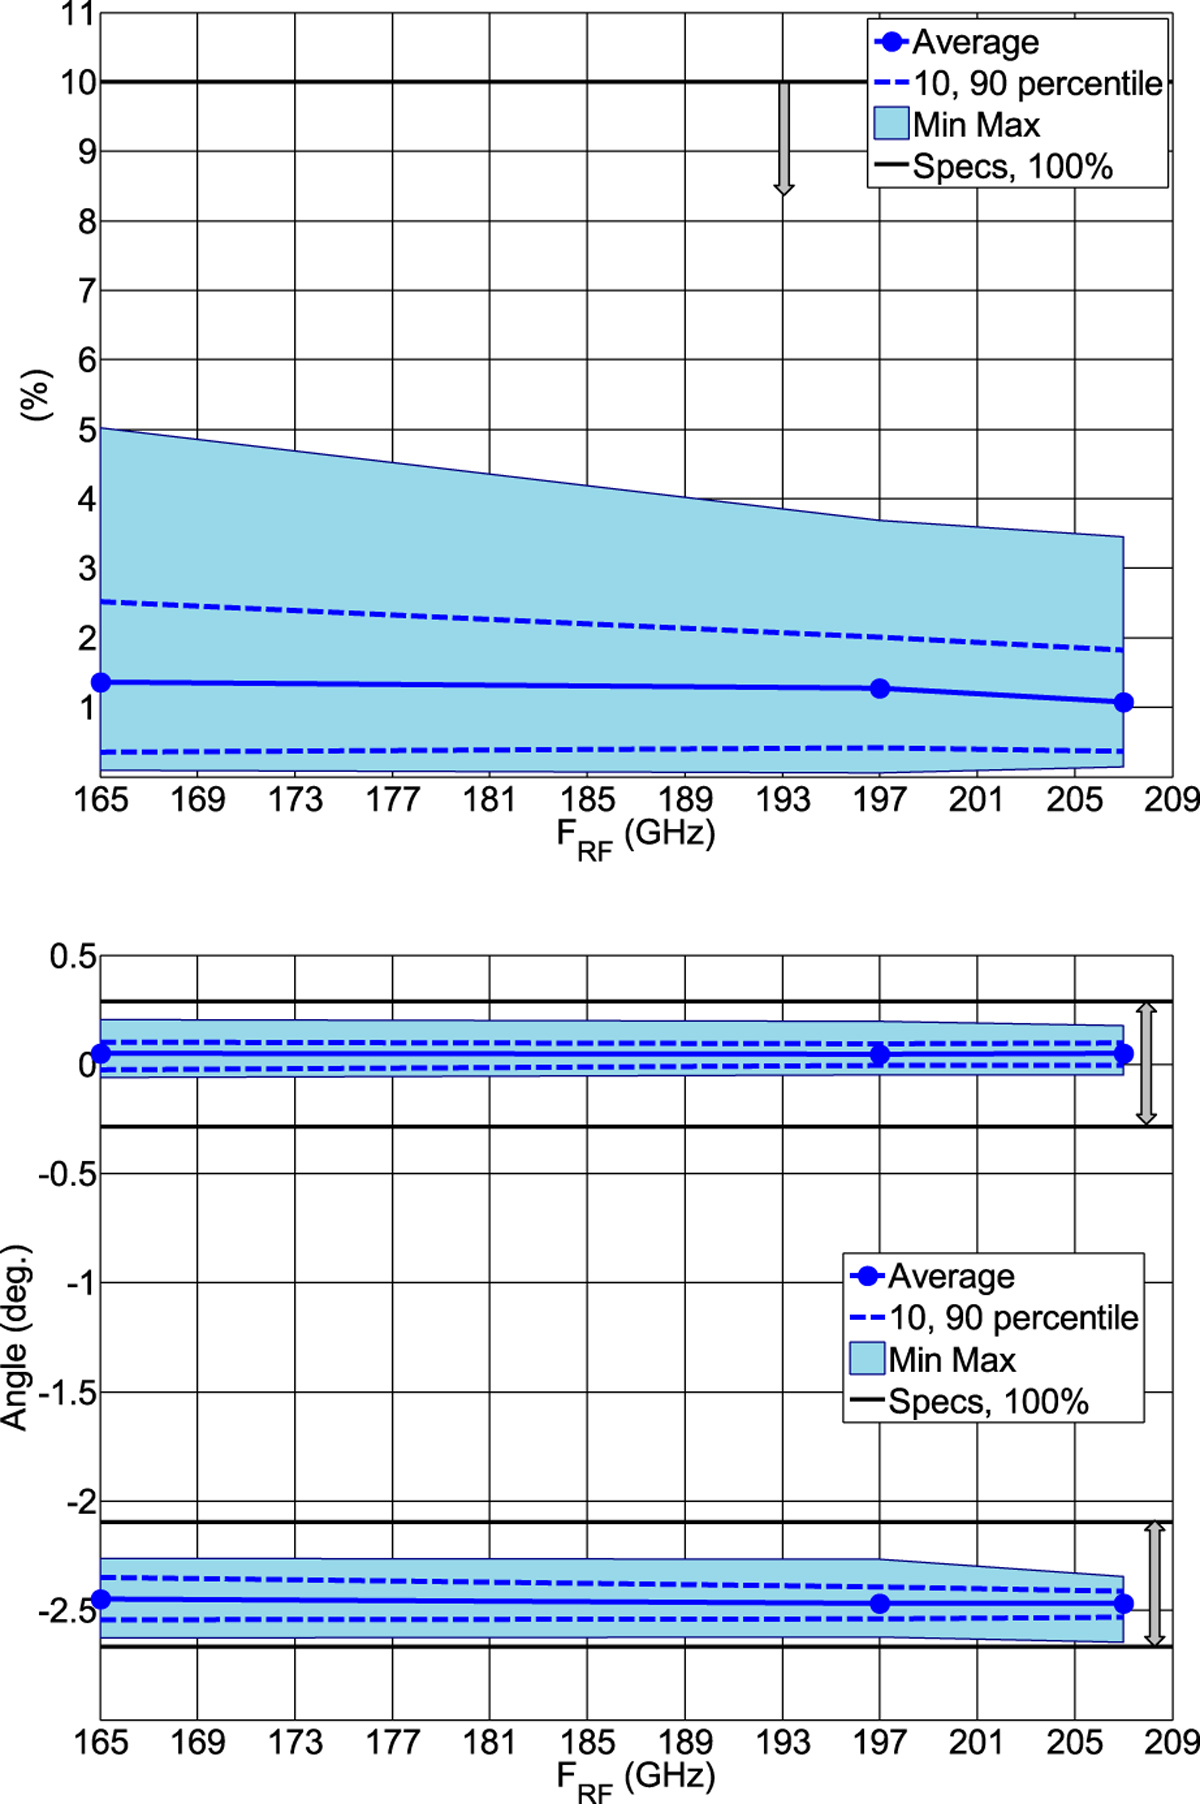
Measured beam squint (upper panel) and angular alignment (lower panel) of the 73 produced Band 5 receiver cartridges vs. signal frequency. The solid black line in each plot shows the ALMA specification (for beam squint, lower is better; for alignment, it is important the measured values fall within the region specified by the black lines). The blue solid line is the value averaged over 73 cartridges and blue dash lines indicate 10 and 90%. The light-blue colored area covers all measured values. The gray arrow(s) in each plot pointed toward the range of the better performance or indicates the allowed range of the measured performance.
Current usage metrics show cumulative count of Article Views (full-text article views including HTML views, PDF and ePub downloads, according to the available data) and Abstracts Views on Vision4Press platform.
Data correspond to usage on the plateform after 2015. The current usage metrics is available 48-96 hours after online publication and is updated daily on week days.
Initial download of the metrics may take a while.