| Issue |
A&A
Volume 606, October 2017
|
|
|---|---|---|
| Article Number | A48 | |
| Number of page(s) | 15 | |
| Section | Stellar structure and evolution | |
| DOI | https://doi.org/10.1051/0004-6361/201730706 | |
| Published online | 09 October 2017 | |
High-resolution TNG spectra of T Tauri stars
Near-IR GIANO observations of the young variables XZ Tauri and DR Tauri
1 INAF–Osservatorio Astronomico di Roma, via di Frascati 33, 00040 Monte Porzio Catone, Italy
e-mail: This email address is being protected from spambots. You need JavaScript enabled to view it.
2 INAF–Osservatorio Astrofisico di Catania, via S. Sofia 78, 95123 Catania, Italy
3 INAF–Osservatorio Astrofisico di Arcetri, Largo Enrico Fermi 5, 50125 Firenze, Italy
4 Telescopio Nazionale Galileo, Fundación Galileo Galilei – INAF, Rambla José Ana Fernández Pérez, 7, 38712 Breña Baja, TF, Spain
5 INAF–Osservatorio Astronomico di Bologna, via Ranzani 1, 40127 Bologna, Italy
Received: 27 February 2017
Accepted: 12 June 2017
Abstract
Aims. We aim to characterise the star-disk interaction region in T Tauri stars that show photometric and spectroscopic variability.
Methods. We used the GIANO instrument at the Telescopio Nazionale Galileo to obtain near-infrared high-resolution spectra (R ~ 50 000) of XZ Tau and DR Tau, which are two actively accreting T Tauri stars classified as EXors. Equivalent widths and profiles of the observed features are used to derive information on the properties of the inner disk, the accretion columns, and the winds.
Results. Both sources display composite H i line profiles, where contributions from both accreting gas and high-velocity winds can be recognised. These lines are progressively more symmetric and narrower with increasing upper energy which may be interpreted in terms of two components with different decrements or imputed to self-absorption effects. XZ Tau is observed in a relatively high state of activity with respect to literature observations. The variation of the He i 1.08 μm line blue-shifted absorption, in particular, suggests that the inner wind has undergone a dramatic change in its velocity structure, connected with a recent accretion event. DR Tau has a more stable wind as its He i 1.08 μm absorption does not show variations with time in spite of strong variability of the emission component. The IR veiling in the two sources can be interpreted as due to blackbody emission at temperatures of 1600 K and 2300 K for XZ Tau and DR Tau, respectively, with emitting areas ~30 times larger than the central star. While for XZ Tau these conditions are consistent with emission from the inner rim of the dusty disk, the fairly high temperature inferred for DR Tau might suggest that its veiling originates from a thick gaseous disk located within the dust sublimation radius. Strong and broad metallic lines, mainly from C i and Fe i, are detected in XZ Tau, similar to those observed in other EXor sources during burst phases. At variance, DR Tau shows weaker and narrower metallic lines, despite its larger accretion luminosity. This suggests that accretion is not the only driver of metallic line excitation.
Conclusions. The presented observations demonstrate the potential of wide-band, high-resolution near-IR spectroscopy to simultaneously probe the different phenomena that occur in the interaction region between the stellar magnetosphere and the accretion disk, thus providing hints on how these two structures are linked to each other.
Key words: stars: variables: T Tauri, Herbig Ae/Be / stars: pre-main sequence / line: profiles / stars: individual: XZ Tau / stars: individual: DR Tau / techniques: spectroscopic
© ESO, 2017
1. Introduction
Accretion, jets, and winds are phenomena that characterise the pre-main sequence phase of stellar evolution (classical T Tauri, (CTT), phase). They are also the main mechanisms causing gas dispersal in circumstellar disks formed during the protostellar phase, and as such they influence the disk evolution and the subsequent planetary system formation processes (Alexander et al. 2014). These processes occur on spatial scales (fraction of AU) that cannot be resolved by present instrumentation. However, selective tracers of the different phenomena can be identified in the optical/IR spectra of CTT stars and used to infer physical and kinematical properties of the relevant regions, provided that sufficient spectral resolution is adopted.
This is efficiently done with echelle spectrographs that simultaneously cover a wide wavelength range so that the various phenomena characterizing the active stellar and circumstellar environment can be simultaneously probed. This is particularly important for stars known to be variable, as one can derive a snapshot of all the relevant physical parameters in a specific phase of the system activity. The potential of wide-band optical/infrared spectroscopy has recently been demonstrated by several spectral surveys on populations of young stellar objects (YSOs) (e.g., Antoniucci et al. 2014; Alcalá et al. 2017; Manara et al. 2017), where this technique has been used to derive a complete characterization of the stellar and accretion properties of the stars.
Wide-band, near-IR (NIR) high-resolution spectroscopy is a much less explored observational tool for the characterization of YSOs, despite the presence of several important diagnostic features providing complementary information to those in the optical range.
The power of NIR high-resolution spectroscopy relies in particular on its unique ability to simultaneously probe the properties of gas and dust at different spatial scales in the star-disk interaction regions: the accretion columns and hot spots, the inner gaseous disk, the stellar and disk winds, and the collimated jets.
For example, the infrared emission in excess to the photospheric spectrum is directly connected with the properties of the inner disk, and can be inferred from a measure of the veiling on the numerous IR absorption photospheric lines, provided that the spectral resolution is high enough (R ≳ 30 000; e.g. McClure et al. 2013; Johns-Krull & Valenti 2001; Muzerolle et al. 2003; Fohla & Emerson 1999). This NIR excess is attributed to the emission of the inner edge of the dusty disk, where the dust is heated by radiation from both the stellar photosphere and accretion shock. As such, it can provide interesting complementary information with respect to the ultraviolet and optical excess, which originate directly from the accretion shock at the stellar surface (e.g. Calvet & Gullbring 1998; McClure et al. 2013).
Infrared permitted lines of H i from the Brackett and Paschen series are less affected than Balmer lines by opacity effects and thus can be more efficiently used to retrieve information on the different components contributing to their profile (e.g. accretion columns and winds; Folha & Emerson 2001; Nisini et al. 2004; Antoniucci et al. 2017; Giannini et al. 2017). In addition, the lower extinction with respect to optical lines makes the IR H i lines excellent proxies for accretion luminosity in moderately embedded sources.
Among other permitted lines, the He i 1.08 μm line is particularly interesting: it has a high metastable lower level, setting up a favourable situation for tracing outflowing gas in absorption. Indeed, the He i 1.08 μm line profiles in CTTs often display prominent P Cygni absorption indicative of ionised winds close to the central star (Edwards et al. 2003). Models show that the shape of this absorption changes depending on the nature of the wind (Kurosawa et al. 2011; Kwan et al. 2007); disk-winds produce a narrow blue-shifted absorption while in stellar winds the absorption covers a much larger velocity range. The He i 1.08 μm line profile thus provides direct pieces of information on the properties of the inner winds that are not retrievable from optical observations. The He i 1.08 μm line is also sensitive to magnetospheric accretion flows, as it shows redshifted absorptions below the continuum more often that other permitted lines (e.g. Edwards et al. 2006).
Finally, IR spectroscopy is able to probe the molecular gas in the inner gaseous disk and winds, through H2 ro-vibrational lines and the CO overtone emission. A spectral resolution of a few km s-1 is needed in order to distinguish their origin in gas bound to the disk or from shocked emission in outflows.
We report here the first IR spectroscopic observations covering (almost completely) the spectral range from 1 to 2.4 μm at high spectral resolution (R ~ 50 000) of two accretion-active T Tauri stars, namely XZ Tau and DR Tau. The aim of this work is to characterise the star-disk interaction regions of the two stars through the analysis of the above described tracers, eventually putting in relation the different phenomena probed by the observed spectral features.
The paper is structured as follows: the two sources are described in Sect. 2. Observations, data reduction, and a discussion on the photometric level of the sources at the moment of the observations are given in Sects. 3 and 4. Results are presented in Sect. 5 and the derived veiling and rotational velocities are reported in Sect. 6. Parameters derived from line analysis are presented and discussed in Sects. 7–9, while conclusions are summarised in Sect. 10.
2. Description of the sources
XZ Tau and DR Tau are two well studied CTTs that present episodic photometric and spectroscopic variability. As such they have been included among the variable stars of EXor type (e.g. Lorenzetti et al. 2009). These are young sources showing erratic increases of brightness with typical time-scales of months/years, which can be explained in terms of recurrent events of enhanced disk accretion (e.g. Audard et al. 2014; Lorenzetti et al. 2012).
XZ Tau has displayed quite frequent variations in the recent past, with recurrent increases of the optical brightness up to 2 mag. The source consists of two components: XZ Tau N (or XZ Tau B) and XZ Tau S (or XZ Tau A), separated by 0.̋3. The two sources have similar masses (0.37 and 0.29 M⊙, respectively) but XZ Tau N is the one that shows the richest spectrum in optical emission lines (Hartigan et al. 2003). Carrasco-González et al. (2009) suggested the presence of a third component at about 0.̋09 from XZ Tau S, which was, however, not confirmed by recent ALMA observations (ALMA partnership 2015; Zapata et al. 2015). HST observations have shown a series of expanding bubbles around the system: this outflow is driven by XZ Tau S, as indicated by their alignment with this source (Krist et al. 2008). ALMA observations have also revealed the presence of a compact and collimated bipolar molecular outflow that is at the base of the optical expanding flow (Zapata et al. 2015). The source shows significant optical-line-profile variability on time-scales of months (Chou et al. 2013).
DR Tau showed a slow but constant brightness increase between 1960 and 1980 of more than three visual magnitudes. After this period, its average brightness has remained high, while showing smaller variations on time-scales of days. Similarly to XZ Tau, the optical spectrum of DR Tau is characterised by strong and variable (both in strength and in shape) H i lines with signatures of both infall and winds (Alencar et al. 2001). A strong P Cygni signature in the He i 1.08 μm line (Edwards et al. 2006) also testifies for a hot stellar wind. DR Tau is among the CTTs that present the largest values of the veiling, both in the optical and in the IR, indicative of a large accretion luminosity. High-velocity blue-shifted [OI]6300 Å emission, indicative of a jet, was present in the spectrum published by Hartigan et al. (1995), but seems to have recently disappeared (Simon et al. 2016).
3. Observations and data reduction
XZ Tau and DR Tau were observed in September 2014, 8th and 13th, respectively, with the GIANO spectrograph (Oliva et al. 2012; Origlia et al. 2014; Tozzi et al. 2014) placed at the Nasmith A focus of the Telescopio Nazionale Galileo (TNG; La Palma, Spain). GIANO is a cross-dispersed infrared (0.95–2.4 μm) spectrograph with a resolving power of R = 50 000. The data were collected during the Science Verification with the instrument in a provisional configuration with the cryogenic spectrograph positioned on the rotating floor and far from the telescope focal plane. With this set-up GIANO received the light from the telescope through two fibres (A and B) with a diameter on sky of 1′′ and placed at a fixed projected distance of 3 arcsec. The spectra were acquired with the nodding-on-fibre technique, that is, by alternately observing the target through fibre A and B (while the other fibre observes the sky) with the same exposure time. The subtraction of the two exposures ensures an optimal removal of both the sky emission and instrumental background. The total exposure time was 30 min for both DR Tau and XZ Tau.
The extraction and wavelength calibration of the spectra were performed following the 2D GIANO data reduction prescriptions1, as described also in Carleo et al. (2016) and Caffau et al. (2016).
Exposures with a halogen lamp were employed to map the order geometry and for flat-field, while wavelength calibration was based on lines from a uranium-neon lamp. The calibration produces an accuracy on the velocity of the order of 0.5 km s-1 as estimated from the radial velocity analysis discussed in Sect. 4.1.
The final GIANO spectral coverage is complete up to 1.7 μm, whereas it is about 75% in the K-band, because at longer wavelengths the orders become larger than the 2k × 2k detector. In particular, the region at 2.16 μm around the Brγ line is not covered.
The one-dimensional spectra resulting from the GIANO pipeline are not corrected for the contribution of telluric features. Therefore, spectra of telluric standards were obtained to clean the target spectra from this contribution. In particular, the spectrum of the star HIP 029216 was employed for XZ Tau and that of HIP 089584 for DR Tau. After removing the intrinsic features of the standard spectra, we used the IRAF2 task telluric to correct for the telluric absorptions. The procedure consists of dividing the target spectrum by the telluric spectrum multiplied by an appropriate scaling factor that depends on the ratio of the airmass of the target and the telluric standard. This factor is typically close to unity, as targets and their assigned telluric standards were observed at very similar airmasses.
4. Photometric state of the two sources
Near-infrared photometry of the targets is not available for the dates of the GIANO spectroscopy. However, a few NIR photometric measurements of the two sources, taken with a sparse sampling, were acquired within the EXORCISM programme (Antoniucci et al. 2013, 2014) using the SWIRCAM camera mounted on the Campo Imperatore 1.1 m AZT-24 telescope (D’Alessio et al. 2000). The corresponding light curves of XZ Tau and DR Tau during the last few years are shown in Fig. 1.
The mean brightness of XZ Tau was steadily increasing in the period of the GIANO observations. We have considered a linear fit over the two photometric points before and the two after our observations, thus obtaining a linear averaged trend for that period. The fit gives, at the date of the GIANO observation, J = 8.69, H = 7.57, and K = 6.75, which we assume as the magnitudes of XZ Tau. These values can be compared with the median near-IR magnitudes (basically indicating the quiescence values) ⟨ J ⟩ = 9.12, ⟨ H ⟩ = 7.92, and ⟨ K ⟩ = 7.05, obtained from all the available data. The registered magnitude difference supports the evidence that the object was in a moderately active accretion state at the moment of our observations.
For DR Tau, the closest photometric measurements were acquired 35 days after the GIANO spectroscopy, providing J = 8.99, H = 7.81, and K = 6.85, which are very similar to the median values obtained from the EXORCISM database (⟨ J ⟩ = 8.93, ⟨ H ⟩ = 7.79, and ⟨ K ⟩ = 6.86). Considering this and that the light curve in Fig. 1 shows no clear trend in the period of interest, we may assume that the object was at the same (substantially constant) luminosity level typical of its recent past.
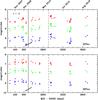 |
Fig. 1 Near-infrared (JHK bands) lightcurves of XZ Tau (top) and DR Tau (bottom) based on observations taken within the EXORCISM programme around the date of GIANO observations, which is indicated by the vertical dashed line. |
5. Results
5.1. Radial velocity
We determined the radial velocities (RVs) of XZ Tau and DR Tau, observing with GIANO two slowly-rotating non-accreting templates with the same spectral types as both targets (i.e. M2 and K7, respectively) and known RVs, namely HD 119850 and HD 28343. The heliocentric RVs of XZ Tau and DR Tau were determined through the task fxcor of the IRAF package rv, which cross-correlates the target and template spectra, excluding regions affected by broad lines or prominent telluric features. The centroids of the cross-correlation function (CCF) peaks were determined by adopting Gaussian fits, and the RV errors were computed using a procedure that considers the fitted peak height and the antisymmetric noise (see Tonry & Davis 1979). This procedure was applied for all spectral orders we analyzed for the veiling and rotational velocity determinations (Sect. 6). The weighted averages of the RV measurements obtained for each useful spectral order are Vrad = 18.5 ± 0.6 and 22.8 ± 1.1 km s-1 for XZ Tau and DR Tau, respectively; in good agreement with the values obtained by Nguyen et al. (2012).
5.2. Observed emission features
The XZ Tau and DR Tau GIANO spectra are dominated by strong emission lines of H i (Brackett and Paschen), He i, and other metallic neutral lines. Identification of the permitted lines was performed using the Atomic line list3 and the NIST4 databases. Table 1 lists the major features, including the identifications, equivalent widths (EWs), and kinematical parameters (i.e. peak velocity Vp and FWHM ) derived by a Gaussian fitting of the emission line. Velocities were corrected for the stellar radial velocity discussed in Sect. 5.1.
The upper panel of Table 1 includes the H i and He i lines, while the rest of the table lists all the other permitted lines. Forbidden lines, for example [Fe ii] at 1.25 and 1.64 μm, remain below the detection limit in both objects, while few H2v = 1–0 ro-vibrational transitions are observed in XZ Tau (Table 1).
As for the XZ Tau system, Hartigan et al. (2003), who observed the spectra of the XZ Tau A and B components separately, found that XZ Tau B is the richest in bright permitted emission lines. We therefore discuss our spectrum under the hypothesis that it is mainly dominated by the XZ Tau B contribution.
5.3. Accretion luminosity and mass-accretion rates
We used the estimated J-band magnitude of the two stars (see Sect. 4) to flux-calibrate the Paβ spectrum and use it to derive the accretion luminosity of the two sources. The derived Paβ fluxes are 1.1 × 10⁻¹² and 1.9 × 10⁻¹² erg s-1 cm-2 for XZ Tau and DR Tau, respectively. We then converted the flux into a line luminosity adopting for XZ Tau AV = 1.4 mag (Hartigan & Kenyon 2003) and for DR Tau AV = 1.85 mag (Banzatti et al. 2014), and used the line-accretion luminosity relationship given in Alcalá et al. (2014) to obtain Lacc = 0.34 and 0.79 L⊙, respectively.
For XZ Tau, assuming that most of the accretion luminosity is derived from XZ Tau B with a mass of 0.4 M⊙ and a radius of 1.2 R⊙ (Hartigan & Kenyon 2003), we estimate a mass accretion rate Ṁacc = 4.2 × 10⁻⁸M⊙ yr-1. For comparison, we note that the Paβ flux that we obtain in XZ Tau and that we used to compute the Ṁacc is about a factor two higher than the flux measured by Lorenzetti et al. (2009) in 2007, during a high state of the object.
Emission line parameters.
For DR Tau, we adopt M⋆ = 0.75 M⊙ and R⋆ = 2.2 R⊙ (e.g. Rigliaco et al. 2013), deriving Ṁacc = 8.4 × 10⁻⁸M⊙ yr-1. Banzatti et al. (2014) monitored the DR Tau accretion luminosity variations during November 2012–January 2013, finding Lacc variations between 1.5 and 3.5 L⊙, corresponding to variations of Ṁacc between 1.6 and 3.9 × 10⁻⁷M⊙ yr-1. Lorenzetti et al. (2009), in their monitoring during a one year period between 2007 and 2008, measured Lacc variations between 0.9 and 2.4 L⊙. It seems therefore that Lacc variations up to a factor of five on timescales of months are common in DR Tau, and that we have now monitored a period of relatively low accretion activity of this star.
In conclusion, both sources are CTT stars that display high accretion luminosity values, with XZ Tau showing a Lacc higher than its mean level, and DR Tau showing a lower than normal Lacc, albeit still greater than the one of XZ Tau.
6. Veiling and projected rotational velocity
In addition to the emission lines, the two spectra show several absorption lines characteristic of late-type photospheres. These features have been used to derive the projected rotational velocity (vsini) and veiling (rλ) of the targets, fixing their spectral types to the values recently found in the literature (i.e. M2 and K7 for XZ Tau and DR Tau, respectively (Hartigan & Kenyon 2003; Edwards et al. 2006). The veiling can in turn be used to infer the properties of the emission in excess to the stellar photosphere originating in the inner disk.
To this aim, we developed an interactive IDL5 routine that compares, for each spectral order, the target spectra with template spectra of comparable spectral types of slowly rotating, non-accreting stars (i.e. with no intrinsic continuum veiling) conveniently acquired with the same spectrograph. Before determining the required level of continuum excess, the removal of telluric absorption lines was performed both for target and templates. The spectra of HIP 103087 and HIP 029147 were used to remove the telluric contribution from the spectra of HD 119850 and HD 28343, respectively. Then, each template was aligned in wavelength with the target spectrum via cross-correlation and artificially broadened by convolution with a rotational profile of increasing vsini (Gray 2005) until the minimum residuals were obtained. Appropriate linear limb-darkening coefficients by Claret & Bloemen (2001) were taken into account within the rotational profile and for each spectral region. The code evaluated the degree of continuum veiling of the target stars considering the following equation: 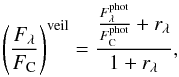 (1)where
  and
and  represent the line and continuum fluxes of the underlying photosphere, respectively. The template spectra were then artificially veiled by adding an excess continuum (leaving the parameter rλ free to vary) until the depth of photospheric features matched the depth of the features in the target spectra and the minimum residuals were found. We assumed rλ constant within each spectral order. A similar procedure was followed also by other authors (e.g. White & Hillenbrand 2004; Edwards et al. 2006; Frasca et al. 2015).We were able to perform the described procedure for 12 spectral orders for XZ Tau and 9 for DR Tau, owing to the larger veiling of DR Tau. In Fig. 2 we show examples of three spectral regions in the YHK bands of the XZ Tau and DR Tau spectra where the veiling was computed. The veiling values measured in the considered spectral orders are listed in Table 2 for both targets, together with the rotational velocity. Our procedure implicitly assumes a solar metallicity for both the templates and the sources.
The mean vsini of XZ Tau is 17.6 ± 2.5 km s-1, which is in agreement with recent findings (Nguyen et al. 2012). Edwards et al. (2006) measured the veiling at 1 μm in XZ Tau finding it consistent with 0. We measure r1 μm ~ 0.4 by averaging the values found in the two ranges around 1 μm. This finding indicates that the veiling might have changed in the last years and that XZ Tau was probably in a phase of increasing IR excess during our more recent observations. Hartigan et al. (2003) observed the optical spectra and measured the veiling at 8115 Å separately for the two stars of the XZ Tau system. They found that the primary component (XZ Tau B, that they call XZ Tau p) is the richest in optical lines and has the largest optical excess. They measured r8115 Å~1.3 for XZ Tau B and 0.06 for XZ Tau A. On this basis, we suggest that the increased veiling value that we measure, with respect to the Edwards et al. (2006) determination, is dominated by the excess of XZ Tau B, which seems to be the most active of the two stars.
For DR Tau, we were able to obtain a vsini~6.5 km s-1 for two spectral orders (in agreement with the value of 6.26 ± 0.12 km s-1 measured by Nguyen et al. 2012), and upper limits for the other orders. The veiling in DR Tau has been measured in the past by several authors who estimated different values at different epochs. In particular, the veiling given in the literature ranges between 2 and 3.5 at 1 μm and between 2.5 and 6 at about 1.5 μm (Edwards et al. 2006; McClure et al. 2013; Fischer et al. 2011). We find values closer to the high veiling determinations measured by Fisher et al. (2011).
For both targets, the resultant excess flux appears to increase with wavelength throughout the observed range 0.96−2.4 μm (see Fig. 3). The shape of the rλ−λ plot implies emission from optically thick material at a characteristic temperature. We were able to qualitatively match the shapes using single-temperature blackbodies at T ~ 1600 K for XZ Tau and T ~ 2350 K for DR Tau, with emitting areas ~29 and ~28 times greater than the central star, respectively. The derived blackbody temperatures are in the range found in other T Tauri stars (e.g. Muzerolle et al. 2003; McClure et al. 2013).
Veiling values for both targets at several wavelength ranges.
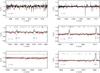 |
Fig. 2 Left: three portions in the YHK bands of the GIANO spectrum of XZ Tau (solid black line) with the rotationally-broadened and veiled spectrum of the M2 template (dashed red line) overplotted in the same wavelength ranges. Absorption features, mainly of the iron-peak group, are indicated with short lines. We refer interested readers to Rayner et al. (2009) and Sharon et al. (2010) for more details about absorption features. In the bottom panel, 12CO and 13CO molecular bands are represented by a horizontal line. Main emission features are marked and excluded from the analysis. Right: the same for DR Tau in three different wavelength regions, with the dashed red line representing the K7 template. |
The temperature estimated for XZ Tau is consistent with an origin of the emission excess in the inner rim of the dusty disk, where dust starts to photoevaporate.
The higher blackbody temperature of DR Tau, however, is incompatible with dust emission in the inner disk, as dust is destroyed at a temperature of around 1500 K. On the other hand, the derived filling factor exceeds the size of the star, excluding that the origin of the excess is the warm post-shocked gas associated with accretion hot spots. A possible source of emission excess could be found in a thick gaseous disk inside the dust sublimation radius, as already also suggested by Fischer et al. (2011). This scenario is consistent with the dust inner radius of ~0.1 AU measured in DR Tau from interferometric observations (Eisner et al. 2005). Indeed, we derive an emission radius about 5.3 times larger than the stellar radius, that is, ~0.05 AU if we adopt R⋆ = 2.2R⊙ (Rigliaco et al. 2013).
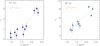 |
Fig. 3 Veiling as a function of wavelength for both targets. Error bars refer to ±1σ of residuals. Red dashed line represents the ratio of blackbodies at the photospheric and boundary layer temperatures (see text). |
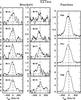 |
Fig. 4 Continuum subtracted spectra of the H i lines detected in XZ Tau. Flux is in arbitrary units. |
7. Properties of the permitted lines
7.1. Hydrogen lines
The strongest emission lines in the observed spectra are the hydrogen Paschen (from Paβ to Paγ) and Brackett (from Br10 to Br20) lines. We remind that Brγ is not observed as it falls in a hole of the GIANO spectral coverage.
Hydrogen line profiles are displayed in Figs. 4 and 5 for XZ Tau and DR Tau, respectively, while Fig. 6 shows a superposition of bright H i lines to better highlight differences among different line profiles. The profiles show some similarities between the two sources. In both sources the Paschen lines are the most asymmetric, with asymmetries in the red-shifted part of the line that are more prominent in the Paβ transition. In DR Tau, an inverse-P Cygni profile is detected in the Paγ and Paδ lines. Such a feature is observed also in the Hδ line while it is absent in the Hα and Hβ lines (Petrov et al. 2011; Alencar et al. 2001) which, on the contrary, are strongly peaked at red-shifted velocities. The high-n Brackett lines are more symmetric, consistent with their lower optical depth with respect to line emission from lower levels (e.g. Antoniucci et al. 2017; Nisini et al. 2005). In DR Tau, both Paschen and Brackett lines present a blue-shifted excess suggesting the presence of two gas components. Blue-shifted wings are detected also in the Paschen lines of XZ Tau, but they are less evident in the Brackett lines, perhaps due to a worse line to continuum ratio in these lines.
In the case of DR Tau, we have deconvolved the lines where this excess is more prominent, namely the Paγ, Paδ, Br 10 and Br11, using two main Gaussian emission components and a red-shifted absorption component for the Paschen lines (see Fig. 7). One of the emission components is marginally red-shifted (~10–20 km s-1) and has widths of about 100–150 km s-1, while the second emission component is blue-shifted (~−70–− 90 km s-1) and slightly broader (~110–150 km s-1). This blue-shifted component could be related to the wind at the origin of the absorption in the Hα line (Alencar et al. 2011). This feature shows large variability in both equivalent width (from absorption to emission) and velocity peak (from about −60 to −200 km s-1). Alencar et al. (2011) suggest that this variability in the blue side of the profile can be caused by a sporadic occurrence of high-velocity outflows coupled with geometrical effects. We return to the wind variability in Sect. 8.
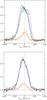 |
Fig. 6 Continuum-normalised H i line profiles in DR Tau (top) and XZ Tau (bottom). The following lines are depicted: Paβ (purple), Paγ (blue), Paδ (green), Br10 (orange) and Br11 (red). |
The observed composite profiles, with red-shifted asymmetries and P Cygni direct and inverse features are qualitatively predicted by models that combine excitation in accretion columns and disk winds (e.g. Muzerolle et al. 2001; Kurosawa et al. 2011).
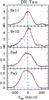 |
Fig. 7 The Profile of bright HI lines in DR Tau deconvolved with two Gaussians, one centred close to systemic velocity and the other blue-shifted at Vsys ~ −70/−100 km s-1. |
7.2. Metallic lines
Strong emission is also seen in neutral permitted lines of Fe i, C i, Si i, O i, and Ca i (see Table 1). They cover excitation energies from ~3 eV up to ~10 eV. Neutral species are detected: given the low ionization potential of some of the observed species (e.g. Fe: 7.87 eV, and Si: 8.15 eV), this occurrence indicates that the emission region of these lines should be predominantly neutral.
We note that the emission spectra of XZ Tau and DR Tau are quite different, as in DR Tau we detect a much lower number of metallic lines. The lines in common between the two sources are mainly the C i transitions, which are among the brightest lines in the spectrum. The EW of these lines is comparable in the two objects, while, for example, DR Tau has on average larger EW in the H i lines. The width of the DR Tau metallic lines is also systematically smaller than in XZ Tau. We suggest that the detection of only few metallic lines in DR Tau, as compared to XZ Tau, is mainly due to an intrinsic difference in the excitation conditions of the line emission regions in the two stars.
All Fe i lines detected in XZ Tau have relatively high upper energy levels (up to 7.45 eV), close to the Fe i ionisation potential (7.87 eV). This differs from the case, for example, of the EXor V1118 Ori (Giannini et al. 2017), whose near-IR spectrum in burst shows Fe i lines coming only from lower energy levels, that is, between 3 and 6 eV. Also the optical spectrum of DR Tau shows Fe i lines originating from levels at energies between 3 and 6 eV (Berinstain et al. 1998). We therefore suggest that the non-detection of Fe i in our DR Tau spectrum could be associated with lower excitation conditions with respect to XZ Tau and that the lower excitation Fe i lines, that are detected in V1118 Ori during the burst phase, are not seen in DR Tau due to their intrinsic weakness with respect to the optical lines.
Sicilia-Aguilar et al. (2012) present the spectrum of EX Lup for both quiescence and outburst, showing that during the burst, the number of detected metallic lines tends to increase and that the lines broaden. The larger number of broader lines detected in XZ Tau at high excitation with respect to DR Tau could then be related to the particularly active phase of this source, as we will also discuss in Sect. 8. We however point out that at the date of the observations XZ Tau had a lower accretion luminosity and veiling than DR Tau, therefore it is unlikely that accretion alone is at the origin of the difference in the line excitation of the two objects.
7.3. Line widths
In Fig. 9 we plot the width of the HI lines in the two sources, measured as the FWHM of the associated Gaussian fit, as a function of the upper level quantum number. The figure shows that the line widths tend to decrease with the n-value, at least up to nup ~ 12. A similar effect was observed also in the EXor variable V1118 Ori, where Balmer, Paschen, and Brackett lines were considered (Giannini et al. 2017), and cannot be reconciled with emission from magnetospheric accretion alone. In fact, in this framework the velocity is increasing as the ionised gas approaches the stellar surface, thus optically thick lines at high excitation energy should be characterised by larger widths.
The effect of decreasing width with upper quantum number can be in part explained by the presence, in addition to the accretion component, of a wind component, contributing in different proportion to the line profiles due to their different decrements (e.g. Antoniucci et al. 2017). For DR Tau, we additionally plot the FWHM of the principal component resulting from the line deconvolution shown in Fig. 7 (open dots). The evidence of decreasing widths, although still present, is now less prominent. An additional effect could be due to the strong self-absorptions characterising the Paschen lines, and the Paβ in particular, causing the line widths to be overestimated. This is particularly evident in the DR Tau Paβ line, where the observed double peak is clearly ascribed to self-absorption, as the more symmetric lines with higher nup are centered around zero velocity, where Paβ has a relative minimum.
The widths of the metallic transitions significantly vary among lines, and range from ~40 to 150 km s-1. The line widths are too large to be compatible with pure chromospheric emission. On the other hand, gas from the accretion funnel is expected to be ionised and to produce broader lines, such as the HI lines. The observed widths of the neutral metallic lines are consistent with an origin in the post-shock region of the accretion columns or in the inner disk, where the gas is heated to a few thousand K (Berinstain et al. 1998; Sicilia-Aguilar et al. 2012; Giannini et al. 2017).
In Fig. 10 we report the FWHM of the XZ Tau permitted lines as a function of the energy level (upper panel) and line EW (bottom panel). Line widths do not show any appreciable trend with species or energy level when all the transitions are considered. The plot only very roughly suggests that the narrower lines (~40–60 km s-1) are located at energies between 5 and 7 eV, while the broader lines (~150–200 km s-1) are the H i lines (the Paschen and low-n Brackett in particular). The bottom panel of Fig. 10 shows instead that the FWHM is well correlated with the line EW, irrespective of the considered species. A similar correlation was previously reported by Beristain et al. (1998) for the Fe i optical lines detected on DR Tau. The authors interpreted this correlation as due to the presence of two components in the line profiles, a narrow and a broad component, that contribute in different proportions among lines with different intensity. In practice, the broad component contributes to the overall line broadening only when the signal-to-noise ratio is sufficiently high that the line wings are well detected. In XZ Tau, we see that this correlation extends to a wider range of species, including the H i lines. Some of the detected lines have profiles that are not well reproduced by a single Gaussian, such as, for example, the H i lines discussed in the previous section. However, in most cases it is not possible to disentangle different components in the line profiles. We believe that, in addition to the presence of double components, other causes could be at the origin of the found correlation; namely optical depth effects (lines with high optical depth can be auto-absorbed, thus showing larger FWHM) and the presence of unsorted blending of different lines in broad metallic lines.
8. The helium 1.08 μm line: origin and variability
Figure 11 shows the He i 1.08 μm line in the two sources. In both cases, the He i line has a composite profile, with an emission component roughly centred around the systemic velocity, and a prominent blue-shifted absorption below the continuum. This last feature is common in the He i profiles of T Tauri stars and is a recognised signature of hot winds close to the star (Edwards et al. 2003). The width and depth of this absorption provide direct constraints on the inner winds geometry and acceleration region (Kwan et al. 2007; Kurosawa et al. 2011). Spectra of the He i line at different epochs are available for both XZ Tau and DR Tau, and some insight on the origin of the observed line can be obtained not only from its shape but also from its temporal variations. In Fig. 11 in particular, we compare our observed profiles with those obtained by Edwards et al. (2006) with NIRSPEC on Keck II (R = 25 000). These figures also show the variations of the Paγ profile in the same epochs.
For XZ Tau, our spectrum is compared with the Keck spectrum acquired in Nov. 2002. The main feature of the profile observed in Nov. 2002 was that the blue-shifted absorption was not continuous but appeared to be composed by several absorption features with different depths at different velocities, up to 300 km s-1. This kind of profile can be interpreted as originating in a disk-wind. Indeed, in contrast to a radially symmetric expanding stellar wind, in a disk wind the continuum from the star will intercept a much narrower range of velocities, which will be confined to nearly parallel streamlines emerging from the disk surface. The fact that different narrow absorptions are present in the XZ Tau profile indicates that the disk wind has a complex and non-uniform structure. With respect to 2002, the He i profile observed by GIANO in 2014 shows a much broader and deeper blue-shifted absorption, extending up to 500 km s-1. In this time span the He i emission component has also broadened and brightened with a simultaneous increase of the Paγ equivalent width by a factor more than 10, which passed from EW = 1 Å (Edwards et al. 2003) to EW = 16 Å in 2014. These evidences, together with the increases in the 1 μm veiling already discussed in Sect. 6, hint at line profile changes that are connected with mass accretion rate variability: an increase in the mass accretion rate results in brightening of accretion-related emission lines, such as the Paγ, and of the 1 μm excess causing the line veiling. At the same time, accretion might have induced a dramatic change in the wind structure, and/or the onset of a new flow component very close to the star (i.e. at a speed close to the stellar escape velocity). As already discussed in Sect. 7, the fact that XZ Tau was in a particularly high state of accretion is also testified by the higher mass-accretion rate derived from our data when compared to that implied by previous Paβ observations (Lorenzetti et al. 2009). In addition, the H-band magnitude at the time of our observations was significantly lower than that measured in November 2002 (i.e. 7.6 against 8.3 mag, Hioki et al. 2009). We cannot discern, from these two epoch observations, the timescales for the observed variability. Chou et al. (2013) report short term variability of emission line profiles on daily and monthly bases, in addition to a long-term variability on 3–10 yr timescales. Additional observations are needed to understand with which of the above variability scales the observed wind variability is associated.
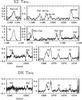 |
Fig. 8 Continuum-subtracted portions of the XZ Tau and DR Tau spectra showing examples of detected metallic lines. |
In the case of DR Tau, several comparison spectra are available, acquired both in 2002 and in 2006. The profile of the He i line presents significant differences with respect to that of XZ Tau. DR Tau shows indeed a broad and deep blue-shifted absorption extending to –350 km s-1, which suggests the formation in a stellar wind. In fact, the broad range of velocities covered by the absorption feature can be explained by a radially emerging wind absorbing the 1 μm continuum from the stellar surface, thus tracing the full acceleration region of the inner wind (Kwan et al. 2007). Noticeably, the blue-shifted absorption component does not significantly change in the various spectra. At variance, the line component in emission is subject to significant variations on time-scales of days, indicating that the emission component mainly arises from a mechanism different from the wind itself. As also discussed in Sect. 7, variability of H i lines have been observed in DR Tau, with periods ranging from 4 to 9 days (Alencar et al. 2001). Such a variability has been linked to shock emission in hot spots combined with stellar rotation. The emission component of the He i line could be imputed to the same mechanism, although the lack of correlation between the variation of the He i emission and that of Paγ likely indicates that the two lines react in different ways to changes in the accretion shock conditions. Balmer line profiles (Alencar et al. 2001) show extended blue-shifted wing components with a maximum velocity of more than 400 km s-1. However and at variance with the He i 1.08 μm line, these components show a strong variability as their intensity and peak velocity change on timescales of a few days, passing from absorption to emission. It is therefore unlikely that they are related to the very stable stellar wind responsible for the deep absorption seen in the He i line. We finally note that when the He i emission component is significantly fading, a red-shifted absorption is observed, peaking at roughly the same velocity (~200 km s-1) as the inverse-P Cygni observed in the Paγ profile. This absorption feature is probably cancelled out when the broad emission component becomes stronger.
The reason why the sub-continuum absorption of the two sources has such a different behaviour (i.e. a steady stellar wind in DR Tau and a highly variable disk wind in XZ Tau) remains unclear. Geometry may play a role in this respect. DR Tau is known to be close to pole-on, meaning that we are probably looking at the polar region of a stellar wind (either spherical or conical). On the other hand, XZ Tau is inclined by ~30° with respect to the plane of the sky, consequently the disk wind is more directly viewed. Disk winds seem therefore to react to accretion variability more directly than stellar winds.
9. H2 lines in XZ Tau
The GIANO spectrum of XZ Tau shows emission from three H2v = 1–0 ro-vibrational lines (Fig. 12). The lines are narrow but resolved at the 6 km s-1 resolution of GIANO. The 2.12 μm line, in particular, shows a profile that is not Gaussian but presents prominent wings. We deconvolved this profile into two Gaussian components, a narrow one, centred close to systemic velocity, and a blue-shifted and broader component (see Fig. 13) The parameters of this deconvolution are given in Table 2. The narrow component has a width of ~13 km s-1, which, taking into account the instrument resolution, implies an intrinsic width of 11 km s-1. This small line width and the fact that the line does not show any appreciable velocity shift with respect to quiescence suggest that this emission might originate in a disk and be broadened as a result of the Keplerian rotation of the gas. Similar quiescent H2 emission has been observed in other low-mass T Tauri stars, for which an origin from excitation of the disk gas by UV or X-rays stellar photons was suggested (e.g. Bary et al. 2003, 2008). ALMA 1.3 mm observations of the XZ Tau system have resolved a compact disk of radius 3.2 AU around XZ Tau B (Osorio et al. 2016). In the hypothesis that the quiescent H2 emission we observe originates from this disk, we can estimate the innermost H2 emission radius from the measured profile, that is, Rin = GM∗ × (sin(i) / ΔV)2. Here i is the disk inclination angle, which we take to be equal to 35° (Osorio et al. 2016), M∗ = 0.37M⊙, and ΔV is the maximal velocity of the H2 emitting gas, which we take to be equal to 1.7 × HWHM following the prescription by Salyk et al. (2011). We derive Rin ~ 1.2 AU, which is about equal to the inner radius of the 1.3 mm disk observed by ALMA (1.3 AU, Osorio et al. 2016). Hence in this hypothesis, the near-IR H2 emission is excited in the inner rim of the dusty disk. If, instead, part of the narrow emission comes also from the A source, the derived inner radius can be considered as a lower limit and one should conclude that the H2 originates from a region of the disk where both gas and dust coexist.
The blue-shifted broad component has instead a line width of about 39 km s-1, which is typical of shock-excited gas (Flower et al. 2003). Beck et al. (2008), present images of the H2 spatial distribution in the surrounding of XZ Tau showing extended line emission both around the sources and in an arc-shaped structure located at about 0.̋5 from the binary. We suggest that the broad component originates from this structure, which likely represents gas shock-excited in the XZ Tau expanding wide-angle flow. We also remark that the radial velocity of this blue-shifted component is compatible with the velocity of the CO(1-0) emission associated with the outflowing gas as observed by ALMA (Zapata et al. 2015).
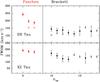 |
Fig. 9 Measured FWHM of H i Paschen and Brackett lines in DR Tau (upper) and XZ Tau (bottom). Upper limits are indicated by arrows. Open dots in the DR Tau plot indicate the width of the main line component once the blue-shifted component has been removed through profile decomposition. |
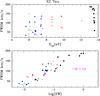 |
Fig. 10 FWHM of the permitted lines detected in XZ Tau plotted as a function of the log of the EW (bottom) and the energy (in eV) of the upper level (top). Symbols and colour-codes are as follows: black filled circles = H i; blue filled squares = Fe i; red filled triangles = C i; green open triangles = Si i; purple crosses = others. |
10. Conclusions
We have presented near-IR (0.95–2.4 μm) high-resolution (R = 50 000) spectra of the two EXor-type variables XZ Tau and DR Tau, obtained with the GIANO instrument on TNG. The analysis of the emission and absorption features in these spectra allowed us to investigate the gas properties in the interaction region between the star and the inner accretion disk.
Different evidences show that XZ Tau was in a fairly high state of accretion during the GIANO observations. This is suggested in particular by a comparison with Keck IR spectra acquired in the past. With respect to previous observations, we measure an increase of both IR veiling and EW of the Paγ line. Simultaneous variations of the blue-shifted absorption feature in the He i 1.08 μm line suggest that the inner wind has undergone a dramatic change in its velocity structure. From the Paβ luminosity, calibrated with almost simultaneous photometry, we estimate a mass accretion rate Ṁacc = 4.2 × 10⁻⁸M⊙ yr-1. DR Tau shows a lower than normal Lacc, although still higher than the one displayed by XZ Tau in its enhanced accretion state. Both sources are in any case CTT stars that display high accretion luminosity values (Lacc = 0.34 for XZ Tau and 0.79 L⊙ for DR Tau).
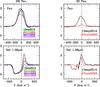 |
Fig. 11 Left: continuum normalised spectra of the He i 1.08 μm (bottom panel) and Paβ (upper panel) line profiles of DR Tau observed in different epochs. Black curves refer to the more recent GIANO spectra presented in this paper, whereas coloured curves are Keck spectra from Edwards et al. (2006) acquired on different dates in 2002 and 2006. Right: same for XZ Tau. |
H i and He i lines are not symmetric in both sources, thus testifying the presence of different components (from accretion and wind regions) contributing to the line profiles. Paschen lines are broad (ΔVsys ~ 180 and 200 km s-1 in XZ Tau and DR Tau, respectively) and show red-shifted asymmetries in both sources. Inverse P Cygni absorption is observed in the Paγ of DR Tau. Brackett lines are more symmetric and narrower. In DR Tau, two emission components are clearly recognisable in Paschen and Brackett lines of higher signal-to-noise ratio, one centred at velocity close to zero and the other blue-shifted at Vsys = −100 km s-1. This latter can be associated with emission from a high-velocity wind previously underlined in the profiles of Balmer lines (Alencar et al. 2001). A prominent high-velocity stellar wind is also traced by the broad and deep absorption feature of the He i 1.08 μm line. At variance with XZ Tau, this feature appears stable in time, in spite of significant variations not only of the emission component of the He i and Paγ lines, but also of the blue-shifted wind component probed by the Balmer lines. This suggests that the inner hot region of the stellar wind traced by the He i absorption is not affected by short-term variations in the accretion and disk-wind flows occurring in different regions and on different spatial scales.
From the comparison of the target photospheric spectra with that of template spectra of comparable spectral types, we were able to measure the IR veiling as a function of wavelength. The spectral energy distribution of the IR veiling can be fitted with a single blackbody having emitting areas ~30 times the stellar surface. In XZ Tau the fitted blackbody has a temperature T = 1600 K. The 1 μm veiling is higher than measured by Edwards et al. (2002), but the shape and blackbody temperature are similar to those found in other T Tauri stars of similar luminosity. The finding is consistent with emission from the inner region of a circumstellar disk where the dust starts to sublimate. DR Tau shows a much larger veiling, as previously reported in the literature, consistent with a blackbody at T = 2300 K. At this temperature we expect the dust to be already destroyed, therefore the DR Tau IR excess is more consistent with emission from an optically thick gaseous disk. The possibility that part of or all the IR veiling in the range of temperatures between 2000 and 5000 K might arise from an inner dust-free gaseous disk has been discussed by Fisher et al. (2011), who recognised that CTT stars often show an excess emission in the IYJ bands consistent with this range of temperatures.
In the XZ Tau spectrum we detect strong permitted metallic lines from neutral species such as Fe i, C i, Ca i, and Si i, whereas the DR Tau spectrum shows only a few narrower metallic lines, mainly from C i. No ionised species are observed in either source. In general, the metallic lines in XZ Tau seem to originate in a gas that is more excited than in DR Tau. This evidence excludes that the excitation of these lines is mainly driven by accretion, as DR Tau has a larger veiling and accretion luminosity than XZ Tau.
The H2 2.12 μm line observed in XZ Tau shows two emission components: a narrow one centred at zero velocity, which is compatible with an origin from a gaseous disk, and a blue-shifted broad component that is probably shock-excited in the XZ Tau expanding wide-angle flow.
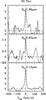 |
Fig. 12 Observed H2 lines in XZ Tau. |
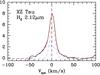 |
Fig. 13 Profile of the H2 2.12 μm line detected in XZ Tau with the fit of the two Gaussian components superimposed. The red-dashed line is the best fit obtained by the sum of the two Gaussian components plotted as blue-dashed lines. Parameters of the two components are given in Table 2. |
Parameters of the H2 lines.
The presented observations demonstrate the potential of wide-band, high-resolution near-IR spectroscopy to probe the different phenomena occurring in the region of interaction between the star magnetosphere and the accretion disk. In particular, these observations demonstrate that a resolution of 50 000 is required to kinematically separate winds and accretion regions in the profiles of permitted lines, or disk-bound gas from shock emission in H2 lines. In addition, simultaneous observations at high resolution of the entire NIR range open the possibility to study in detail the variations of the IR veiling with wavelength, hence helping to constrain the properties of the inner disk. The planned upcoming combination of an upgrade of GIANO with the HARPS-N optical instrument (the GIARPS facility at TNG, Claudi et al. 2016) will help to further improve the unified picture of the accretion and ejection phenomena in young disks, through observation of complementary optical tracers (e.g. veiling from accretion shocks and wind forbidden lines).
More details can be found on the GIANO website http://www.tng.iac.es/instruments/giano and in the document available at http://www.bo.astro.it/giano/documents/new_GIANO_cookbook_for_data_reduction.pdf
IRAF is distributed by the National Optical Astronomy Observatory, which is operated by the Association of the Universities for Research in Astronomy, inc. (AURA) under cooperative agreement with the National Science Foundation.
IDL (Interactive Data Language) is a registered trademark of Exelis Visual Information Solutions.
Acknowledgments
We thank the anonymous referee for her/his very helpful suggestions that helped us to greatly improve our paper. We are very thankful to the staff of the Campo Imperatore Observatory for carrying out the photometric observations for the EXORCISM monitoring program. We are grateful to Suzan Edwards for providing the Keck spectra of XZ Tau and DR Tau. K.B. thanks the Osservatorio Astronomico di Roma for the support given during her visits. K.B. was financially supported by the PRIN INAF 2013 “Disks, jets, and the dawn of planets”. We acknowledge with thanks the variable star observations from the AAVSO International Database contributed by observers worldwide and used in this research.
References
- Alcalá, J. M., Natta, A., Manara, C. F., et al. 2014, A&A, 561, A2 [NASA ADS] [CrossRef] [EDP Sciences] [Google Scholar]
- Alcalá, J. M., Manara, C. F., Natta, A., et al. 2017, A&A, 600, A20 [NASA ADS] [CrossRef] [EDP Sciences] [Google Scholar]
- Alencar, S. H. P., Johns-Krull, C. M., & Basri, G. 2001, AJ, 122, 3335 [NASA ADS] [CrossRef] [Google Scholar]
- Alexander, R., Pascucci, I., Andrews, S., Armitage, P., & Cieza, L. 2014, Protostars and Planets VI, 475 http://adsabs.harvard.edu/abs/2014prpl.conf..475A [Google Scholar]
- Antoniucci, S., Arkharov, A. A., Di Paola, A., et al. 2013, Protostars and Planets VI Posters, 2 [Google Scholar]
- Antoniucci, S., García López, R., Nisini, B., et al. 2014a, A&A, 572, A62 [NASA ADS] [CrossRef] [EDP Sciences] [Google Scholar]
- Antoniucci, S., Arkharov, A. A., Di Paola, A., et al. 2014b, A&A, 565, L7 [NASA ADS] [CrossRef] [EDP Sciences] [Google Scholar]
- Antoniucci, S., Nisini, B., Giannini, T., et al. 2017, A&A, 599, A105 [NASA ADS] [CrossRef] [EDP Sciences] [Google Scholar]
- Audard, M., Ábrahám, P., Dunham, M. M., et al. 2014, Protostars and Planets VI, 387 [Google Scholar]
- Banzatti, A., Meyer, M. R., Manara, C. F., Pontoppidan, K. M., & Testi, L. 2014, ApJ, 780, 26 [NASA ADS] [CrossRef] [Google Scholar]
- Bary, J. S., Weintraub, D. A., & Kastner, J. H. 2003, ApJ, 586, 1136 [NASA ADS] [CrossRef] [Google Scholar]
- Bary, J. S., Weintraub, D. A., Shukla, S. J., Leisenring, J. M., & Kastner, J. H. 2008, ApJ, 678, 1088 [NASA ADS] [CrossRef] [Google Scholar]
- Beck, T. L., McGregor, P. J., Takami, M., & Pyo, T.-S. 2008, ApJ, 676, 472 [NASA ADS] [CrossRef] [Google Scholar]
- Beristain, G., Edwards, S., & Kwan, J. 1998, ApJ, 499, 828 [NASA ADS] [CrossRef] [Google Scholar]
- Caffau, E., Andrievsky, S., Korotin, S., et al. 2016, A&A, 585, A16 [NASA ADS] [CrossRef] [EDP Sciences] [Google Scholar]
- Calvet, N., & Gullbring, E. 1998, ApJ, 509, 802 [NASA ADS] [CrossRef] [Google Scholar]
- Carleo, I., Sanna, N., Gratton, R., et al. 2016, Exp. Astron., 41, 351 [NASA ADS] [CrossRef] [Google Scholar]
- Carrasco-González, C., Rodríguez, L. F., Anglada, G., & Curiel, S. 2009, ApJ, 693, L86 [NASA ADS] [CrossRef] [Google Scholar]
- Chou, M.-Y., Takami, M., Manset, N., et al. 2013, AJ, 145, 108 [NASA ADS] [CrossRef] [Google Scholar]
- Claudi, R., Benatti, S., Carleo, I., et al. 2016, Proc. SPIE, 9908, 99081A [CrossRef] [Google Scholar]
- D’Alessio, F., Di Cianno, A., Di Paola, A., et al. 2000, Proc. SPIE, 4008, 748 [NASA ADS] [CrossRef] [Google Scholar]
- Edwards, S., Fischer, W., Kwan, J., Hillenbrand, L., & Dupree, A. K. 2003, ApJ, 599, L41 [NASA ADS] [CrossRef] [Google Scholar]
- Edwards, S., Fischer, W., Hillenbrand, L., & Kwan, J. 2006, ApJ, 646, 319 [NASA ADS] [CrossRef] [Google Scholar]
- Eisner, J. A., Hillenbrand, L. A., White, R. J., Akeson, R. L., & Sargent, A. I. 2005, ApJ, 623, 952 [NASA ADS] [CrossRef] [Google Scholar]
- Fischer, W., Edwards, S., Hillenbrand, L., & Kwan, J. 2011, ApJ, 730, 73 [NASA ADS] [CrossRef] [Google Scholar]
- Flower, D. R., Le Bourlot, J., Pineau des Forêts, G., & Cabrit, S. 2003, MNRAS, 341, 70 [NASA ADS] [CrossRef] [Google Scholar]
- Folha, D. F. M., & Emerson, J. P. 2001, A&A, 365, 90 [NASA ADS] [CrossRef] [EDP Sciences] [Google Scholar]
- Frasca, A., Biazzo, K., Lanzafame, A. C., et al. 2015, A&A, 575, A4 [NASA ADS] [CrossRef] [EDP Sciences] [Google Scholar]
- Giannini, T., Antoniucci, S., Lorenzetti, D., et al. 2017, ApJ, 839, 112 [NASA ADS] [CrossRef] [Google Scholar]
- Gray, D. F. 2005, The Observation and Analysis of Stellar Photospheres, 3rd edn. (Cambridge University Press) [Google Scholar]
- Hartigan, P., & Kenyon, S. J. 2003, ApJ, 583, 334 [NASA ADS] [CrossRef] [Google Scholar]
- Johns-Krull, C. M., & Valenti, J. A. 2001, Young Stars Near Earth: Progress and Prospects, 244, 147 [NASA ADS] [Google Scholar]
- Kurosawa, R., Romanova, M. M., & Harries, T. J. 2011, MNRAS, 416, 2623 [NASA ADS] [CrossRef] [Google Scholar]
- Kwan, J., Edwards, S., & Fischer, W. 2007, ApJ, 657, 897 [NASA ADS] [CrossRef] [Google Scholar]
- Lorenzetti, D., Larionov, V. M., Giannini, T., et al. 2009, ApJ, 693, 1056 [NASA ADS] [CrossRef] [Google Scholar]
- Lorenzetti, D., Antoniucci, S., Giannini, T., et al. 2012, ApJ, 749, 188 [NASA ADS] [CrossRef] [Google Scholar]
- Manara, C. F., Testi, L., Herczeg, G. J., et al. 2017, A&A, 604, A127 [NASA ADS] [CrossRef] [EDP Sciences] [Google Scholar]
- McClure, M. K., Calvet, N., Espaillat, C., et al. 2013, ApJ, 769, 73 [NASA ADS] [CrossRef] [Google Scholar]
- Muzerolle, J., Calvet, N., & Hartmann, L. 2001, ApJ, 550, 944 [NASA ADS] [CrossRef] [Google Scholar]
- Muzerolle, J., Calvet, N., Hartmann, L., & D’Alessio, P. 2003, ApJ, 597, L149 [NASA ADS] [CrossRef] [Google Scholar]
- Nguyen, D. C., Brandeker, A., van Kerkwijk, M. H., & Jayawardhana, R. 2012, ApJ, 745, 119 [Google Scholar]
- Nisini, B., Antoniucci, S., & Giannini, T. 2004, A&A, 421, 187 [NASA ADS] [CrossRef] [EDP Sciences] [Google Scholar]
- Nisini, B., Bacciotti, F., Giannini, T., et al. 2005, A&A, 441, 159 [NASA ADS] [CrossRef] [EDP Sciences] [Google Scholar]
- Oliva, E., Origlia, L., Maiolino, R., et al. 2012, Proc. SPIE, 8446, 84463T [CrossRef] [Google Scholar]
- Origlia, L., Oliva, E., Baffa, C., et al. 2014, Proc. SPIE, 9147, 91471E [Google Scholar]
- Osorio, M., Macías, E., Anglada, G., et al. 2016, ApJ, 825, L10 [NASA ADS] [CrossRef] [Google Scholar]
- Petrov, P. P., Gahm, G. F., Stempels, H. C., Walter, F. M., & Artemenko, S. A. 2011, A&A, 535, A6 [NASA ADS] [CrossRef] [EDP Sciences] [Google Scholar]
- Rayner, J. T., Cushing, M. C., & Vacca, W. D. 2009, ApJS, 185, 289 [NASA ADS] [CrossRef] [Google Scholar]
- Rigliaco, E., Pascucci, I., Gorti, U., Edwards, S., & Hollenbach, D. 2013, ApJ, 772, 60 [NASA ADS] [CrossRef] [Google Scholar]
- Salyk, C., Blake, G. A., Boogert, A. C. A., & Brown, J. M. 2011, ApJ, 743, 112 [NASA ADS] [CrossRef] [Google Scholar]
- Sharon, C., Hillenbrand, L., Fischer, W., & Edwards, S. 2010, ApJ, 139, 646 [CrossRef] [Google Scholar]
- Sicilia-Aguilar, A., Kóspál, Á., Setiawan, J., et al. 2012, A&A, 544, A93 [NASA ADS] [CrossRef] [EDP Sciences] [Google Scholar]
- Tonry, J., & Davis, M. 1979, ApJ, 84, 1511 [Google Scholar]
- Tozzi, A., Oliva, E., Origlia, L., et al. 2014, Proc. SPIE, 9147, 91479N [CrossRef] [Google Scholar]
- White, R. J., & Hillenbrand, L. A. 2004, ApJ, 616, 998 [NASA ADS] [CrossRef] [Google Scholar]
- Zapata, L. A., Galván-Madrid, R., Carrasco-González, C., et al. 2015, ApJ, 811, L4 [NASA ADS] [CrossRef] [Google Scholar]
All Tables
All Figures
|
Fig. 1 Near-infrared (JHK bands) lightcurves of XZ Tau (top) and DR Tau (bottom) based on observations taken within the EXORCISM programme around the date of GIANO observations, which is indicated by the vertical dashed line. |
| In the text | |
|
Fig. 2 Left: three portions in the YHK bands of the GIANO spectrum of XZ Tau (solid black line) with the rotationally-broadened and veiled spectrum of the M2 template (dashed red line) overplotted in the same wavelength ranges. Absorption features, mainly of the iron-peak group, are indicated with short lines. We refer interested readers to Rayner et al. (2009) and Sharon et al. (2010) for more details about absorption features. In the bottom panel, 12CO and 13CO molecular bands are represented by a horizontal line. Main emission features are marked and excluded from the analysis. Right: the same for DR Tau in three different wavelength regions, with the dashed red line representing the K7 template. |
| In the text | |
|
Fig. 3 Veiling as a function of wavelength for both targets. Error bars refer to ±1σ of residuals. Red dashed line represents the ratio of blackbodies at the photospheric and boundary layer temperatures (see text). |
| In the text | |
|
Fig. 4 Continuum subtracted spectra of the H i lines detected in XZ Tau. Flux is in arbitrary units. |
| In the text | |
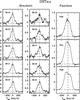 |
Fig. 5 The same as Fig. 4 but for DR Tau. |
| In the text | |
|
Fig. 6 Continuum-normalised H i line profiles in DR Tau (top) and XZ Tau (bottom). The following lines are depicted: Paβ (purple), Paγ (blue), Paδ (green), Br10 (orange) and Br11 (red). |
| In the text | |
|
Fig. 7 The Profile of bright HI lines in DR Tau deconvolved with two Gaussians, one centred close to systemic velocity and the other blue-shifted at Vsys ~ −70/−100 km s-1. |
| In the text | |
|
Fig. 8 Continuum-subtracted portions of the XZ Tau and DR Tau spectra showing examples of detected metallic lines. |
| In the text | |
|
Fig. 9 Measured FWHM of H i Paschen and Brackett lines in DR Tau (upper) and XZ Tau (bottom). Upper limits are indicated by arrows. Open dots in the DR Tau plot indicate the width of the main line component once the blue-shifted component has been removed through profile decomposition. |
| In the text | |
|
Fig. 10 FWHM of the permitted lines detected in XZ Tau plotted as a function of the log of the EW (bottom) and the energy (in eV) of the upper level (top). Symbols and colour-codes are as follows: black filled circles = H i; blue filled squares = Fe i; red filled triangles = C i; green open triangles = Si i; purple crosses = others. |
| In the text | |
|
Fig. 11 Left: continuum normalised spectra of the He i 1.08 μm (bottom panel) and Paβ (upper panel) line profiles of DR Tau observed in different epochs. Black curves refer to the more recent GIANO spectra presented in this paper, whereas coloured curves are Keck spectra from Edwards et al. (2006) acquired on different dates in 2002 and 2006. Right: same for XZ Tau. |
| In the text | |
|
Fig. 12 Observed H2 lines in XZ Tau. |
| In the text | |
|
Fig. 13 Profile of the H2 2.12 μm line detected in XZ Tau with the fit of the two Gaussian components superimposed. The red-dashed line is the best fit obtained by the sum of the two Gaussian components plotted as blue-dashed lines. Parameters of the two components are given in Table 2. |
| In the text | |
Current usage metrics show cumulative count of Article Views (full-text article views including HTML views, PDF and ePub downloads, according to the available data) and Abstracts Views on Vision4Press platform.
Data correspond to usage on the plateform after 2015. The current usage metrics is available 48-96 hours after online publication and is updated daily on week days.
Initial download of the metrics may take a while.